App store conversion optimization: find the leak before you redesign

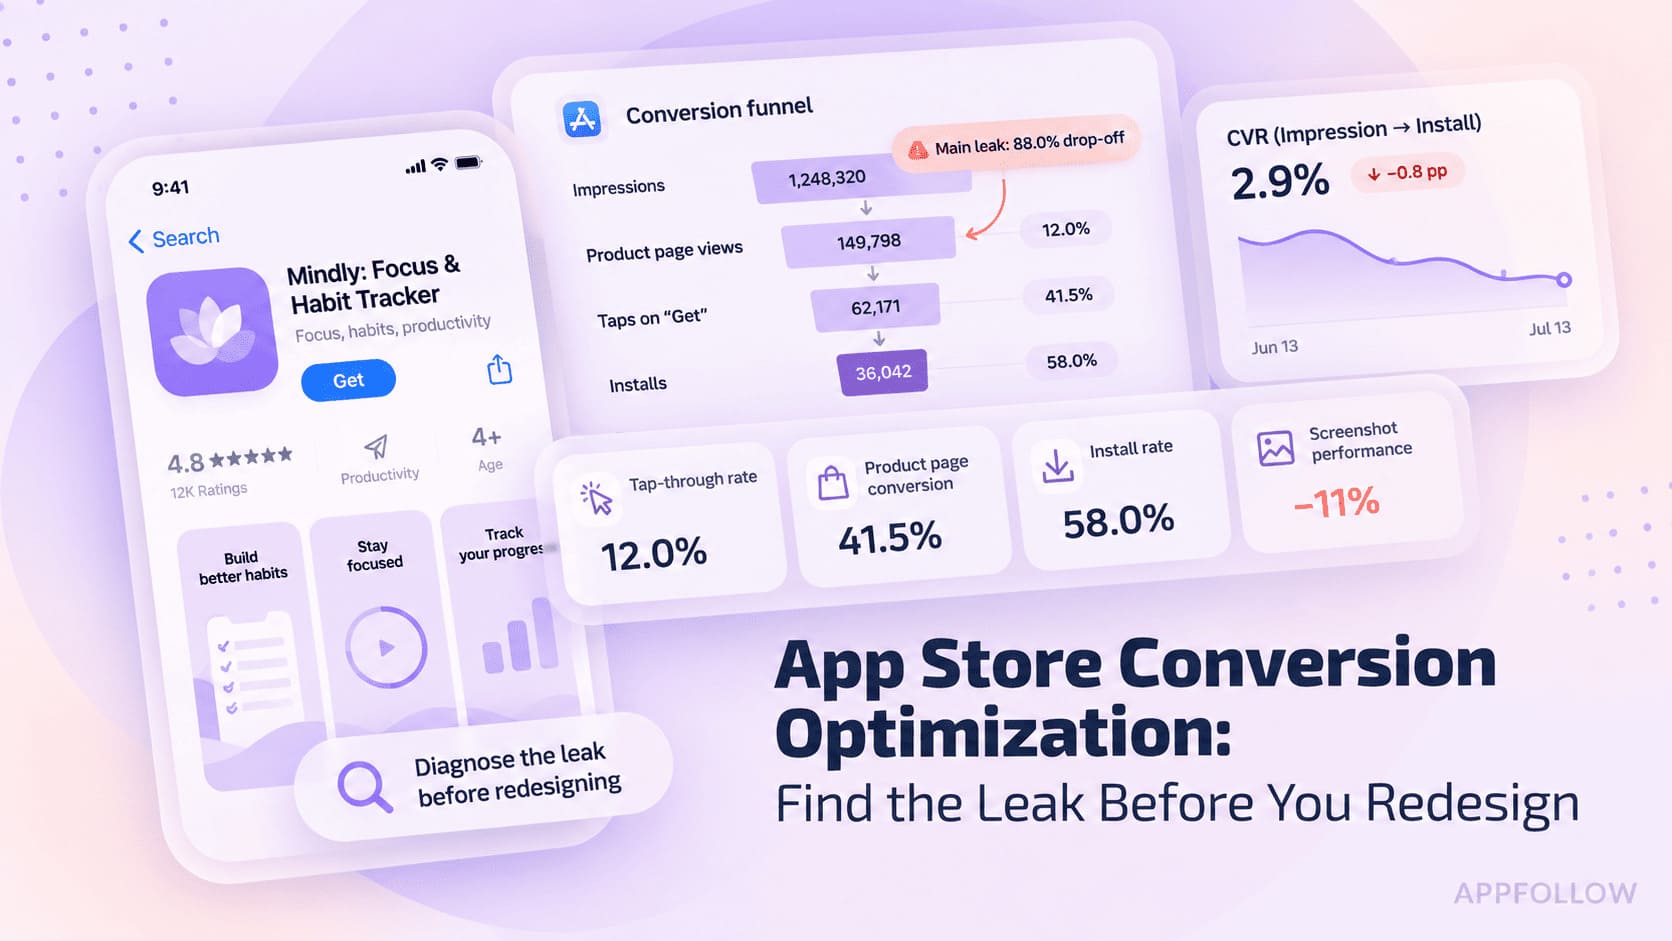
Table of Content:
- Key insights
- What app store conversion optimization actually measures
- What counts as a good conversion rate
- Which of your three funnels is leaking
- What to change when Search, Browse, or Referral slips
- How to run a store listing test you can interpret
- Three reporting mistakes that send teams after the wrong fix
- How to run one monthly conversion review across both stores
- FAQs
App store conversion optimization starts with finding where potential users drop out. Apple’s reported conversion rate uses downloads and pre-orders per unique device impression. Google Play’s listing report measures button clicks per listing visitor and reports completed acquisitions separately.
Impressions are up. Downloads are flat. Before asking design for new screenshots, check which traffic source moved. If Search, Browse, and Referral each convert at their usual rate, a lower blended CVR may come down to who arrived this month. Use the 30-minute diagnostic below to decide whether the listing needs an edit and whether you have enough traffic to test it.
Key insights
Run app store conversion rate optimization at the source level. Check these five things before you brief a redesign.
- Check the denominator. Apple uses unique device impressions. Google Play’s listing click-through rate (CTR) uses listing visitors.
- Compare each source with its own history. Check Search, Browse, and Referral by market before using the blended rate to make a decision.
- Use the right peers. Apple groups eligible apps by category, business model, and download volume.
- Budget time for the test. Apple allows up to three treatments and 90 days. It recommends waiting for at least 90% confidence.
- Keep traffic volume beside every rate. A growing share of lower-converting traffic can drag down the overall figure even when every source holds steady.
What app store conversion optimization actually measures
Put a conversion metric on the slide only once you can name the action and the audience counted. A completed download, a button click, and a product page visit tell you about different points in the acquisition funnel.
Apple’s formula uses total downloads and unique impressions
Apple’s metric definition reads “Total downloads and pre-orders divided by unique device impressions.” The denominator counts devices that viewed the app on eligible App Store surfaces, including the product page. Apple counts a pre-order when it’s placed and excludes the resulting download from a second count in this metric.
For an app without pre-orders, 50 downloads from 100 unique device impressions give a 50% app store conversion rate. Of those 50 downloads, suppose 30 came from people getting the app again. A second app with the same 100 impressions and 20 first-time downloads but zero redownloads would report 20%. Both apps acquired the same number of first-time downloaders.
“Before comparing conversion rates, check what each number counts. Downloads divided by impressions and downloads divided by page views answer different questions. Redownloads can also lift Apple’s reported rate without improving first-time acquisition. Put the numerator and denominator beside every percentage; otherwise, you risk treating a measurement difference as a reason to redesign your listing ”
— Yaroslav Rudnitskiy, Senior Professional Services Manager, AppFollow
Google Play measures a different step of the funnel
When a report says “Google Play conversion rate,” look up the field before carrying it into your dashboard. The Listing conversion analysis report uses CTR, the share of listing visitors who tap Install, Open, or Pre-register. The legacy conversion-rate series measured a different event, so mark the change when charting across the reporting transition.
For completed installs from the listing, pull Store listing acquisitions from Statistics or exports. Google counts a user who installed after visiting the listing and who had the app on none of their devices at the time. A user who installs on several devices counts once in this metric.
App Store | Google Play |
|---|---|
Total downloads and pre-orders ÷ unique device impressions. | Listing CTR: share of listing visitors who tap Install, Open, or Pre-register. |
Total downloads include first-time downloads and redownloads. | Completed store listing acquisitions are available separately in Statistics and exports. |
Table. App Store conversion and Google Play listing CTR count different actions. Sources linked above, checked November 16, 2026.
Keep each series under its own store and metric label. A team that wants both outcomes can report listing CTR and completed acquisitions side by side.
Separate exposure, page visits, and downloads
The working funnel runs from exposure to product page visit to download. People can also download directly from App Store search results. If you divide all downloads by page views, you’ll count some downloads from people who never opened the page. Use Apple’s Page Type dimension to see which surfaces contributed downloads before judging app product page conversion.

If fewer people reach the page per impression, inspect the discovery placement and who saw it. When page visits hold steady and downloads weaken, pull up the listing visitors actually saw. Check that any supposed page-level decline remains after you split out direct downloads and keep territory, device, and dates comparable. Put those filters in your ASO measurement notes.
What counts as a good conversion rate
A good conversion rate is competitive for the same store, metric, category, business model, and roughly the same download volume. Ten percent means little on its own. If you’re below the relevant peer median across several comparable periods, pull the source split before briefing a fix.
Use Apple’s peer groups before a published average
In App Store Connect, select the app and open Analytics → Benchmarks. Apple’s peer group benchmarks show the 25th, 50th, and 75th percentiles when enough data is available. Open View Trends to see where the gap started and record the peer settings shown in the table.
Attribute | What to check |
|---|---|
App Store category | The selected category matches your app’s category or relevant subcategory. |
Business model | Your app belongs with free, freemium, paid, paymium, or subscription peers. |
Download volume | The low, medium, or high band reflects comparable weekly downloads. |
Table. The three settings to record when comparing with Apple’s peer group.
Check the subscription classification closely. For the subscription group, Apple says a freemium or paymium app must earn “at least 50% of its revenue from auto-renewable subscriptions.” A download charge alone won’t tell you where an app with in-app purchases belongs.
Keep the peer settings and review window in the report. Apple uses differential privacy, so the percentiles give you an aggregate reference for the App Store.
Compare category and country without mixing definitions
A global average can hide a market problem. If Brazil slips while other storefronts hold, start with Brazil’s traffic mix and localized listing. Match the same market to its own recent history before comparing it with a category.
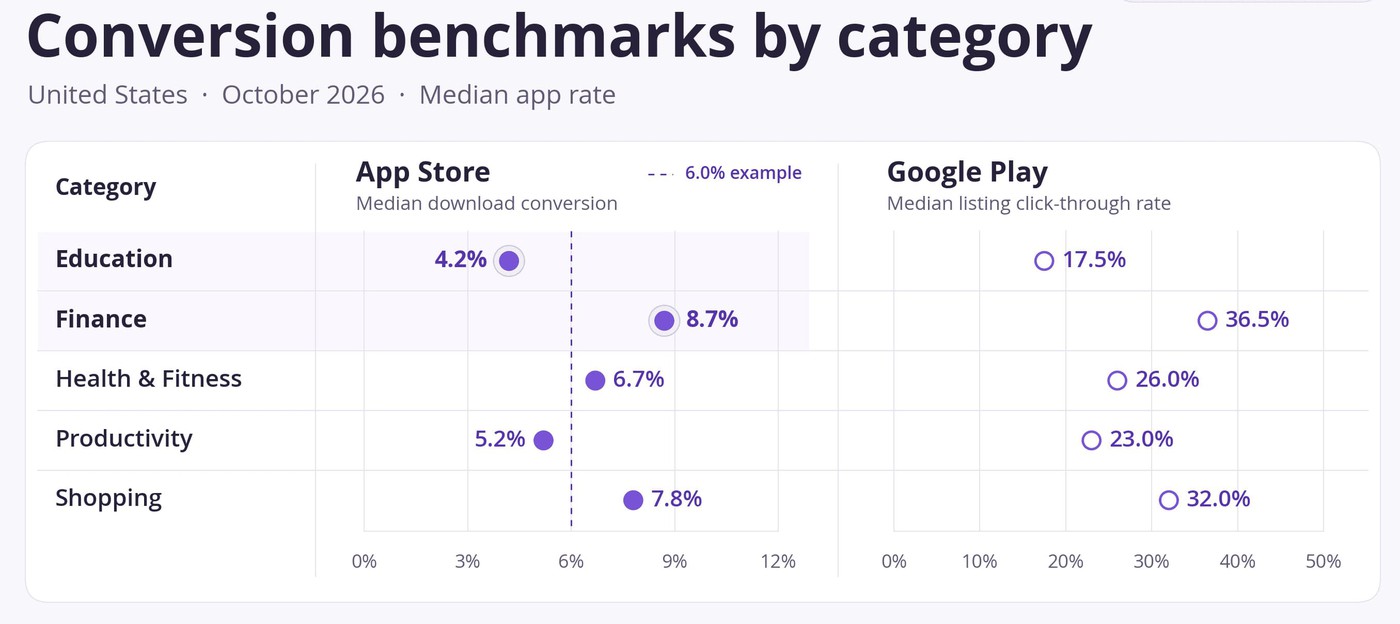
Use AppFollow’s free app store conversion rate benchmark to look up a category and country for either store. Record the period, the action counted, the denominator, and any published sample coverage. The benchmark documentation describes what the tool covers. Carry a benchmark into your performance review only when you can match it to your own measurement.
BANNER ABOUT BENCHMARKS
When a benchmark gap deserves a closer look
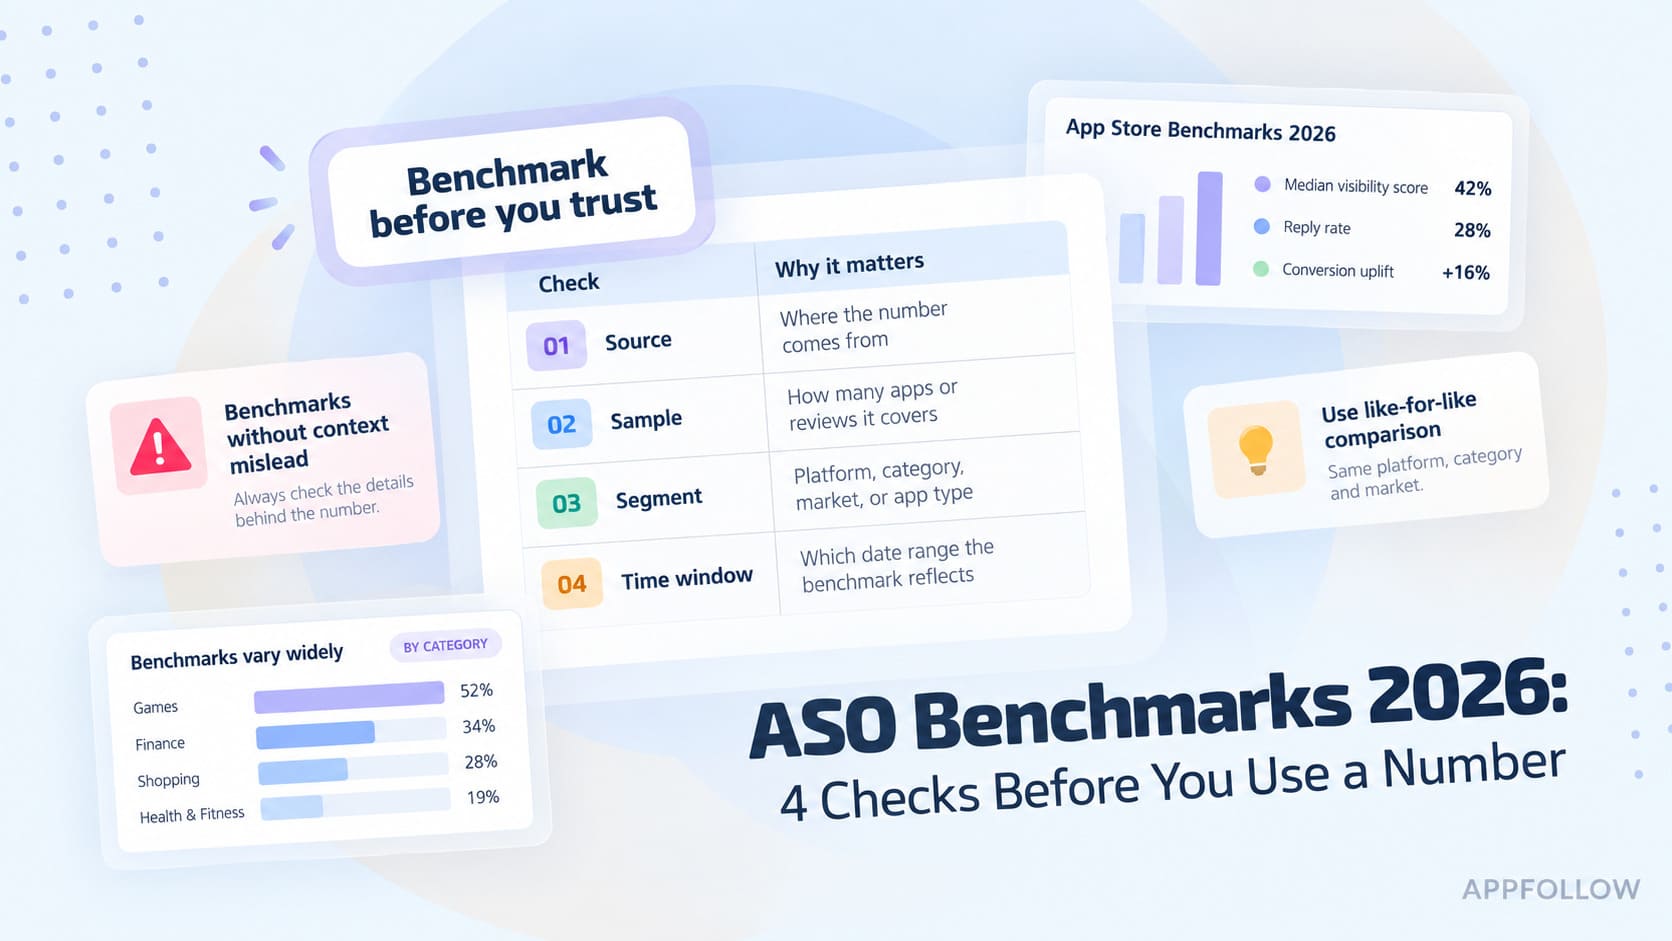
A few extra downloads can move the rate sharply for a small app. Put the download counts beside the rate for several comparable periods. If the gap holds, check whether the audience changed around the same time. Two apps in the same Apple peer group can draw very different proportions of Search and campaign traffic. The ASO benchmarks guide covers the other baselines worth keeping with that comparison.
“Choose the comparison group before deciding whether your conversion rate is good. Category, business model, and download volume all affect which peers belong in that group. Then check your country and traffic mix. A gap gives you a reason to investigate, but it cannot tell you which screenshot, message, or campaign needs changing.”
— Ilya Kataev, Professional Services Team Lead, AppFollow
In Play Console, you can also compare listing CTR against a peer median where enough data is available. Use that reference for listing clicks and keep acquisition outcomes in their own series.
Which of your three funnels is leaking
For app store conversion optimization, the question is which audience changed its behavior. Pull each source’s own trend before comparing Search, Browse, and Referral. A source can look weak against Search simply because it reaches people at a different point in their decision.
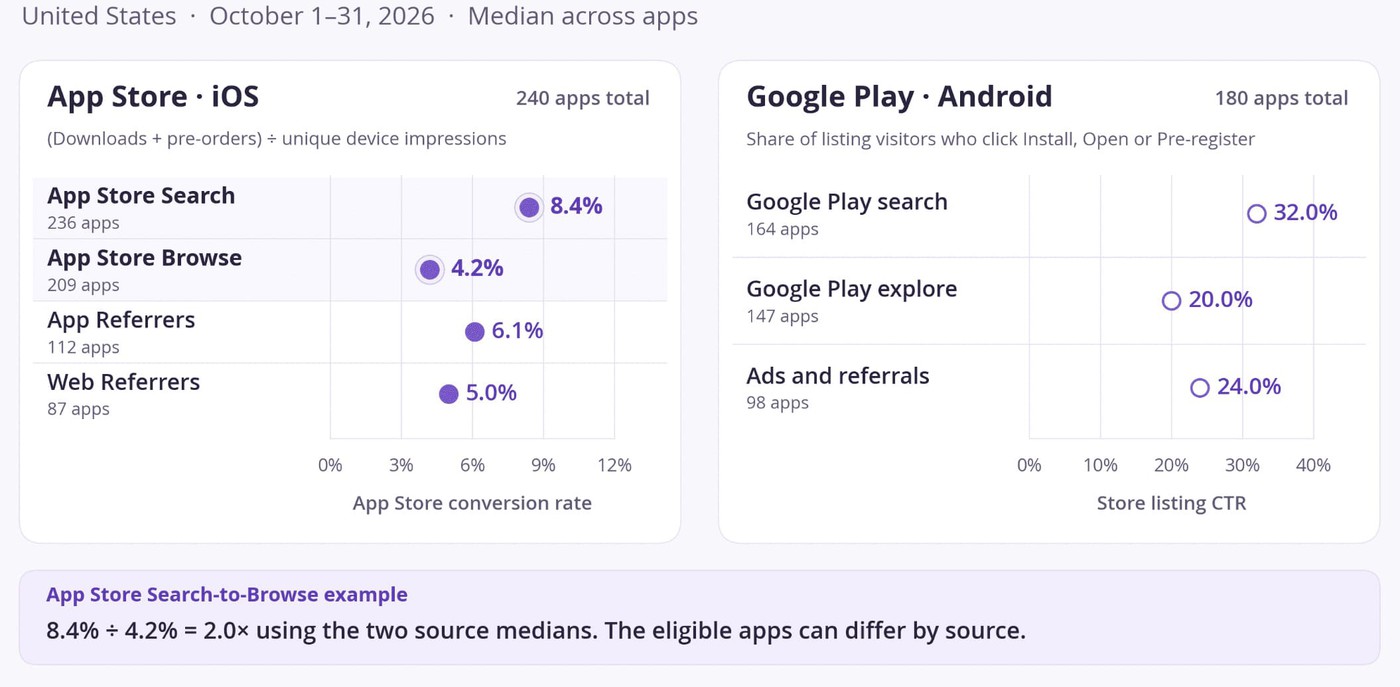
Apple’s Acquisition reports break out downloads by source, including “App Store Browse, App Store Search, App Referrers, Web Referrers, and more.” Use Source Type to inspect conversion. On Google Play, use the Play Console source labels shown in the report you exported.
Search traffic: check whether the listing answers the query
Someone searching for a mileage tracker should see mileage tracking in the title or opening screenshots. Start with a handful of terms you actually rank for. Use keyword rank tracking to spot changes, then inspect the storefront as a user would. Where the console exposes useful query data, separate branded demand from generic demand. A source-level conversion rate can’t tell you what any one keyword converted at.
Google Play labels brand and app-name queries as Google Play search in store listing reporting. Category queries can sit under Google Play explore. Check the source definition before applying an App Store Search finding to Android.
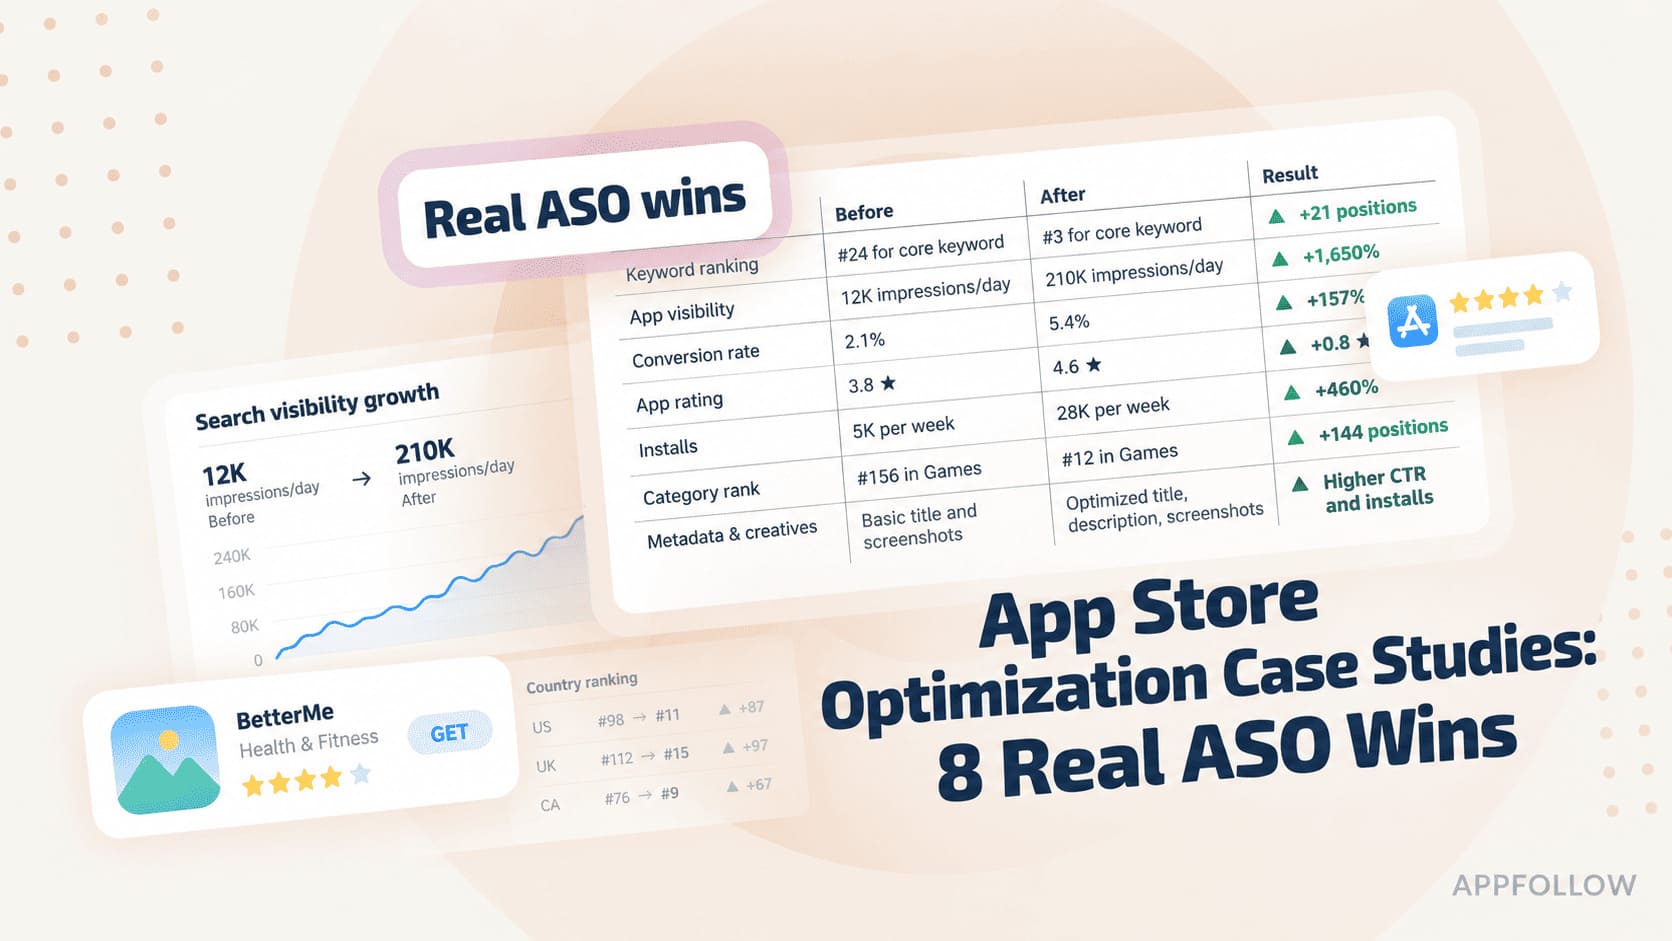
In AppFollow’s HyperHug case study, the team updated text metadata for Oxide: Survival Island in the US App Store after losing an important keyword. In the two weeks after the update, Search impressions rose 11%, Search downloads rose 34%, and Search conversion went from 6.08% to 7.34%, up 1.26 percentage points. The team reported no increase in paid spend and no creative refresh.
This was a before-and-after comparison. The three figures together show what changed in Search, while the simultaneous metadata edits limit what you can attribute to any one element.
cta_free_trial_purple
Browse traffic: check what changed around discovery
Pull the 90-day Browse trend and mark featuring dates or category-chart moves. A wider placement can deliver more downloads at a lower rate. If the drop clusters around a placement and recedes with it, review who saw the app before rewriting the listing.
When Browse falls in one market at comparable exposure, take a look on a device. Put the icon beside the apps around it and check what the opening image actually says at that size. If there’s a specific issue, use the screenshot guide to brief that asset.
Referral traffic: check whether the page keeps the promise
Start with whichever campaign or referring placement sent the most traffic. Put the ad, article, or in-app placement beside the destination. In Apple’s source breakdown, keep App Referrers and Web Referrers separate while you trace the route. Write down the promise the visitor saw and where the store page delivers it.
Then check targeting and destination history for the same dates. If the campaign changed to broader prospecting, split the audience before judging the new page. Where campaigns genuinely make different promises, Apple’s custom product pages and Google Play’s custom store listings give you a separate destination. For an in-app promotion, check whether the live destination still features what the campaign advertised and use In-App Events analytics to log event performance separately.
“When referral conversion drops, compare the campaign promise with the destination page, then check who the campaign reached. A clear mismatch gives you a page edit to investigate. If the message stayed consistent but targeting broadened, the audience may explain the decline. Keep those questions separate before asking design to rebuild a page that still fits its intended visitors.”
— Dzianis Shalkou, Senior Professional Services Manager, AppFollow
Run the 30-minute conversion diagnostic
Set aside 30 minutes once you have exports from both stores. A spreadsheet with a row per store, country, source, and period is enough.
- Pull 90 days of source-level data for each store. Keep the metric label, numerator, denominator, and download or acquisition count where available.
- Repeat the split for your three highest-volume countries. Retain an Other or unattributed row where the report provides one.
- Compare each source with its own previous period. Match the number and mix of weekdays and mark launches, featuring, and paid campaign changes.
- Read each source’s rate alongside its share of traffic. Use the store’s reported aggregate if users can appear in multiple segments.
- Prioritize persistent declines by estimated impact. Multiply the gap from the source’s baseline rate by its current denominator to estimate the actions missed at the old rate. Use the same metric on both sides of that calculation.
- Write one sentence with store, market, source, dates, what changed, and the first check you’ll assign.
Assign the first check using the Apple source names below. The cues are working hypotheses you can verify in your own account.
Traffic source | What you’re investigating | Relative level to expect | What a decline may indicate | First check |
|---|---|---|---|---|
App Store Search | Query-to-listing match | Depends on brand and query mix | Broader or mismatched demand | Check ranking terms and the first screen |
App Store Browse | Discovery appeal | May trail high-intent Search | Broader exposure or weaker appeal | Check featuring dates, icon, and first screenshot |
App Referrers | App-to-page continuity | Depends on referring audience | Targeting or message mismatch | Compare the in-app placement with its destination |
Web Referrers | Website-to-page continuity | Depends on referring audience | Changed visitor expectations | Compare the referring page with its destination |
Table. First checks and owners for each App Store traffic source.
Worked example · illustrative App Store data. Search brings in 700 downloads from 10,000 unique impressions, Browse 185 from 5,000, and Referral 135 from 5,000. That’s 1,020 downloads from 20,000 impressions, or 5.1%.
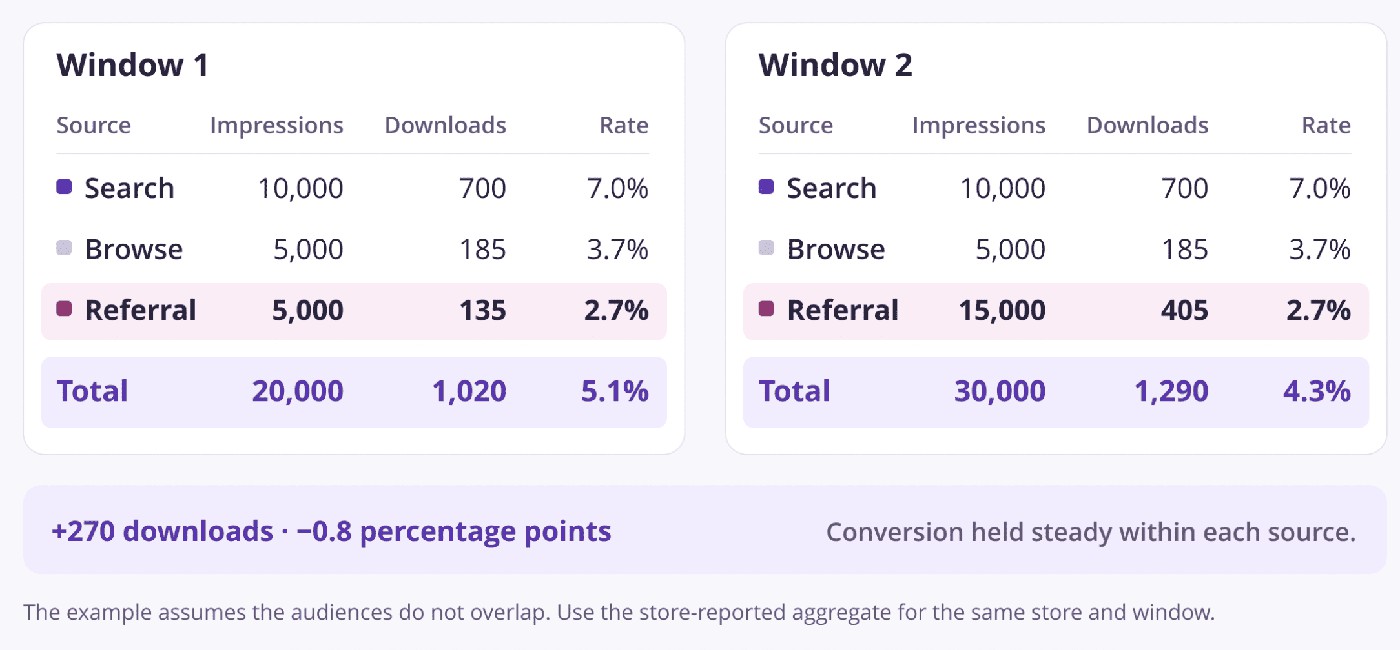
In the next window, Referral triples to 15,000 impressions and delivers 405 downloads at the same 2.7% rate. Search and Browse hold steady. The overall rate drops to 4.3% (1,290 ÷ 30,000), even as the app gains 270 downloads. The arithmetic assumes the example’s audiences don’t overlap. For real data, pull the reported aggregate for the same store and window.
The planning note could read “On the App Store in the US, Referral volume tripled between the two monthly windows while source-level rates held steady.” The next check belongs with the person who changed referral targeting or spend.
cta_free_trial_yellow
What to change when Search, Browse, or Referral slips
To improve app conversion rate, start with the smallest edit that addresses what you found. App store conversion rate optimization is easier to measure when the brief names the source, a single change, and the outcome to watch.
A full relaunch can still be one intervention. In that case, evaluate the package as a whole. Keep unrelated metadata edits outside the measurement window so you can interpret the result.
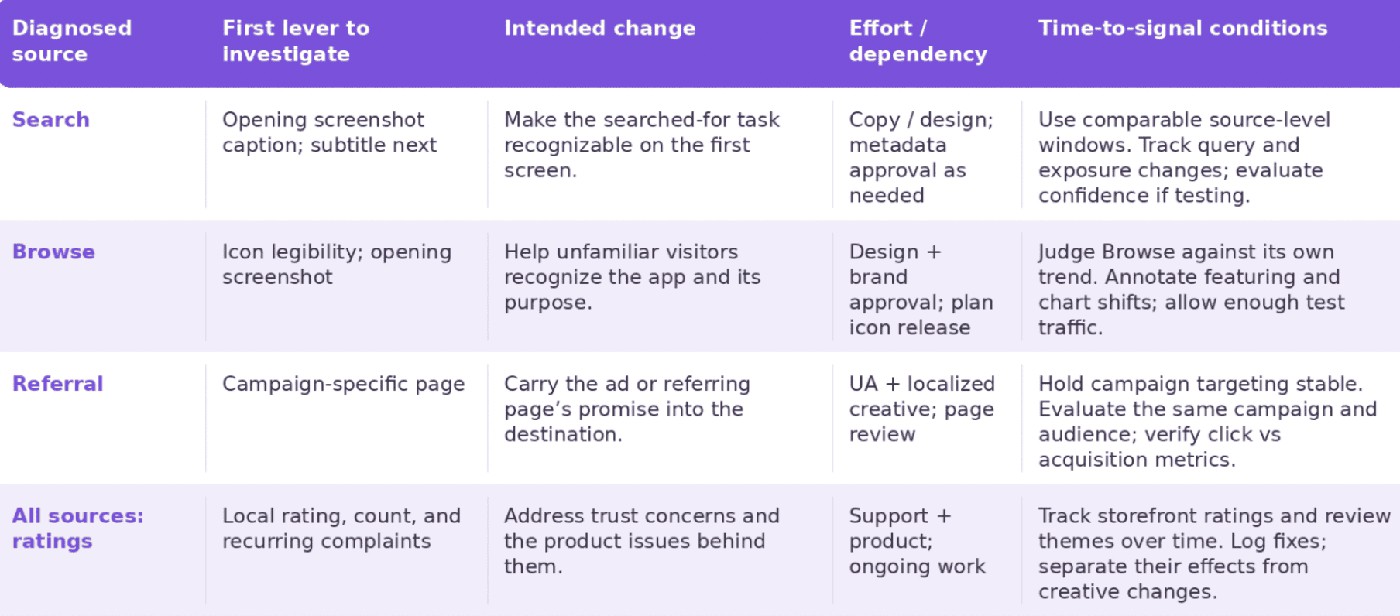
Write the hypothesis into the design ticket. If the first image misses the task people searched for, the brief should name that task and the storefront where it happens.
For Search, answer the query on the first screen
Open the storefront on the target device and audit five non-branded terms you rank for. For each one, point to the text or image that answers the query. Use this order when more than one asset could carry the message.
- First screenshot. Suppose a visitor searches for “split expenses with roommates”. The caption “Effortless financial clarity.” leaves them guessing. Try “Split rent and bills with roommates” if the app does both.
- Subtitle. On iOS, use the line beneath the app name to clarify a feature or use case. Apple’s subtitle guidance says you can update it when you submit a new version, so check the release calendar before assigning the edit.
- Second screenshot. Show how the task works. In the roommate example, use the screen where someone records a bill and sees each person’s share.
- App title. Revisit the name when smaller edits leave the core mismatch unresolved. It can change both recognition and discovery, so take a title and subtitle baseline first.
Localize the wording around actual storefront queries. If one country accounts for the decline, start there and compare Search with the preceding matched window. Record any gains or losses in ranking terms during that window so they don’t get mistaken for results of the caption edit.
For Browse, check the icon at storefront size
Put your app next to its category peers on a phone. Look away and glance back. Which shape do you recognize first? If your wordmark disappears or two elements merge, test a simpler icon. Apple’s icon guidance recommends designs that stay legible across sizes.
Before booking the test, get brand approval and check the release path. Apple requires alternate test icons in the app binary, and shipping an icon treatment means making it the default icon in the next version.
A recognizable icon earns you a closer look. The opening screenshot should make one useful promise, visible at the actual storefront size. Check the crop on the target device. Then watch the preview with the sound off. Apple says previews “autoplay with muted audio.” See whether the first three seconds show a task the visitor recognizes. If the opening is the problem, start with the app preview and promo video guide.
For Referral, carry the campaign promise onto the page
A targeted page is worth building when the campaign makes a distinct promise, sends enough traffic to read the result, and has an owner who can update the destination. Where the same promise already fits the default page, check the campaign and its audience first.
Apple supports “up to 70 additional versions” as custom product pages. Each has its own URL. Assign relevant keywords if the page should also appear for those App Store searches.
Play Console supports up to 50 custom store listings with options including country, search keywords, Google Ads, and audience segments. For country targeting, “you can only target a country with one custom Store Listing at a time.” Supply your own translations for custom listings.
Give the highest-volume campaign the first page. Match the language and offer in the first screenshot, own the link in the campaign brief, and set a review or retirement date. Compare the same campaign before and after under similar targeting. Use the store’s experiment tools when you need a controlled comparison.
cta_free_trial_purple
Ratings can influence conversion across every source
Check the affected storefront’s rating before changing creative. Apple’s summary rating is specific to each territory and appears in search results and on the product page. Look at the rating count alongside the average, then read reviews that challenge the page’s main promise. A run of recent reviews saying an advertised feature fails is a product issue worth investigating on its own.
Give each recurring issue an owner. Record release dates and rating changes on the same timeline as listing edits so you can see what else changed. The ratings improvement workflow and review management guide cover triage and follow-through.
“Start addressing rating concerns alongside the creative work. Check the affected storefront’s score, rating count, and recurring complaints, then assign the underlying issues to their owners. Record fixes and rating changes on the same timeline as your listing edits. That gives you a clearer basis for judging which changes may explain the conversion result.”
— Veronika Bocharova, Customer Success Manager, AppFollow
Carry the affected territory and the dates of any rating or product changes into the test plan.
How to run a store listing test you can interpret
Before you brief a variant, decide which audience it needs to reach, what result would justify shipping it, and how many eligible impressions you can realistically allocate. An attractive treatment is useless if the test will spend its whole run collecting too little data.
What you can test with Apple Product Page Optimization
Apple Product Page Optimization compares icons, screenshots, or app previews on your default product or pre-order page. App Store Connect allows “up to three treatments” per test and one active test at a time, with a 90-day maximum. You can select which supported localizations participate. Fewer eligible storefront visitors can make the result take longer.
Suppose you allocate 40% of traffic to two treatments. Each gets 20%, and the original gets 60%. At 500 eligible impressions a day, that’s about 100 per treatment and 300 for the original. Check whether each arm can collect enough data under Apple’s duration estimate before asking for two designs.
If Apple’s estimate exceeds 90 days, try fewer treatments or a larger allocation. Apple recommends waiting until a treatment performs better or worse than the baseline with “at least 90% confidence.” If a controlled test is still out of reach, make a reversible edit, match the weekdays and audience in the before-and-after windows, and log other changes. Report the result as observational. See the guide to A/B testing store assets for games for more on planning the comparison.
Apple’s custom product pages serve different audiences. If two pages get different keywords or campaigns, their conversion rates describe two different traffic mixes. Use Product Page Optimization when the question is how two versions perform against the same baseline under random assignment.
How Google Play store listing experiments work
Store listing conversion optimization on Google Play can mean matching a page to a campaign or testing one asset. A custom store listing handles audience targeting. Store listing experiments in Play Console test variants on a default or custom listing for a published app.
A default graphics experiment tests icons, feature graphics, and screenshots. Localized experiments can also test descriptions. Google allows one default graphics experiment or up to five localized experiments at a time. You can test up to two variants against the current listing. The audience share you allocate to the experiment is divided evenly across the variants.
For a Google Play conversion rate test, record the target metric as labeled in the setup screen. Google lists unique user install, open, and pre-registration clicks as choices. The dashboard’s listing CTR and the completed acquisition series serve separate reporting purposes. In the experiment settings, note your chosen confidence level and minimum detectable effect before launch.
Use the estimate in Play Console to plan the run. Google’s testing guidance recommends “at least a week” to cover weekdays and weekends. Play Console stops experiments automatically after six months. Use a review date based on your traffic and the console’s estimate.
When the test has enough evidence to call a winner
A result that looks dramatic in week one can still be inconclusive. If Apple shows an uplift at 70% confidence, it falls short of the recommendation to wait for “at least 90% confidence”. Record the baseline, allocation, audience, target metric and decision rule before you start.
Check | App Store | Google Play |
|---|---|---|
Variants and allocation | Up to 3 treatments. Split the allocated share equally across them. | Up to 2 variants. Split the allocated share equally across them. |
Evidence and duration | Wait for Apple’s recommended 90% confidence. The test can run up to 90 days. | Set confidence and minimum detectable effect. Google recommends at least a week. Tests stop after 6 months. |
Audience | Default product page. Select participating localizations. | Default or custom listing. Record the listing, language, target metric and audience. |
Table. App Store Connect and Play Console test settings. See Apple Product Page Optimization and Play Console Help, both checked November 16, 2026.
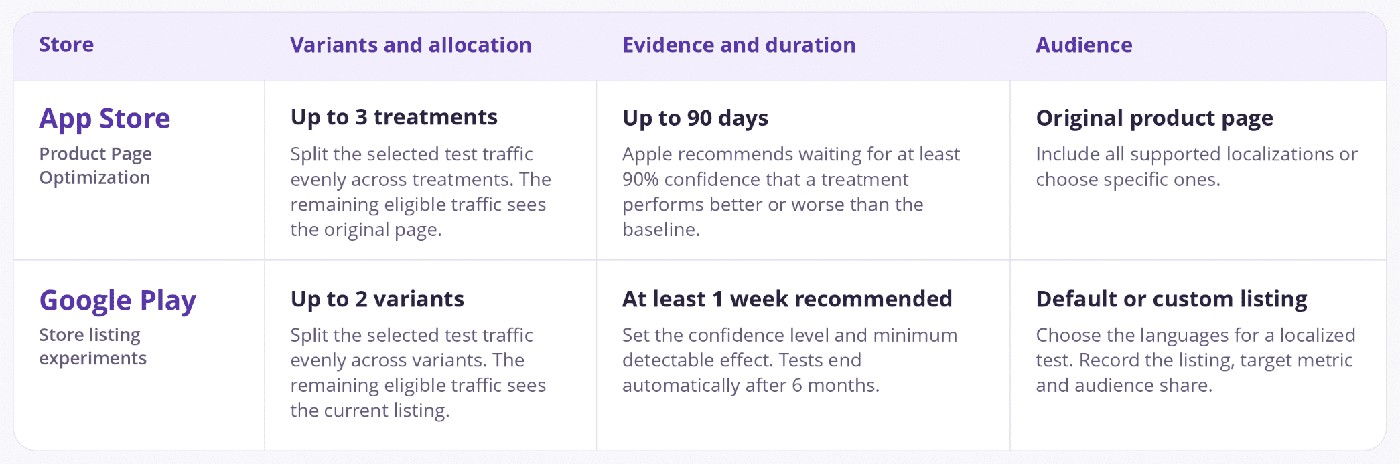
If Play Console reports More data needed or Apple is still collecting data at your deadline, record the result as inconclusive. Note whether you shipped anyway and who made that call. A persuasive screenshot uplift in a holiday campaign can warrant another test under everyday traffic before you roll it out to other markets.
“Decide what evidence will justify stopping before the test starts. A large early uplift can be tempting, but the confidence level still matters. If the test reaches its deadline without a clear result, record it as inconclusive. You can still make a business decision to ship; just keep that decision separate from a proven win.”
— Lucija Knezic, Senior CSM & Product Strategy Manager, AppFollow
Save the exposure counts, measured outcome, estimated lift, confidence, dates, and decision in the same test record. That’s what a reviewer needs to reproduce the call.
Three reporting mistakes that send teams after the wrong fix
Use these checks before putting a conversion change in a leadership deck.
- Reporting one conversion percentage for both stores. A slide labeled “app conversion rate” needs store names and measured actions beside the numbers. Put Apple downloads and pre-orders per unique device impression on one line and Play listing clicks per visitor on another, with the traffic source and market. If leadership needs a combined acquisition count, define the same event across stores and spell out any differences in how each one counts it.
- Calling an unfinished test. A release deadline is a reason to make a launch decision. If you ship while the console is still collecting data, record that you shipped with an inconclusive result. Keep uplift, confidence, and the sample alongside the date so the next team can see why.
- Giving creative credit for a traffic shift. Pull up the source rates before celebrating the blended number. A rise in branded Search or a fall in broad paid traffic can raise the aggregate without lifting any source’s rate. In the monthly deck, pair the blended trend with each source’s rate, exposure count, and download outcome. Mark the date of the campaign or placement change so it’s visible when you review the listing edit.
“Before calling a conversion change a win or a loss, check the metric definition, source-level rates, and traffic volumes together. A campaign can move the blended percentage without changing how any source converts. Put that context beside the result in your report, so the team knows whether it is evaluating listing performance or an audience shift.”
— Karen Taborda, Customer Growth Team Lead, AppFollow
Start the next review from that same record so a change in reports or filters can’t pass for a change in the listing.
cta_free_trial_yellow
How to run one monthly conversion review across both stores
A monthly conversion review should leave you with one decision someone can act on. Start with the store and country that moved. When the two consoles use different labels, bring the definitions along with the numbers.
In AppFollow’s Channel Analytics, connect an ASO Report for the app. Select a country and date range, then read the channel breakdown by day alongside traffic and downloads. Look for the date the source diverged. If its download count rose while conversion stayed stable, check how much traffic it added before assigning design work.
Use AppFollow’s ASO tools to keep the recurring investigation in the same workspace.
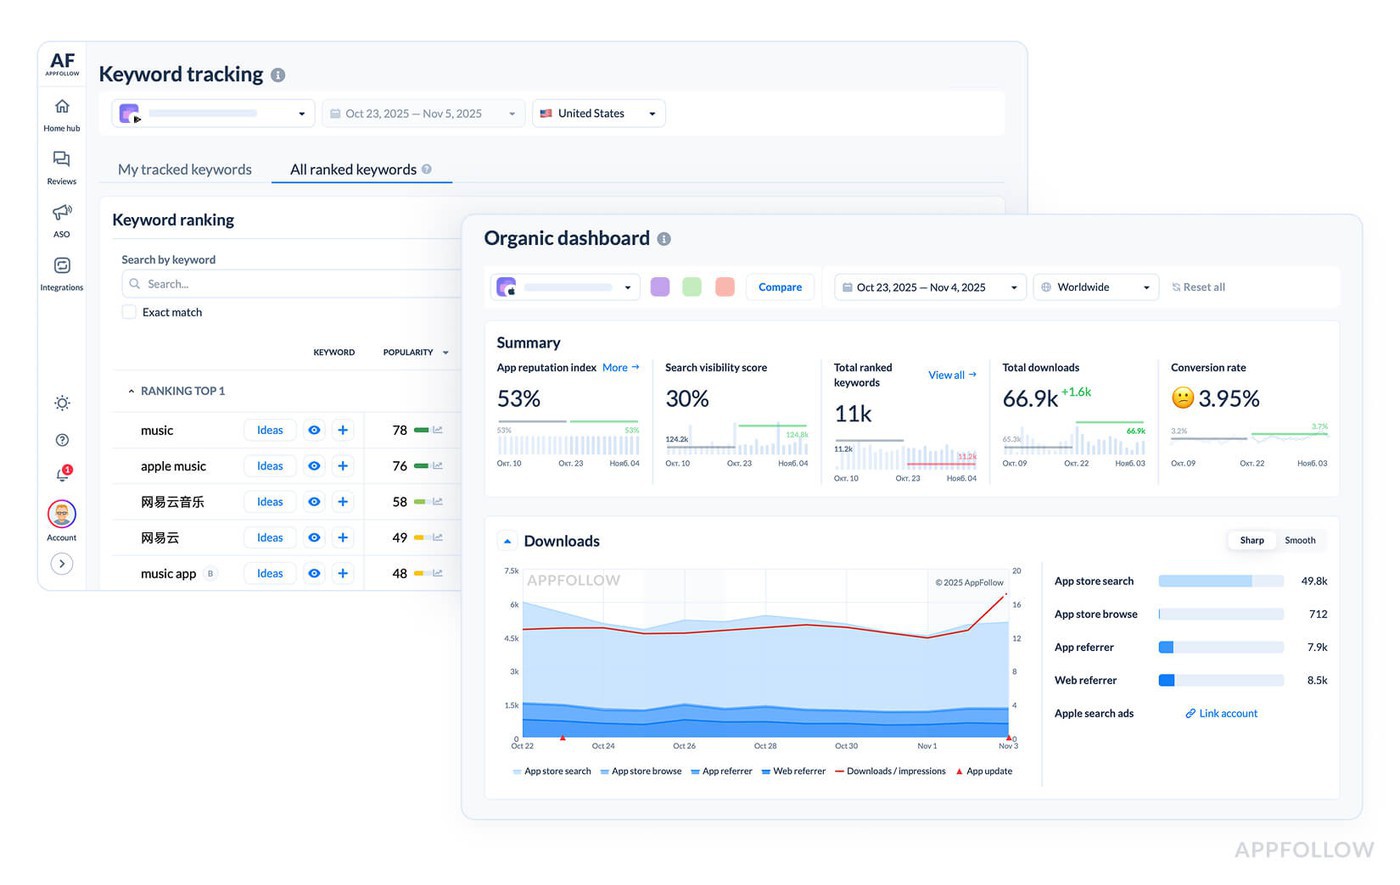
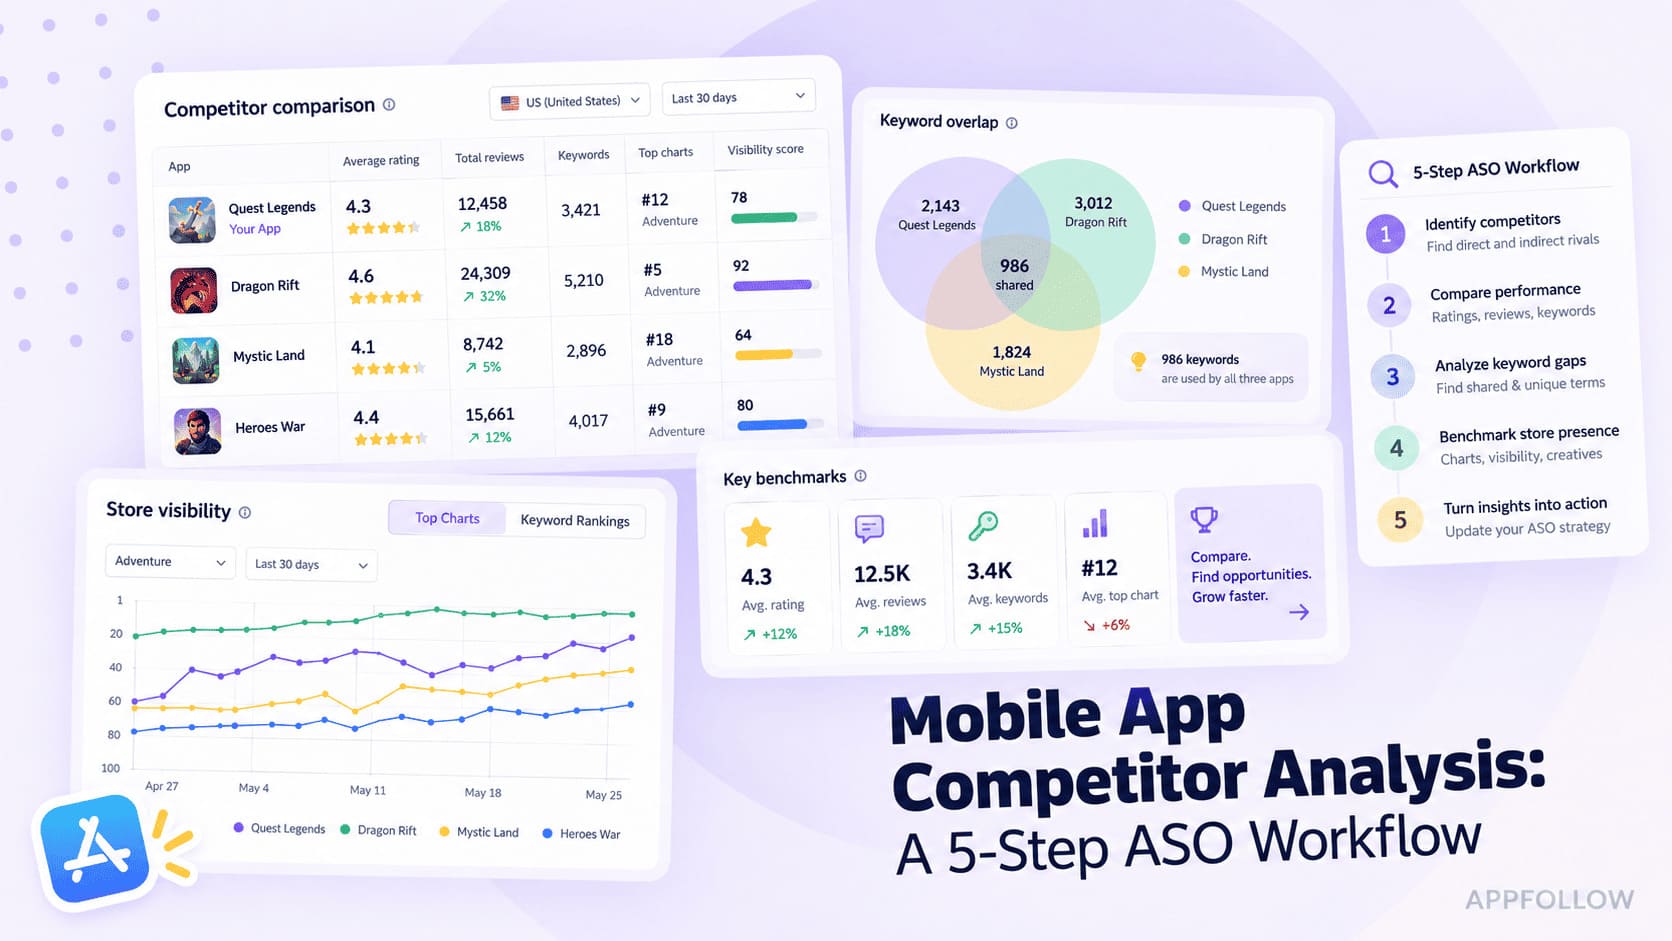
For a Search investigation, use keyword rank tracking to find terms and competitor positions that changed. Rank movement tells you which queries to inspect. Competitors’ conversion rates remain private.
Use App Store Connect for Apple’s peer comparison and the store consoles for experiments. Recent store data can be revised. AppFollow documents first-time downloads for iOS, so confirm the numerator in your view before comparing an AppFollow rate with Apple’s total-download metric.
cta_free_trial_yellow
FAQs
Store measurement and testing rules checked against Apple and Google documentation on November 16, 2026.
What is app store conversion optimization?
App store conversion optimization is the work of improving how often store exposure or a listing visit leads to the action you want to measure. Start with the store’s metric definition, then compare Search, Browse, and Referral with their own baselines. If one source slips, inspect what its audience saw before you change an asset or run a test.
Is 10% a good conversion rate on the App Store?
Ten percent can be a good result if it holds up against peers measured the same way. Apple’s impression-based metric includes redownloads and uses unique device impressions. A figure based on product page visits represents a different audience. Check your category, business model, and download volume in App Store Connect, then compare the rate with your own recent history in that market.
How does Apple calculate conversion in App Store Connect?
Apple defines it as “Total downloads and pre-orders divided by unique device impressions”. Total downloads include first-time downloads and redownloads. For an app without pre-orders, 50 downloads from 100 unique device impressions produce 50% conversion. If you offer pre-orders, Apple counts each one when it’s placed and excludes the resulting download from a second count in this rate.
How long should an app store conversion test run?
Apple’s Product Page Optimization tests can run for up to 90 days. Apple recommends waiting until a treatment performs better or worse than the baseline with at least 90% confidence. Estimate the run before launch using eligible impressions, the number of treatments, and the improvement you want to detect. If traffic is too low, compare matched periods and treat the result as directional.
Why did my conversion rate drop when my installs went up?
Downloads can rise while the rate falls when the audience grows faster than downloads. A campaign, featuring placement, or wider keyword exposure can send more traffic from a source that already converted at a lower rate. Compare each source’s rate and exposure count with its previous period. If the source rates hold steady, check what changed in how traffic was distributed.
Can you compare App Store and Google Play conversion rates?
Compare each store against its own baseline. Apple counts downloads and pre-orders per unique device impression. Google Play’s current listing CTR counts button clicks per listing visitor, while completed acquisitions are reported separately. In a cross-store report, put the measured action and denominator beside every percentage so a reader can tell whether it represents interest or a completed outcome.