App Store Optimization Metrics: The Complete 2026 Guide to ASO Tracking

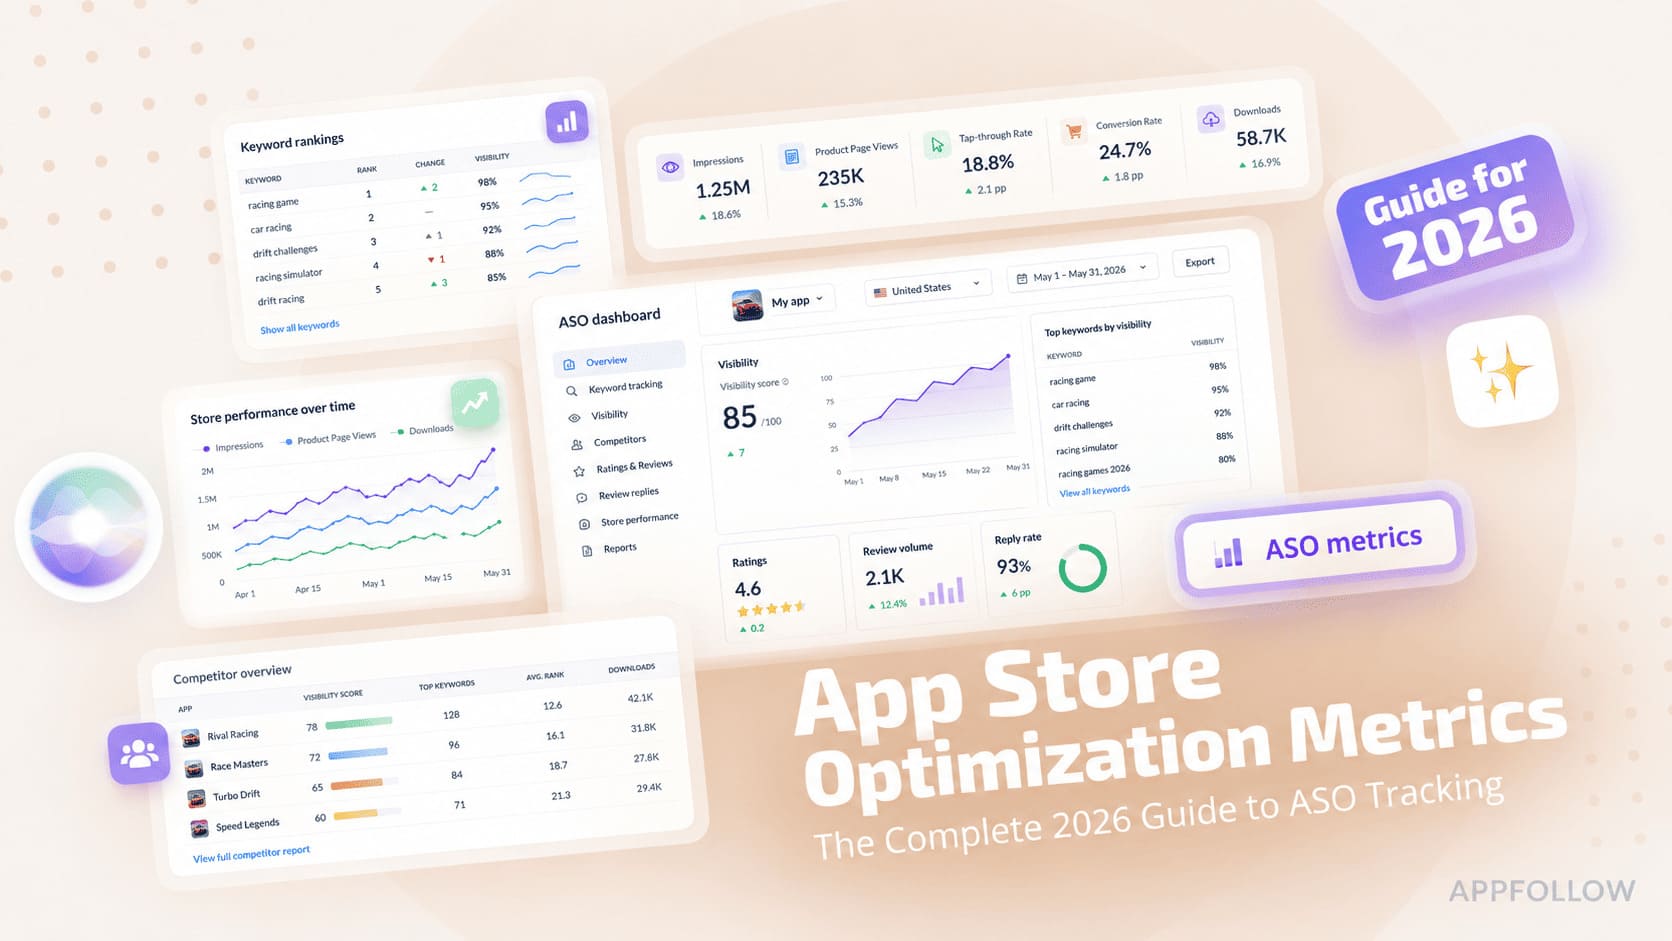
Table of Content:
- Key insights: app store optimization statistics and benchmarks for 2026
- What are app store optimization metrics?
- The 5 categories of app store optimization metrics every app team must track
- How to build an ASO tracking workflow that actually informs decisions
- Top 3 ASO tracking mistakes
- How AppFollow makes ASO tracking and metric extraction effortless
App store optimization metrics decide whether your ASO program drives growth or simply generates more dashboards to monitor. I see teams spend hours on ASO tracking, then struggle to explain which numbers actually influence organic installs in the App Store or Google Play.
The problem is rarely a lack of data. Most app marketers already have visibility reports, conversion metrics, ratings, reviews, keyword rankings, and experiment results. What they often lack is a way to separate useful signals from interesting distractions.
A keyword moving up three positions can look like progress until install velocity stays flat. A higher conversion rate can hide a visibility problem. Context matters more than any single KPI.
In this guide, you'll learn
- how to organize the metrics that matter,
- where to find reliable data,
- what realistic benchmarks look like,
- and how experienced ASO teams connect measurement to mobile growth.
You'll also see insights drawn from AppFollow's work with more than 80,000 apps across categories and markets.
The framework follows five metric groups: visibility, conversion, growth, feedback, and monetization.
Key insights: app store optimization statistics and benchmarks for 2026
The biggest shift in ASO isn't the amount of data available. It's knowing which metrics consistently predict growth.
- Nearly 65% of App Store downloads happen after a search, reinforcing why keyword visibility remains the foundation of ASO. (Source: Apple Ads)
- More than 70% of App Store visitors use search to discover apps, making search one of the most important acquisition channels in the mobile app industry. (Source: Apple Ads)
- Search accounted for approximately 59% of App Store downloads worldwide, according to Sensor Tower's download source analysis. (Source: Sensor Tower)
- Apple's own guidance states that search traffic accounts for the majority of App Store downloads, highlighting the importance of ranking performance. (Source: Apple Developer)
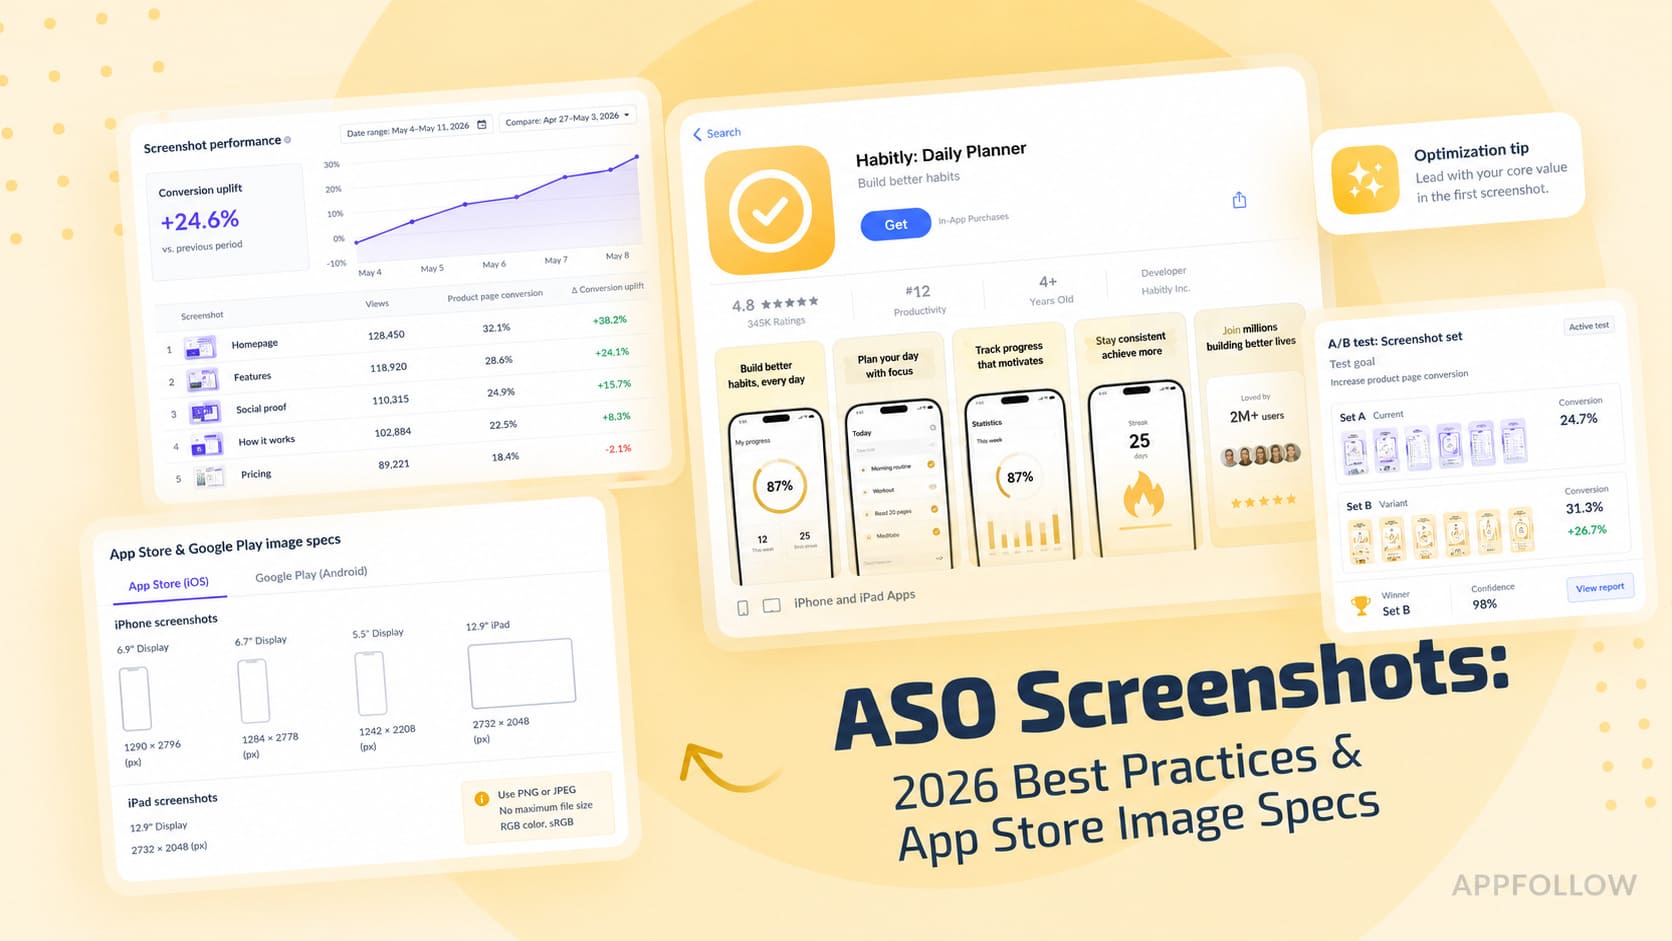
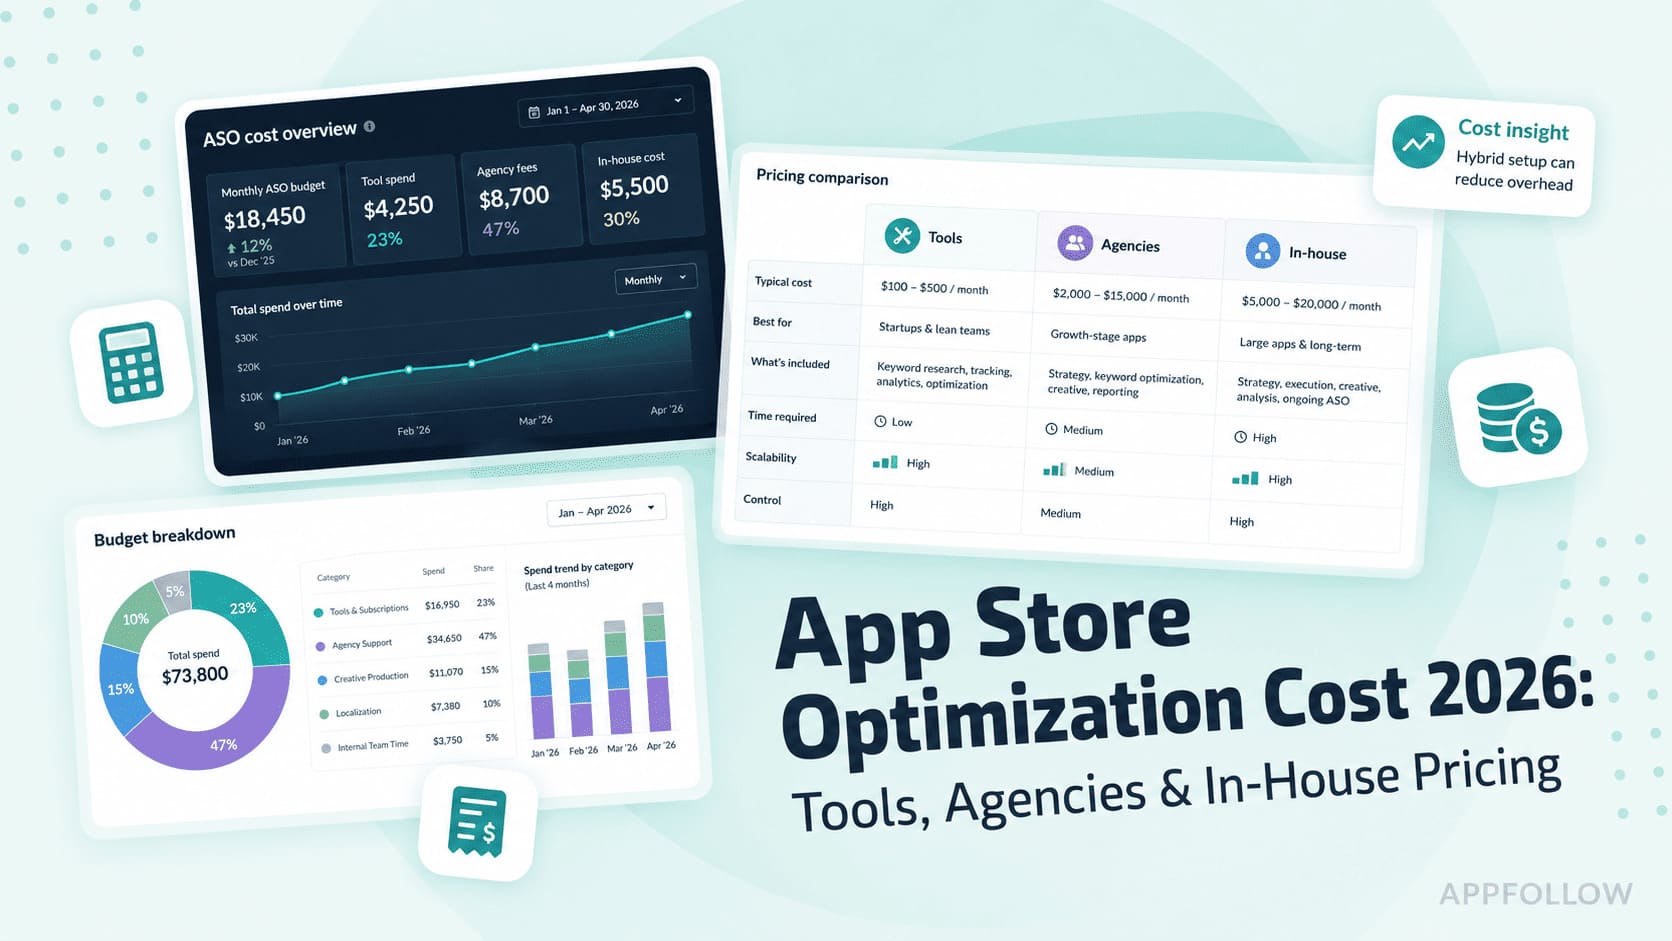
- Developers using Custom Product Pages see an average 2.5 percentage point conversion increase, equivalent to a 156% lift versus default product pages. (Source: Apple Developer)
- Industry studies report that targeted Custom Product Pages can improve conversion rates by 20–35% compared with standard listings. (Source: SplitMetrics)
- Apps featured on the App Store can experience download increases of up to 800% week-over-week, demonstrating the value of featured placements as a visibility metric. (Source: Sensor Tower)
- Branded search traffic consistently delivers stronger conversion rate benchmarks than generic traffic because user intent is significantly higher. (Observed across Apple Ads and ASO industry benchmarks.)
"Most teams we onboard track dozens of metrics and actively use only a handful. The goal is to identify the numbers that reliably predict future installs, conversion, retention, and revenue, not just to collect more data. That's why a structured ASO metrics framework matters. It helps teams focus attention where decisions actually happen."
— Ilia Kukharev, Product Manager at AppFollow
What are app store optimization metrics?
App store optimization metrics are the quantitative indicators app teams use to measure how well their App Store and Google Play listings drive visibility, conversion, and retention.
An app marketer can pull dozens of numbers from App Store Connect, Google Play Console, attribution platforms, and third-party ASO tools. Not all of them deserve equal attention. The purpose of app store optimization metrics is to help you understand whether your optimization efforts contribute to mobile growth, stronger visibility, and more organic installs.
In practice, the most useful metrics help answer a simple question: Is your ASO strategy moving the business forward?
Before diving into specific metrics, it helps to separate measurements from goals.
ASO metrics vs. ASO KPIs
ASO metrics include everything you can measure. ASO KPIs are the subset tied directly to a business objective. Every KPI is a metric, but not every metric qualifies as a key performance indicator.
ASO Metrics | ASO KPIs |
Keyword rankings | Organic installs |
Search Visibility Score | Conversion rate |
Ratings volume | Revenue per install |
Screenshot CTR | Retention rate |
Review volume | Cost per acquisition reduction |
Why metric-driven ASO matters in 2026
ASO in 2026 is not “add keywords, refresh screenshots, hope rankings move.”
That version is too slow now.
App stores evaluate the full listing-to-install experience: keyword relevance, tap-through behavior, conversion rate, install velocity, ratings, review sentiment, technical quality, retention signals, and how your app performs against competitors in the same category.
And the market is too big to manage that by instinct. Mobile users spent 4.2 trillion hours in apps in 2024, while consumer spend reached $150 billion for the first time, according to Sensor Tower’s 2025 State of Mobile report.
That means every ranking drop, weak screenshot set, rating dip, or broken keyword cluster can quietly affect a serious growth channel.
The short version
What app stores see | What ASO teams need to track |
Search relevance | Keyword rankings, keyword difficulty, search visibility |
User choice | Impressions, product page views, tap-through rate, conversion rate |
App quality | Crashes, ANRs, Android Vitals, ratings, reviews |
Market movement | Competitor rankings, category shifts, metadata updates |
Long-term value | Retention, uninstall signals, revenue, paid vs organic impact |
1. Search is still one of the highest-intent discovery channels
People searching in the App Store or Google Play are not passively scrolling. They are already expressing demand.
Apple Ads reports that ads at the top of App Store search results deliver an average conversion rate of over 60% across available Apple Ads countries and regions, measured from November 2024 to October 2025.
That does not mean every organic listing converts at 60%. It means search traffic is valuable because intent is already there. If your app ranks for the wrong keywords, loses positions in a core market, or gets impressions but no installs, you are not just losing visibility. You are losing high-intent demand.
Track:
- keyword rankings by country
- search visibility score
- keyword difficulty
- keyword popularity
- installs by keyword where available
- competitor ranking movement
2. Conversion rate turns visibility into actual growth
A listing can win impressions and still fail if the icon, screenshots, video, ratings, or first-line messaging do not convert. Apple defines conversion rate as the ratio of total downloads to unique impressions, and recommends tracking it over time by source type to understand how product page changes affect performance.
Apple also points developers to product page optimization, custom product pages, and localization when conversion underperforms.
For app teams, this is where ASO becomes measurable instead of subjective.
Bad ASO question: “Do we like these screenshots?” Better ASO question: “Did this screenshot set improve conversion in Germany for search traffic after the metadata update?”
Track:
- impressions
- product page views
- conversion rate
- conversion lift
- source type
- country / locale performance
- creative test confidence
3. Quality metrics can affect store visibility, not just UX
Technical quality is no longer only a product team problem.
Google’s Android Vitals documentation says core vitals affect app visibility on Google Play. The current bad behavior thresholds include 1.09% user-perceived crash rate, 0.47% user-perceived ANR rate, and 8% per-phone-model thresholds for both crashes and ANRs. Source URL: developer.android.com
So when an ASO dashboard ignores crashes, ANRs, rating drops, and review spikes, the team is missing part of the ranking story.
A metadata update might look “bad” because rankings dropped. But the real cause could be a buggy release, a device-specific crash issue, or a wave of 1-star reviews after a broken feature launch.
Track:
- crash rate
- ANR rate
- rating trend
- review volume
- review sentiment
- reviews by app version
- country-level rating changes
4. AI makes structured ASO measurement more important
AI is changing how store search systems interpret relevance.
A 2026 paper on App Store search ranking describes how ranking systems can combine behavioral relevance — what users click or download — with textual relevance — how well an app semantically matches a query.
Adding LLM-generated textual relevance labels to an App Store ranker produced a statistically significant +0.24% conversion rate increase in a worldwide A/B test, with stronger gains on tail queries.
For developers and publishers, the takeaway is practical: your listing needs to be measurable across both sides of discovery.
You need to know:
- which keywords bring visibility
- which queries match your positioning
- which metadata changes affect rankings
- which creatives affect conversion
- which reviews expose intent, objections, bugs, and feature demand
AI does not remove the need for ASO metrics. It raises the bar for clean, structured, constantly updated signals.
5. Competitors can change your ASO performance overnight
Your app can lose visibility even when your own listing stays the same.
A competitor may update metadata. A new app may enter the category. A seasonal keyword may spike. A market leader may refresh screenshots. Google Play or the App Store may reshuffle rankings after engagement or quality signals change.
Without metric tracking, teams usually notice too late, when installs have already dropped.
Track:
- category rankings
- competitor keyword rankings
- competitor metadata changes
- competitor ratings and review velocity
- featured placements
- app update timeline
- top chart movement
The 5 categories of app store optimization metrics every app team must track
Most ASO programs fail for a simple reason: teams monitor dozens of numbers without organizing them into a decision-making framework. The most useful app store optimization metrics answer five different questions:
- Can users find your app?
- Do they install it?
- Does growth continue after acquisition?
- What are users telling you?
- Does that traffic generate revenue?
I like grouping metrics into visibility, conversion, growth, feedback, and monetization because each category points to a different optimization action.
Visibility metrics
Visibility metrics measure how often users encounter your app before making a decision. On their own, they don't tell you whether users install. They tell you whether users can find you in the first place.
| Metric | What it reveals | What to watch |
|---|---|---|
Keyword rankings | How visible your app is for target search terms | Sudden ranking drops, volatility, competitor gains |
Impressions | How often users see your app in search, browse, top charts, or featured placements | Growing visibility without install growth |
Top charts position | Relative performance against other apps in your category | Consistent downward movement |
Category rankings | Competitive standing within a specific category | Rank changes after updates or seasonal events |
Share of Voice (SOV) | The percentage of search visibility owned compared to competitors | Losing visibility on high-value keywords |
Keyword popularity | Estimated search demand for a keyword | High-popularity keywords with low rankings |
Taken together, these metrics answer a single question: can potential users discover your app before they discover a competitor?
cta_get_started_purple
Conversion metrics
Visibility creates opportunity. Conversion determines whether that opportunity becomes an install. When conversion metrics move, they're usually pointing to a problem with creative assets, messaging, audience targeting, or product-market fit.
Metric | What it reveals | What to watch |
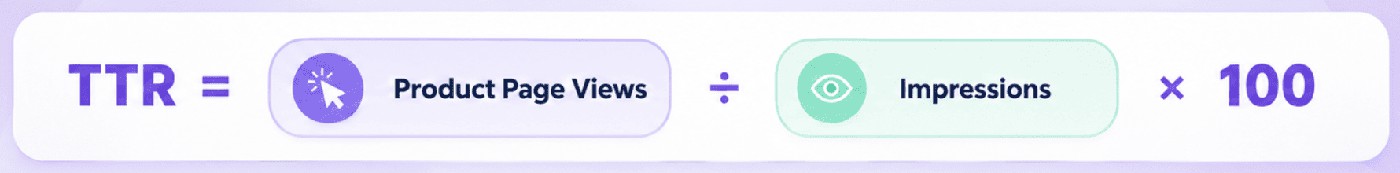
Tap-through Rate (TTR) | How often users visit your product page after seeing your listing | High impressions but low product page views |
Conversion Rate | How effectively store visitors become installers | Product page traffic growing while installs remain flat |
Product Page Conversion Rate | How well the product page itself persuades users to install | Large gaps between page views and downloads |
Impression-to-Install Rate | Overall efficiency of the acquisition funnel from visibility to install | Falling install efficiency despite stable rankings |
App Units | First-time downloads attributed to your listing on iOS | Growth slowing despite stable conversion metrics |
Apple provides impression-level data through App Store Connect. Google Play does not expose impressions in the same way, so analysis typically starts further down the funnel.

Many ASO teams also track Product Page Conversion Rate, calculated as:

The distinction matters. A weak result can come from poor listing engagement before the product page or from a product page that fails to convert interested visitors.
Together, these metrics answer an important question: when users discover your app, what prevents them from installing it?
Growth metrics
Growth metrics show whether ASO improvements are creating sustainable business impact or simply generating temporary ranking spikes. Visibility and conversion explain what happened in the store. Growth metrics reveal whether those gains translate into long-term user acquisition and engagement.
Metric | What it reveals | What to watch |
Install Velocity | The rate at which new installs accumulate over time | Sudden slowdowns or unusually rapid growth |
Organic Installs | Users acquired without paid promotion | Organic growth flattening while paid growth increases |
Organic Uplift | How paid acquisition contributes to organic growth through increased visibility and ranking signals | Paid campaigns generating installs without corresponding organic growth |
DAU/MAU Ratio | How frequently users return after installing the app | Declining engagement despite install growth |
MAU Growth | Long-term audience expansion | Install growth outpacing active-user growth |
One distinction matters here. Downloads and installs are not identical. A download records a store action. An install reflects a successful installation on a device. Teams that rely exclusively on download counts often overestimate actual user acquisition and miss problems further down the funnel.
Taken together, these metrics answer a critical question: are your ASO improvements generating lasting mobile growth, or are they producing short-term visibility gains that quickly fade?
User feedback metrics
User feedback metrics translate customer experience into ranking and conversion signals. They help you understand not only what users think about your app, but also how those perceptions influence visibility, installs, and retention.
Metric | What it reveals | What to watch |
Rating Score | Overall user satisfaction and trust in your app | Declines after releases, feature launches, or pricing changes |
Review Volume | How actively users are sharing feedback | Sudden spikes in positive or negative reviews |
Ratings-to-Reviews Ratio | The relationship between passive ratings and written feedback | Unusually low review participation |
Review Recency | How current user feedback appears to prospective installers | Large numbers of outdated reviews or declining recent activity |
Review Sentiment Analysis | The themes, complaints, and feature requests users mention most often | Recurring negative topics across multiple releases |
Reply Rate | How consistently your team responds to user feedback | Slow response times or low response coverage |
Teams using AppFollow's reviews and ratings dashboard typically reply to 60–80% of reviews, which both Apple and Google reward through stronger trust and engagement signals.
"There's a metric most teams underweight: review recency. Reviews from the last 30 days carry the most practical weight because they're what prospective users see first. Across customer accounts, we've watched ratings improve significantly when teams respond consistently, close feedback loops, and ship visible fixes. Conversion often follows within a release cycle because users gain confidence that the product is actively maintained."
– Veronika Bocharova, Customer Success Manager
Together, these metrics answer an important question: how do users experience your app today, and how is that experience influencing future installs?
Monetization metrics
ASO succeeds when it attracts users who create long-term value. Downloads may signal growth, but monetization metrics reveal whether that growth contributes to the business. The strongest ASO programs focus on acquiring users who stay engaged, convert, and generate revenue over time.
Metric | What it reveals | What to watch |
Revenue | The total income generated by acquired users | Revenue growth lagging behind install growth |
ARPU (Average Revenue Per User) | How much revenue each user generates on average | Falling ARPU despite growing user numbers |
LTV (Lifetime Value) | The total value a user generates throughout their relationship with the app | Acquisition costs approaching or exceeding LTV |
In-App Purchases (IAPs) | How effectively users convert into paying customers | High install volume with low purchase activity |
Subscription Conversion Rate | The percentage of users who start a paid subscription | Declining trial-to-paid conversion |
Retention and Churn | Whether acquired users continue using the app or leave | Rising churn after acquisition spikes |
This is where ASO becomes more than an acquisition channel. High-intent organic traffic often produces stronger retention and higher lifetime value because users actively searched for a solution rather than discovering it through an advertisement.
Together, these metrics answer the question every growth team ultimately cares about: are your ASO efforts attracting users who create lasting business value, or simply generating more installs?
How to build an ASO tracking workflow that actually informs decisions
Most teams don't really have a measurement problem, but an action problem. App Store Connect, Google Play Console, attribution platforms, and various ASO tools generate more data than most app teams can realistically process. Effective ASO tracking turns that information into a repeatable workflow.
The goal is to make faster, better decisions when performance changes, not just a prettier dashboard.
Set your baseline before you optimise
Before changing metadata, screenshots, videos, or localization assets, pull a 90-day snapshot of every metric across the five categories covered above. Capture keyword rankings, visibility, conversion rates, growth metrics, reviews, sentiment, and monetization data.
Without a baseline, attribution becomes guesswork. If installs rise after a metadata update, you need historical context to understand whether the change caused the improvement or whether seasonality, paid acquisition, or a featuring event played a role.
One practical challenge is data retention. App Store Connect provides valuable reporting, but historical windows are limited. An app store optimization tool such as AppFollow stores ranking history, visibility trends, ratings, reviews, and competitor data over much longer periods, making year-over-year analysis far easier.
Choose your tracking cadence by metric
Not every metric deserves the same review schedule.
- Keyword rankings and visibility metrics: daily
- Reviews, ratings, and sentiment: daily
- Conversion metrics: weekly
- Growth metrics: weekly
- Revenue, LTV, and monetization metrics: weekly to monthly
Keyword positions can move several places overnight after competitor updates, algorithm changes, or featuring events. Reviews and sentiment also require rapid response. LTV and subscription revenue tend to change more slowly, so weekly or monthly reporting is usually sufficient.
Good ASO tracking focuses attention where volatility is highest.
Connect every metric to a decision
This is where many dashboards fail. Every metric should have a trigger, an owner, and a predefined action.
Metric | Trigger Threshold | Owner | Action |
Keyword ranking | Drops >5 positions | Review metadata and competitor changes | |
Conversion rate | Falls >10% week-over-week | Growth Team | Audit screenshots, video, and messaging |
Rating score | Drops below 4.2 | Investigate review themes and recent releases | |
Organic installs | Decline >15% month-over-month | Review acquisition mix and visibility metrics |
"A dashboard tells you what happened. A workflow tells you what to do about it. Every ASO team can see a ranking drop, but the harder question is who owns the problem, what triggered it, and when action becomes necessary. The metric itself isn't the outcome. The decision it drives is what creates growth."
— Ilia Kukharev, Product Manager at AppFollow
The strongest workflows combine App Store Connect, Google Play Console, tracking software, integrations, and automation into a single system. When a metric crosses a threshold, the right person should know about it immediately and understand exactly what happens next.
cta_get_started_yellow
Top 3 ASO tracking mistakes
ASO tracking only helps when the data tells you what actually changed.
The problem? Many teams collect ASO metrics, but read them in isolation. A keyword drops. A chart position moves. Impressions go down. Everyone reacts fast, but nobody checks whether the change came from metadata, competitors, ratings, seasonality, a store algorithm shift, or a product issue.
That is how teams end up optimizing the wrong thing.
Here are the three mistakes that make ASO tracking noisy instead of useful.
1. Tracking keyword positions without context
Keyword rankings are useful, but a single position does not explain much on its own.
If your app moves from #8 to #12 for one keyword, that may look bad. But what if the keyword has low popularity? What if competitors also dropped? What if your visibility improved across a stronger keyword cluster? What if installs from that keyword did not change?
That is why keyword rankings should be tracked as trends, not screenshots.
Look at:
Don’t track only | Track instead |
One keyword position | Ranking trend over time |
One country | Country and locale differences |
One app | Competitor movement for the same terms |
Ranking alone | Ranking + popularity + difficulty + installs |
Daily fluctuation | Pattern before and after metadata updates |
The real question is not “Did this keyword move?” It is: “Did our search visibility improve for the keywords that can actually bring relevant users?”
2. Separating visibility metrics from conversion metrics
This is probably the most expensive ASO tracking mistake. Visibility metrics tell you whether users can find the app. Conversion metrics tell you whether they choose it.
You need both.
If impressions grow but installs stay flat, your listing may be visible but not persuasive enough. Maybe screenshots are weak. Maybe ratings are hurting trust. Maybe the subtitle promises one thing, but the creative tells another story.
If conversion improves but impressions drop, the listing may be strong, but fewer users are reaching it. That points back to keyword rankings, category positions, featured placements, or browse visibility.
A simple way to read the signal:
What changed | What it may mean |
Impressions up, installs flat | Visibility improved, conversion did not |
Impressions down, conversion stable | Discovery may be the issue |
Rankings up, installs down | Keyword quality or listing conversion may be weak |
Conversion up, revenue flat | User quality, pricing, or retention needs checking |
Rating drops, conversion drops | Trust signal may be blocking installs |
ASO is not just ranking higher. It is moving users from discovery to install with fewer leaks.
3. Ignoring reviews, ratings, and app quality signals
Some teams treat reviews and ratings as support data. That is a mistake.
Ratings affect trust. Reviews explain objections. Crash complaints expose product issues that can damage conversion. A weak release can pull down ratings, increase negative reviews, hurt product page performance, and make ASO results look worse even when metadata was not the real problem.
For example, if installs drop after an update, don’t check keywords first and stop there.
Check:
- Did the app rating change?
- Did 1-star reviews increase?
- Are users mentioning bugs, crashes, login issues, payments, ads, or missing features?
- Did the drop happen in one country or across all markets?
- Did it start after a specific app version?
- Did competitors move at the same time?
This is where ASO tracking becomes more than reporting. It becomes a diagnosis.
A good ASO dashboard should help teams connect visibility, conversion, reputation, and product quality. Otherwise, you are not tracking growth. You are watching disconnected numbers move around.
How AppFollow makes ASO tracking and metric extraction effortless
The challenge with ASO tracking isn't collecting data. App Store Connect, Google Play Console, attribution platforms, and analytics tools already generate plenty of it. The real challenge is turning disconnected metrics into decisions before rankings, conversion rates, or installs start moving in the wrong direction.
That's where AppFollow comes in.
More than 80,000 apps use AppFollow to centralize app store optimization metrics, monitor competitors, identify ranking opportunities, and connect store performance to business outcomes. Teams behind apps such as Miro, Audiomack, Earth Hero, and Sweatcoin use AppFollow to combine store intelligence, review insights, and competitive monitoring into a single workflow.
Instead of switching between dashboards, spreadsheets, and reporting tools, teams get a unified view of visibility, conversion, growth, feedback, and monetization signals.
Key ASO features for measurement and reporting
- Keyword Rank Tracker. Monitor keyword rankings across more than 100 countries and storefronts. Spot visibility changes before they impact installs.
- Search Visibility Score and Share of Voice. Measure competitive presence, identify keyword gaps, and understand how much search demand your app captures relative to competitors.
- Competitor Tracking. Track ranking movements, metadata updates, category positions, and visibility changes across competing apps.
- Ratings and Reviews Intelligence. Monitor sentiment trends, review volume, rating changes, and reply rates from a single dashboard.
- Automated Reporting. Build recurring reports for stakeholders without manually exporting data every week.
- Integrations and Data Workflows. Push ASO insights into Slack, Looker, Tableau, webhooks, and internal reporting systems through AppFollow's API and integrations.
- Store Intelligence and Alerts. Receive notifications when rankings, ratings, reviews, or visibility metrics change beyond predefined thresholds.
For teams looking for a dedicated app store optimization tool, AppFollow combines keyword intelligence, competitor monitoring, review management, and automated reporting in one platform instead of requiring multiple ASO tools.
cta_get_started_purple