ASO A/B Testing for Mobile Games: A Practitioner’s Guide to Store Listing Experiments

Table of Content:
- TL;DR — the ASO A/B testing lifecycle in 5 steps
- Why gaming ASO testing behaves differently
- How Google Play store listing experiments actually work
- Apple’s testing options: PPO and custom product pages
- The 8 gaming ASO test scenarios that actually pay back
- The A/B testing methodology rules for gaming ASO
- How to prioritize what to test next
- Close the testing loop with AppFollow
- Frequently asked questions about ASO A/B testing for mobile games
If you run ASO A/B testing for a mobile game, the next experiment is already sitting in a backlog somewhere. It looks simple on the ticket: new icon, new first screenshot, split the traffic, wait for a winner. Then paid UA shifts your traffic mix mid-run, a LiveOps event lands on day four, and the variant everyone loved finishes 4% ahead with a confidence interval you cannot defend in a meeting.
That gap between “the graph went up” and “we can act on this” is where a testing program quietly stops compounding.
App store optimization (ASO) for games makes the work harder than in most categories. Traffic swings around launches and events, creative variants are dramatic rather than incremental, and the two stores do not offer the same mechanics. A hypothesis that runs cleanly in Play Console may not be testable at all on iOS.
This is the runbook we use with gaming customers at AppFollow: a five-step lifecycle, eight scenario cards built around what each store will actually let you test in 2026, and the methodology that separates a real winner from an attractive accident.
We stay on testing discipline throughout. The icon, screenshot, and video guides own the creative craft; the ASO for games playbook covers the foundations underneath it.
TL;DR — the ASO A/B testing lifecycle in 5 steps
Good ASO A/B testing is less about finding prettier creative and more about making one clean, defensible decision. Every store listing experiment worth running follows the same five steps.
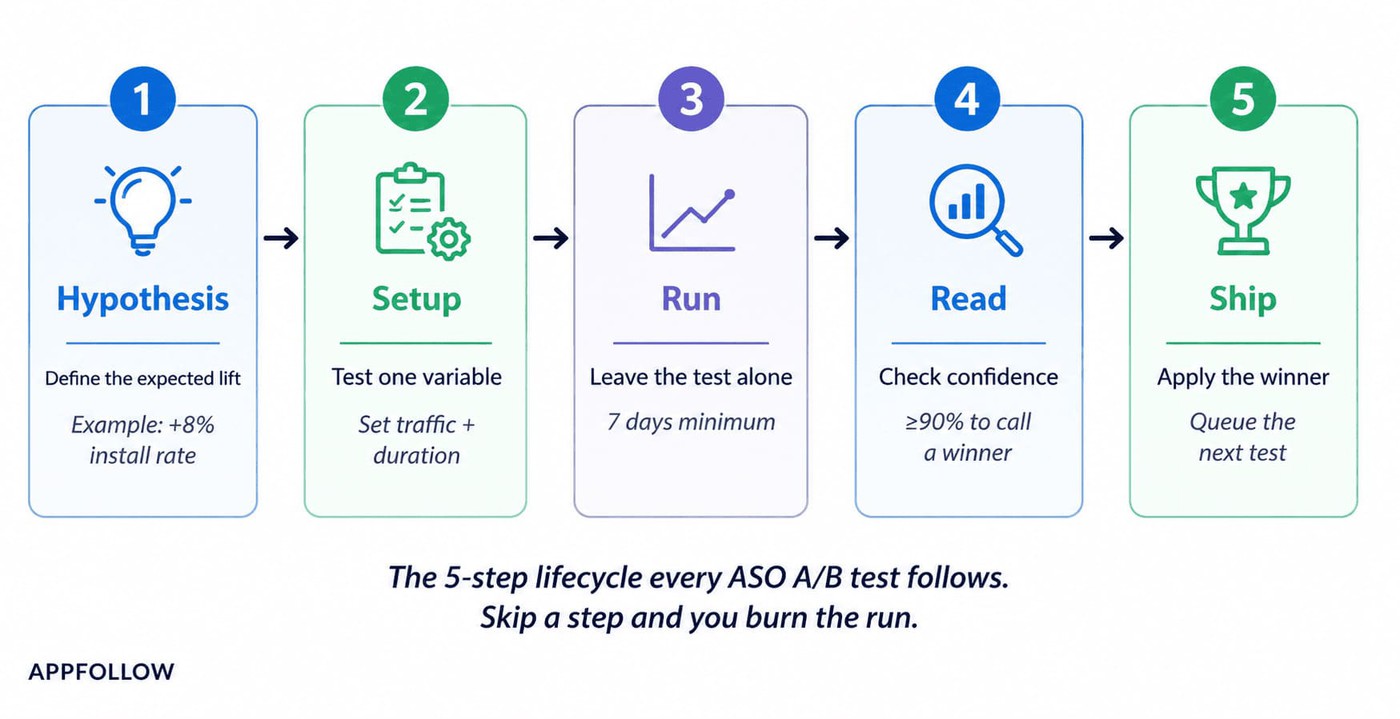
- Hypothesis. Write the expected movement down before you open the console. “Treatment icon lifts install rate by 8%” is testable. “Treatment is better” is a preference.
- Setup. Change one variable. Configure the experiment in Play Console under Store presence, set your audience percentage, confidence level, and minimum detectable effect.
- Run. Leave it alone. Mid-test creative edits destroy attribution. Seven days is the practical floor; 14 is the working window for most games.
- Read. Check the result against the threshold you set on day one. A positive direction below your confidence level is inconclusive, not a soft win.
- Ship. Apply the winner, record what you learned including the losers, then queue the next test.
Most of the value sits in step one. Undisciplined hypotheses produce experiments that cannot conclude, no matter how much traffic you feed them.
Why gaming ASO testing behaves differently
Everything below comes from running this loop with gaming customers and from the published creative-testing research we cross-check our own observations against. Mobile game A/B testing is noisy because you are testing the thing that sells the fantasy: character choice, art direction, gameplay hero, event theme. The swings are bigger in both directions.
Where to start, by situation:
- Pre-launch games. Test the icon and first screenshot before paid UA starts buying traffic to an unproven listing.
- Live games with paid UA. Test the first screenshot and screenshot order, and watch the result alongside your mobile game KPIs rather than in isolation.
- Mature games launching an event. Test the feature graphic against your evergreen control instead of assuming fresh art converts better.
- Portfolio publishers. Standardize one framework and aim for one experiment per app per month. Comparable method across titles is worth more than a faster cadence on one.
- Teams rebuilding after a bad patch. Fix the product and the review situation first. Creative testing on a listing that is actively shedding rating stars measures the wrong thing.
Four findings are worth carrying into the planning meeting.
- The icon is the highest-leverage asset you can test. SplitMetrics’ 2024 analysis of close to 200 apps and more than 3,500 A/B tests across both stores found icon optimization can deliver up to 25% more users, with simple, uncluttered icon backgrounds producing conversion increases above 26% across categories.
- Screenshot attention drops off a cliff. The same dataset found close to half of store visitors look only at the first two screenshots, and just 7% reach the fifth. That is the whole argument for testing the opening frame before anything further down the set.
- Confidence is a setting, not a fact. Play Console lets you choose the confidence level and the minimum detectable effect per experiment, and Apple advises acting on a Product Page Optimization result only once a treatment is declared better or worse at 90% confidence. Two teams running identical creative can reach opposite conclusions purely from how they configured the test.
- Video is where the stores diverge hardest. Apple’s PPO explicitly supports app preview videos. Google’s current store listing experiments documentation does not list the promo video among testable assets at all — a gap that quietly invalidates a lot of Android video-test planning.
“The tests that pay back are the ones where a player can see the difference at thumbnail size. Icon character, first screenshot, feature graphic. Tiny palette shifts and cosmetic copy edits are where we see the most inconclusive results.”
— Ilya Kataev, Professional Services Team Lead, AppFollow
Iya Kataev is describing an effect-size problem, not a taste problem. Every experiment needs a difference large enough to detect with the traffic you have, and Play Console makes this explicit by asking you to set a minimum detectable effect before the test starts. A variant that differs by 3% needs vastly more traffic than one that differs by 15%.
When the two creatives are near-identical, you have quietly designed a test that your daily visitor volume cannot resolve.
In practice: shrink both variants to 48×48 pixels and put them side by side on your monitor. If you have to look twice to tell them apart, the experiment will most likely return a draw and cost you three weeks.
What to do next: run the thumbnail check on every variant before it enters the console, and set your minimum detectable effect to the smallest lift that would actually change a business decision — not the smallest lift you hope to see.
How Google Play store listing experiments actually work
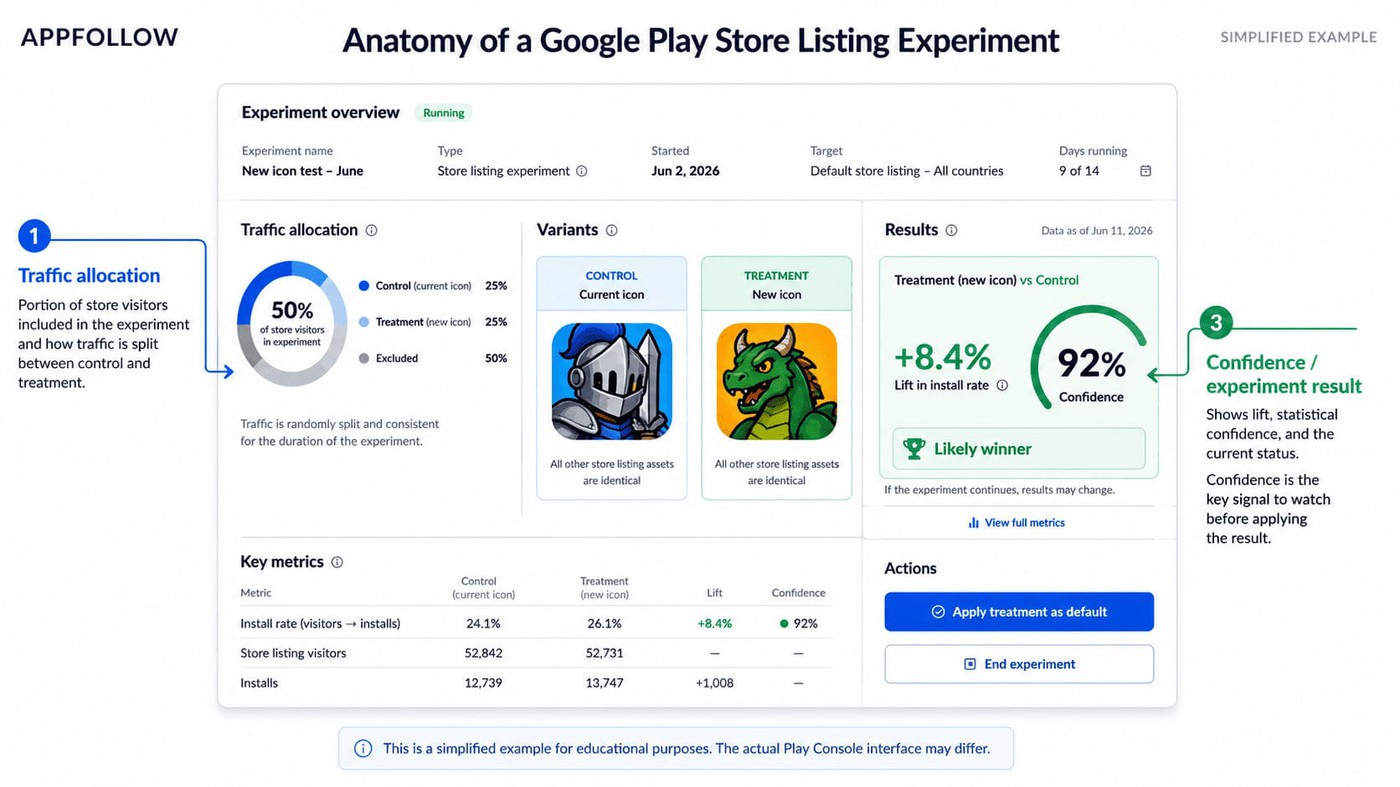
Store listing experiments are Play Console’s native A/B testing framework and the primary testing surface on Android. The configuration screen now asks you to set a confidence level and a minimum detectable effect, and Google’s current documentation caps you at two variants where older guidance said three.
Re-read the setup flow before you plan a sprint against it.
What you can test in Play Console
Google’s documentation splits experiments into two types, and the distinction determines what you are allowed to change.
A default graphics experiment tests your icon, feature graphic, and screenshots in your app’s default store listing language.
A localized experiment tests the icon, feature graphic, screenshots, and your app’s descriptions in up to five languages at once. You can run one default graphics experiment or up to five localized experiments simultaneously, so the two types compete for the same slot in your calendar.
What is absent from that list matters more than what is on it. Google’s current store listing experiments documentation does not include the promo video among testable assets, and it does not include the app title, category, or developer contact details either.
Several widely-read ASO guides published in the last year still list the video as testable on Play. Check the asset picker in your own console before you commit a sprint to an Android video test. Handle title work through app title optimization and metadata work through ASO keyword research, neither of which runs as an experiment.
For context on what you are swapping, Google allows up to eight screenshots per supported device type with a minimum of two, requires a 1024×500 feature graphic to publish at all, caps the short description at 80 characters, and adds preview videos through a YouTube URL — which it explicitly recommends for games.
Audience percentage, variants, and duration
An experiment runs your current listing as the control against experimental variants, and Play Console currently caps you at two variants against that control. Older documentation says three. Plan against two.
Four settings decide how fast the test resolves. The experiment audience percentage sets what share of store listing visitors see a variant instead of the current listing. The number of variants splits that pool. The confidence level determines how often the reported interval contains the listing’s true performance, so raising it reduces false positives at the cost of time.
The minimum detectable effect defines the smallest gap between variant and control that will be called a win — anything smaller is scored a draw.
Play Console gives you a calculator that estimates time to completion from those inputs and your traffic. Use it. It converts an argument about whether to run for two weeks or four into an arithmetic problem you can settle before anyone writes a brief.
Two duration facts are worth separating.
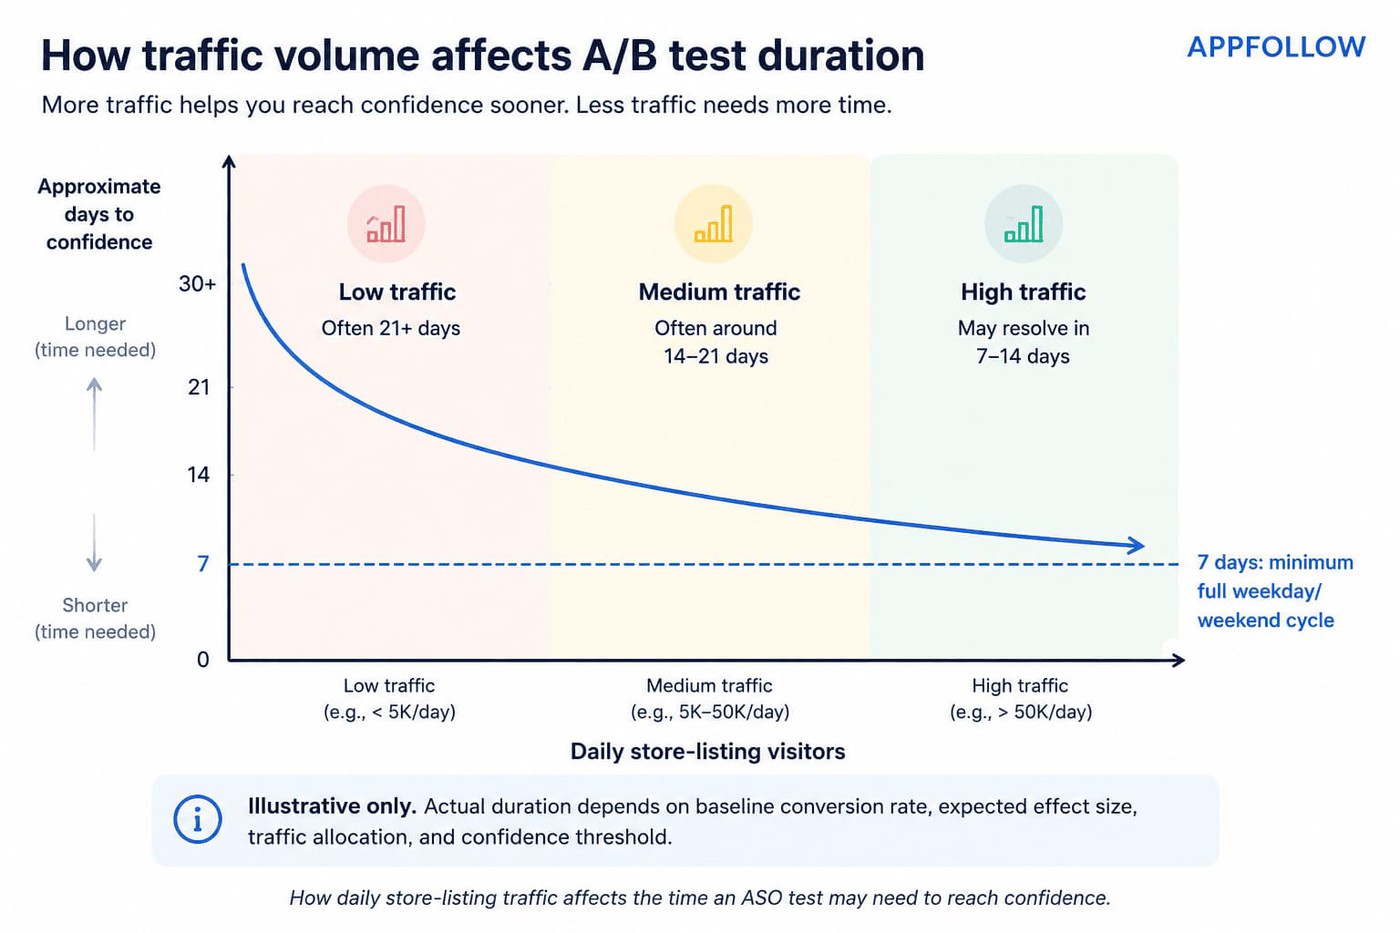
- Google stops experiments automatically after six months, which is a ceiling, not a target. Seven days is the practitioner floor because it captures a full weekday-weekend cycle, and 14 days is the working window most gaming teams settle on.
- Neither is a Google requirement. A game with 100,000 daily listing visitors resolves a moderate difference far faster than one with 5,000, and no calendar rule substitutes for that arithmetic.
Once an experiment is live, leave it alone. Editing creative mid-run does not give you a cleaner test — it gives you two half-tests you cannot combine.
Reading the result: winner, no winner, need more data
Your experiment has three practical outcomes, and only one of them is a decision.
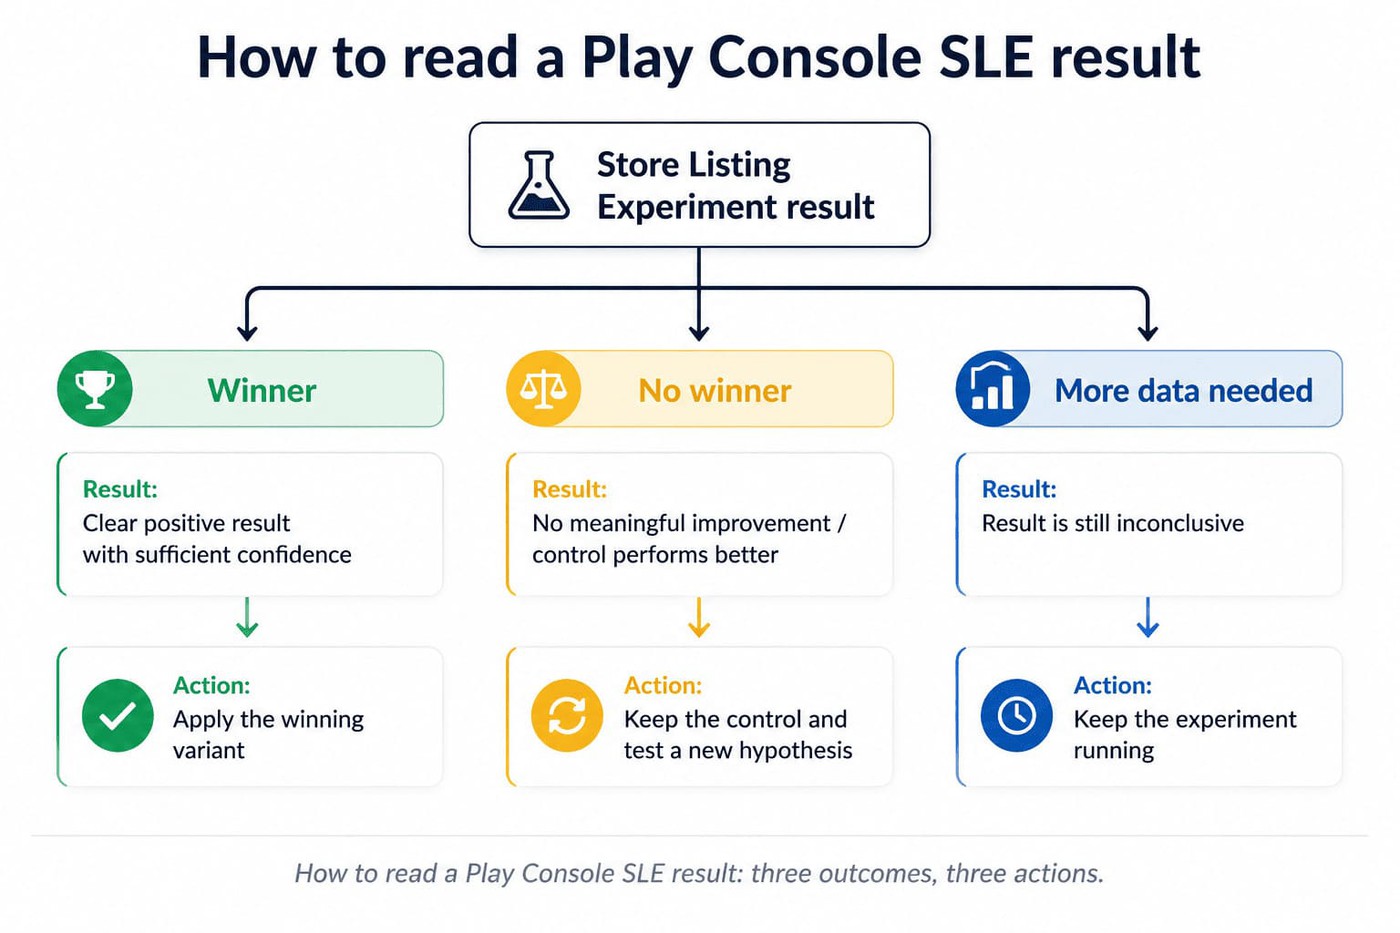
- A variant clears both your confidence level and your MDE. Apply it as the default.
- Nothing beats the control, or the gap falls below your MDE. Keep the control and log a scored draw. This is a result, not a failure — you have ruled something out.
- The experiment has not gathered enough evidence yet. Keep it running, or accept that your traffic cannot resolve the difference you asked for.
The third case is the expensive one. A variant sitting 6% ahead at 82% confidence is not a 6% lift you can bank, and lowering the threshold after you have seen the number is the single fastest way to ship a false positive into your listing. Decide the threshold on day one, write it in the ticket, and hold it.
Apple’s testing options: PPO and custom product pages
App store A/B testing on iOS works differently enough that copying an Android plan across will not survive contact with App Store Connect. Apple gives you two mechanisms that get discussed interchangeably and should not be. One is a randomized experiment; the other is targeting.
Product Page Optimization is Apple’s native ASO A/B testing feature for users on iOS and iPadOS 15 or later. You can run up to three treatments against your original product page, changing the app icon, screenshots, or app preview videos.
You set the share of traffic entering the test. Allocate 40% across two treatments and each gets 20%, with the original keeping 60%. App Store Connect reports results in App Analytics, and a test can run for up to 90 days. Apple’s own guidance is to wait until at least one treatment is declared better or worse than the baseline at 90% confidence before acting on it.
Note the asymmetry with Android. PPO offers fewer testable elements overall, with no title, no long description, and no feature graphic to swap. But it does support app preview videos, which is precisely what Play Console’s experiment documentation currently omits. If video is the question you need answered, iOS is where you can answer it with a randomized test.
Custom product pages solve a different problem, and they are not A/B tests. A CPP is an alternative product page with its own URL and its own screenshots, promotional text, and app previews, built for a specific audience or UA source.
Apple allows up to 70 per app, double the limit of 35 that a lot of guidance still quotes, and you can assign keywords so a CPP surfaces in relevant search results rather than your default page. Use PPO when you need a randomized winner. Use CPPs when you already know which experience a particular audience should see.
The 8 gaming ASO test scenarios that actually pay back
The expensive part of mobile game A/B testing is not the two weeks of runtime. It is spending those two weeks on a test that was never capable of teaching you anything. Each card below covers the test design: what you are proving, which variants create a real comparison, what sensitivity to configure, and what evidence earns a rollout. The creative craft lives in the linked guides.
One column needs an explanation. MDE to set is the minimum detectable effect you configure in Play Console — the smallest difference that will be scored as a win rather than a draw. We give a starting range rather than an expected lift, because the honest answer to “how much will this gain me” depends on your creative, category, and traffic.
What you control is the sensitivity you ask the test for. Set the MDE too low and your traffic will never resolve it; set it too high and real improvements get scored as draws.
Scenario | Asset and store | Variants that create a real comparison | MDE to set | Run it when |
|---|---|---|---|---|
Icon character or mascot | Icon — Play SLE and iOS PPO | Different featured character, mascot, or focal action | 5–10% | First, once you have two genuinely distinct concepts |
First screenshot hook | Screenshots — Play SLE and iOS PPO | Gameplay action vs. character reveal (two on Play, three on PPO) | 5–10% | Early, alongside or right after the icon |
App preview video | Video — iOS PPO only | Different opening hook or gameplay payoff | 8–15% | When iOS traffic supports it; not testable via Play SLE |
Feature graphic art direction | Feature graphic — Play SLE only | Art direction, event theme, or featured character | 5–10% | Ahead of an event, for Play browse traffic |
Screenshot order | Screenshot sequence — Play SLE and iOS PPO | Gameplay-first vs. character-first sequence | 4–8% | When the screenshot set itself is stable |
Short description hook | Short description — Play localized experiment | Benefit-first vs. feature-first hook | 3–6% | After the major visual questions are settled |
Icon palette | Icon — Play SLE and iOS PPO | Warm vs. cool, saturated vs. muted, subject held constant | 4–8% | After icon subject and composition are settled |
Video length and edit | Video — iOS PPO only | 15s vs. 20s vs. 30s cuts of the same footage | 5–10% | After the underlying video creative is stable |
Scenarios are ordered by leverage, which is also the order we recommend running them. If capacity is tight, stop at row two — icon and first-screenshot tests deserve your traffic before anything further down.
1. Icon character or mascot A/B test
Hypothesis. “The variant icon featuring Character A lifts install rate by at least 8% versus the control featuring Character B.” Put the number in the ticket before the app icon A/B test is configured. A 2% directional lift becomes remarkably persuasive once the whole team has seen the new art.
Variants that work. Two variants with genuinely different focal points — a different character, a different mascot, a different focal action. Not a designer’s micro-adjustment to the same composition.
MDE to set. Start at 5–10%. The icon is the most visible thing a player encounters, so two genuinely different concepts should differ by more than that. Set it lower only if your daily listing traffic can support the longer run — Play Console’s calculator will tell you before you commit.
Read the result. For a change this visible, raise the confidence level rather than lowering the MDE. Ship the winner, and record the losing variant with its numbers alongside it.
Common mistakes. Near-identical variants that burn traffic on a guaranteed draw. Rotating creative before the test concludes. Skipping the safe-area check across search results, charts, and category surfaces, where the icon renders at very different sizes.
For the creative principles behind the concepts themselves, see our guide to creating a standout app icon.
2. First screenshot A/B test
Your first screenshot has one job before any other: give the player a reason to keep looking. The attention data makes the stakes plain — close to half of store visitors never look past the first two screenshots.
Hypothesis. “A first screenshot showing a gameplay moment lifts install rate by at least 8% versus the current character reveal.”
Variants that work. Two distinct hooks: an action-heavy gameplay moment against a character reveal, or a narrative frame against gameplay. Hold the rest of the sequence constant so you know what moved the number.
MDE to set. 5–10%, for the same reason as the icon. This is a first-impression asset with room for a real difference.
Read the result. Apply the winner when it clears your configured threshold. When the variant points up but lands below your MDE, the console scores a draw and so should you. “Looks promising” is not a result.
Common mistakes. Letting prettier drift into less truthful — screenshots that oversell gameplay win the tap and lose the player in week one, which shows up in your reviews rather than your conversion rate. Also check how landscape gaming creative renders on portrait-heavy store surfaces, and localize embedded copy before testing in another market.
Sequencing, framing, and caption craft live in our ASO screenshots guide.
3. App preview video A/B test (iOS only)
Start here with a platform fact rather than a hypothesis: as of this writing you cannot run a randomized video test through Google Play store listing experiments. The documented asset list does not include the promo video. Apple’s PPO does support app preview videos, so iOS is where this experiment lives.
Hypothesis. “A preview video opening on a gameplay moment lifts install rate by at least 10% versus the current cinematic opening.”
Variants that work. Up to three treatments in PPO, each with a genuinely different opening hook or payoff. Keep the rest of the product page identical.
MDE to set. 8–15%. Video engagement comes from a subset of product page visitors, so the effective sample is smaller than the traffic number suggests and small effects are hard to resolve.
Read the result. Give it room — Apple allows up to 90 days, and video tests usually need more of that window than static ones. Judge on installs, not on plays. A hook that wins attention and loses the install is not a winner.
On Android, the fallback is sequential measurement: change the video, hold everything else steady, compare a clean before-and-after window. Know what that buys you and what it does not.
Our own Social Quantum case study is a fair illustration of the limits. Megapolis saw a 110% increase in organic installs and an 82.7% conversion-rate improvement. The team also refreshed the icon and the keywords in the same period, and the measurement window ran through December. The result is real and the direction is convincing. It cannot tell you how much of it the video earned.
That is the structural weakness of pre/post measurement, and it is why the randomized version of this test belongs on iOS, where the store supports it.
Common mistakes. Reading video plays as the outcome instead of installs. Changing the thumbnail frame and the edit inside one treatment, so a win cannot be attributed to either. Assuming an iOS video result transfers to Android, where thumbnail-to-play behavior differs.
Production, pacing, and hook construction are covered in our ASO video strategies playbook.
cta_get_started_purple
4. Feature graphic art direction A/B test
The feature graphic is a Google Play-only lever, and it is mandatory: Google requires a 1024×500 feature graphic to publish a store listing at all. Its influence depends heavily on where players meet your listing.
Hypothesis. “A feature graphic with an event-focused art direction lifts store listing conversion by at least 6% versus the current evergreen graphic.”
Variants that work. Two treatments that make a real creative choice — different characters, different art directions, an event theme against evergreen. Background tweaks tell you nothing.
MDE to set. 5–10%. Set it against your browse-heavy traffic, since that is where the asset does its work.
Read the result. An event launch gives you a natural testing window, but only when the event is part of the hypothesis rather than a surprise landing halfway through.
The console reports one blended conversion number for the experiment. Since the feature graphic does most of its work on browse surfaces, pull your own channel split from store analytics for the same window — a graphic that moves browse traffic and leaves search flat is still a win, and the blended figure hides it.
Common mistakes. Assuming the graphic appears everywhere it might. Treating a winner as permanent creative — live games move on, and seasonal art expires whether or not it won a test.
The tests that pay back most consistently are the ones where the player can see a meaningful difference immediately: icon character, first screenshot, feature graphic. Tiny color adjustments and cosmetic copy changes are where we see the most inconclusive results. If the variants look almost identical at thumbnail size, you've probably designed a weak experiment.
— Ilya Kataev, Professional Services Team Lead, AppFollow
5. Screenshot order A/B test
This is the best low-risk experiment in the set, because you are changing the sequence rather than commissioning new art. Production cost is close to zero.
Hypothesis. “A gameplay-first screenshot order lifts install rate by at least 5% versus the current narrative-first sequence.”
Variants that work. Keep the same five to eight screenshots and reorder them around distinct opening hooks. Gameplay action first in one variant, character reveal first in the other. Constant assets are what make sequence the variable.
MDE to set. 4–8%. The ceiling is lower than a first-screenshot creative test because you are re-sequencing existing material rather than replacing the first impression.
Read the result. Apply the winner at your threshold. A draw here costs almost nothing, which makes it a good ASO test to run while a more expensive creative brief is still in production.
Common mistakes. Reordering without a hypothesis, which is shuffling. Decide what you believe the player needs to understand first. A mechanics-led puzzle game and a story-driven RPG should not reach the same answer.
6. Short description hook A/B test
Text rarely rescues a weak visual package, but it is cheap to test once the bigger decisions are settled. On Play this runs as a localized experiment, which is a different slot in your calendar than a default graphics test.
Hypothesis. “A short description opening with a benefit-first hook lifts install rate by at least 4% versus the current feature-first opening.”
Variants that work. Two treatments built on genuinely different hooks. You have 80 characters, so do not spend the experiment on comparing near-synonyms.
MDE to set. 3–6%, and be realistic about your traffic. A small MDE on a low-traffic game produces a test that runs until Google stops it at six months.
Read the result. Remember where the copy sits in the decision path. Players have already processed your icon and screenshots before the short description gets its turn, so a modest effect here is the expected outcome, not a disappointment.
Common mistakes. Compressing three ideas into 80 characters, which muddies the hypothesis. Assuming a winning hook survives translation — it frequently does not, which is exactly why localized experiments exist.
The copywriting side is covered in our ASO description guide.
7. Icon palette A/B test
Palette is phase-two work. Settle what the player is looking at before you argue about what color it is.
Hypothesis. “An icon with a saturated palette lifts install rate by at least 5% versus the current muted treatment.”
Variants that work. Hold subject and composition fixed, then compare clearly different palettes — warm against cool, saturated against muted. Change the character at the same time and you have learned nothing about color.
MDE to set. 4–8%. Be honest that this is a second-order test. The strongest published evidence on icon backgrounds concerns clutter rather than hue — SplitMetrics found simple, uncluttered backgrounds producing conversion increases above 26% — so if your icon is busy, test simplification before you test palette. Palette alone usually moves less.
Read the result. Use a high confidence level before replacing a stable icon that players already recognize. An inconclusive result means keep the control, not promote whichever variant is marginally ahead.
Common mistakes. Testing color without genre context — players read palette against the conventions of the category they are browsing. And the big one: using palette experiments to avoid confronting a weak icon concept.
8. Video length and edit A/B test (iOS only)
Shorter feels like the obvious bet. Do not hand it the trophy before the test runs — cutting runtime often improves completion while removing the exact gameplay moment that persuades someone to install. Like scenario 3, this is a PPO experiment, since Play’s documented experiment assets do not include video.
Hypothesis. “A 20-second preview lifts install rate by at least 6% versus the current 30-second version.”
Variants that work. Two or three lengths cut from the same footage — 15, 20, and 30 seconds. Different edits, not a new creative concept. Length has to stay the variable.
MDE to set. 5–10%, and budget more of the 90-day window than a static test needs.
Read the result. Do not crown the version with the best completion rate. Completion is a proxy; downstream installs are the outcome. The two disagree more often than you would expect.
Common mistakes. An aggressive cut that removes the payoff. Treating “shorter wins” as a rule. And transferring an iOS conclusion straight to Android, where the thumbnail-to-video behavior is different.
The A/B testing methodology rules for gaming ASO
Most of the value in ASO A/B testing lives in the method rather than the creative, and the rules below are the ones we walk every gaming customer through before their first ASO test goes live. Get the discipline right and mediocre creative still teaches you something. Get it wrong and excellent creative produces a confident wrong answer.
Change one variable at a time. Testing a new icon and a new first screenshot together may well lift conversion, but you will not know which one earned it — so the result cannot inform the next test. Run them sequentially. This rule sounds too basic to state and is the first one broken whenever a creative refresh is waiting to ship.
The most common mistake we see is teams changing multiple things at once and celebrating the lift. Then they can't attribute what worked, so the next test starts from scratch. Discipline is boring, but it compounds. Change one thing. Wait for confidence. Ship or don't. Repeat.
— Ilia Kukharev, Product Manager, AppFollow
The cost of a bundled change is not the test you just ran. It is every test after it. A clean result narrows the question — you learn that character A beats character B, and next quarter’s brief starts from there. A bundled result leaves the question exactly as wide as it was, so you pay the full price of an experiment and keep none of the learning.
In practice: when a redesign touches four assets at once, ship the bundle as an untested update if the business needs it, then test the individual assets afterwards against the new baseline. Do not relabel a bundled release as an experiment.
What to do next: add a single field to your test ticket template — “variables changed: 1” — and treat any ticket that cannot honestly say 1 as a release, not an experiment.
- Put a number in the hypothesis. “Icon B lifts install rate by 10%” forces you to name the effect you are looking for, which is the same number Play Console asks for as your minimum detectable effect. “Icon B is better” gives the console nothing to work with and gives you nothing to defend.
- Set your confidence level and MDE before you see anything. Both are configurable in Play Console; Apple reports PPO results against a 90% threshold. Raising confidence reduces false positives and costs you time and traffic. Whatever you choose, do not adjust it because a variant you like stopped just short. Statistical significance is only meaningful against a threshold fixed in advance: a result at 92% is not a result at 95%, it is the same data with a moved goalpost.
- Give the experiment enough traffic and time. There is no universal ASO test sample size, and anyone quoting one is guessing. Baseline conversion, audience percentage, variant count, expected effect, and confidence level all feed the same calculation, and Play Console’s calculator does it for you. Run at least one full seven-day cycle so weekday effects do not dominate; 14 days suits most games. For some low-traffic titles the honest answer is that a randomized test is not available at their volume.
- Keep seasonality outside the experiment. Christmas, Lunar New Year, Ramadan, major LiveOps beats, paid-UA spikes, and store featuring all change who arrives at the listing. That contaminates the comparison unless the event is the hypothesis. If your traffic environment shifts materially mid-run, stop pretending the control stayed controlled and rerun the test.
- Validate the winner for 30 days after you ship it. Novelty effects fade, competitors respond, and seasonal tailwinds that flattered the test window disappear. Watch conversion, rank, and review sentiment for the following month, comparing the post-ship trajectory against both the pre-test baseline and the test window. This is the step teams skip, and the one that catches a winner quietly decaying on your listing for two quarters.
cta_get_started_yellow
How to prioritize what to test next
Every gaming ASO team has more test ideas than test capacity, so the prioritization question is really a sequencing question. We use an impact-by-effort matrix adapted to the gaming asset hierarchy.
In a mobile game A/B testing roadmap, impact sets the default order, and it is the order of the table above: icon, first screenshot, app preview video, feature graphic, screenshot order, short description, palette, video length. Icon and first-screenshot changes lead because they act earliest in the store decision and leave the most room for a difference a player can actually see.
Further down the list you are refining an asset that already works. That is worth doing, but not before the first impression has been settled.
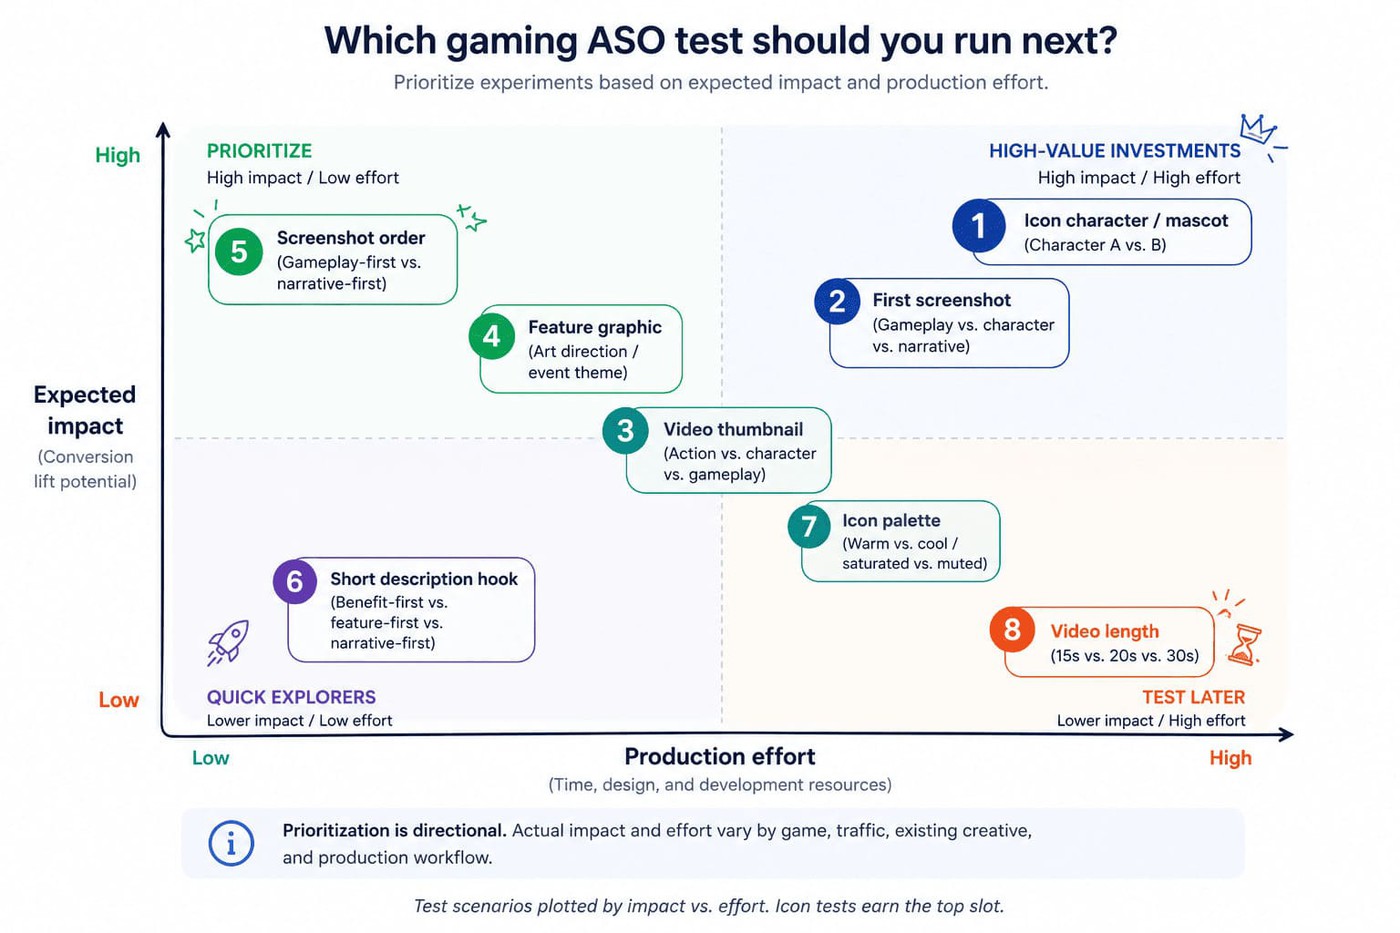
Effort reorders things at the margin. A screenshot reorder costs nothing because the assets exist, and short-description hooks are similarly cheap. Feature graphics and preview videos need fresh production; icon treatments can mean a real art cycle.
But cheap should not automatically win. One high-impact test with a strong hypothesis beats three convenient tweaks chosen because production had capacity.
Store constraints reorder things more than most roadmaps account for. You get one default graphics experiment or up to five localized experiments running at once on Play, so an icon test and a feature graphic test cannot both occupy the same window unless you localize. Video questions have to route through iOS. Build the calendar against those limits rather than discovering them the week you planned to launch three tests.
For a live game with reasonable traffic, one experiment every three to four weeks is a workable rhythm: roughly 14 days of runtime, then time to read the result and prepare the next variant. Portfolio publishers can run several in parallel across titles, provided art and community teams can absorb it without turning the roadmap into a production queue.
After six months the asset is not the winners you shipped. It is the record of which characters, hooks, and art directions repeatedly failed to move conversion — which is what makes the next prioritization call take an hour instead of a week.
Close the testing loop with AppFollow
AppFollow is not a testing tool, and we would rather say so plainly than blur it. Play Console owns store listing experiments; App Store Connect owns PPO. Both report on the experiment window, and both stop at its edges — before the test, after the rollout, and outside the listing itself.
AppFollow’s job is the measurement record around the test, which is what turns twelve isolated experiments into something a team can reason from.
Three questions come up in customer conversations that an experiment report cannot answer on its own.
Which traffic actually won? The console gives you one blended conversion number. AppFollow’s ASO analytics pulls Downloads, Page Views, and Impressions from your connected App Store Connect and Google Play accounts, filterable by traffic channel — Search, Browse, and third-party — as well as by country and date range.
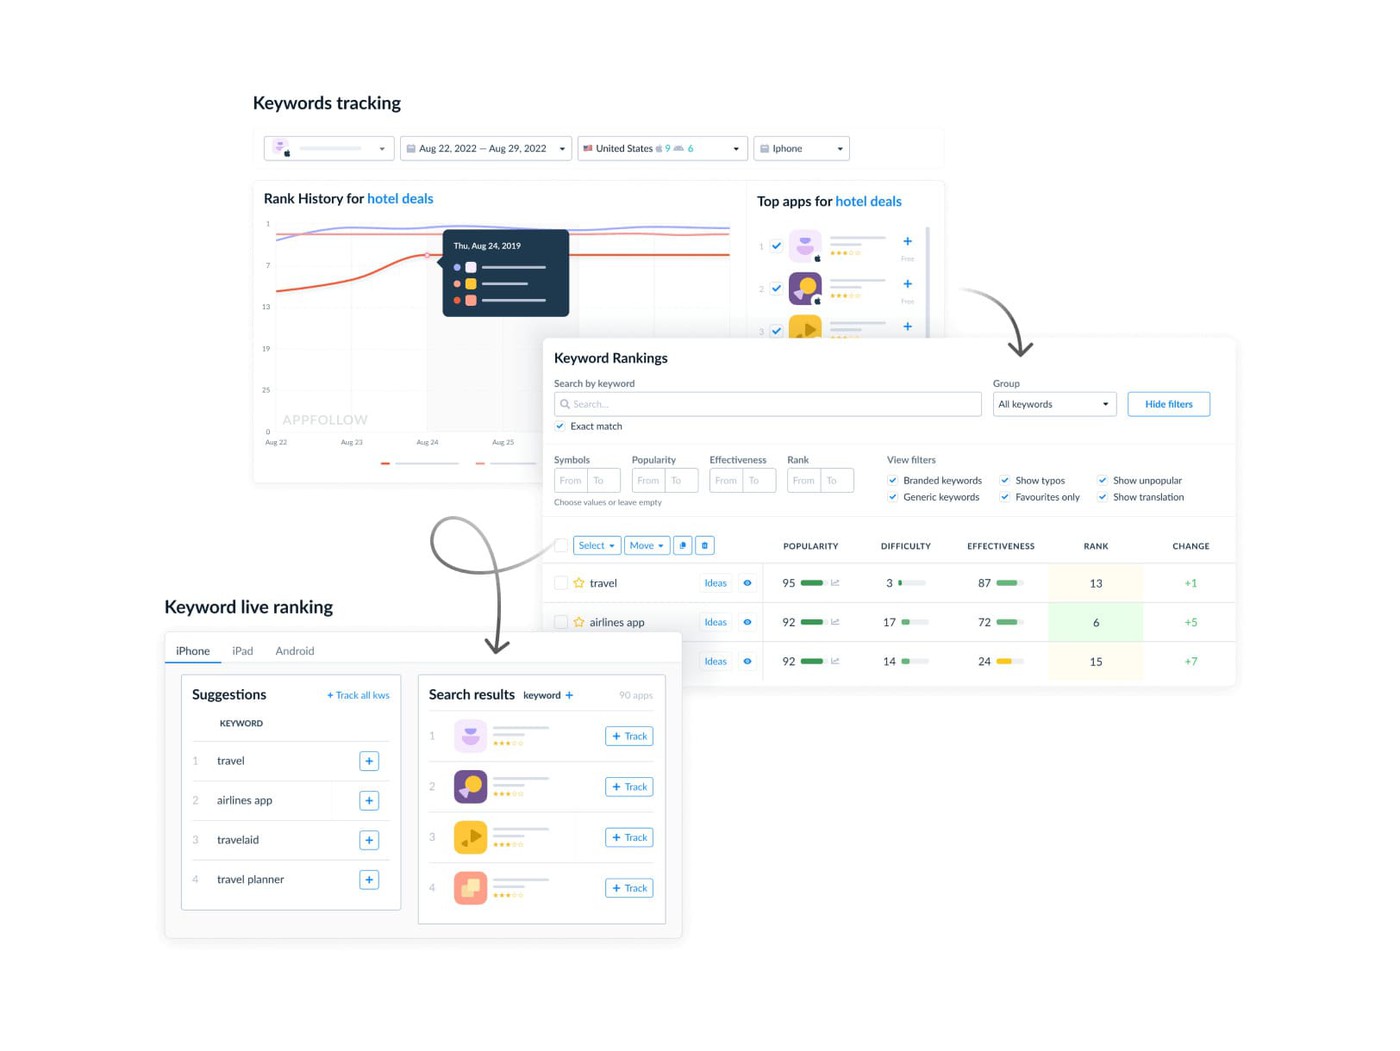
That split is what makes a feature graphic result readable, because the asset does its work on browse surfaces and a blended figure can hide a strong browse-side win. Record your test start and end dates somewhere you will still have them in three months, then compare each channel across that window.
Did visibility move at the same time? Keyword rank tracking across 100+ countries and storefronts tells you whether search position shifted during the run. Rank changes the mix of players arriving at the listing, so a variant that “won” during a week when your top keyword climbed twelve positions may not deserve the credit.
How did players react? Creative changes rarely dominate review conversations, but loyal players notice a new icon, and a listing that sets different expectations produces different week-one reviews. Watching sentiment and recurring topics through ratings and reviews alongside the experiment catches the variant that wins the install and loses the player a fortnight later.
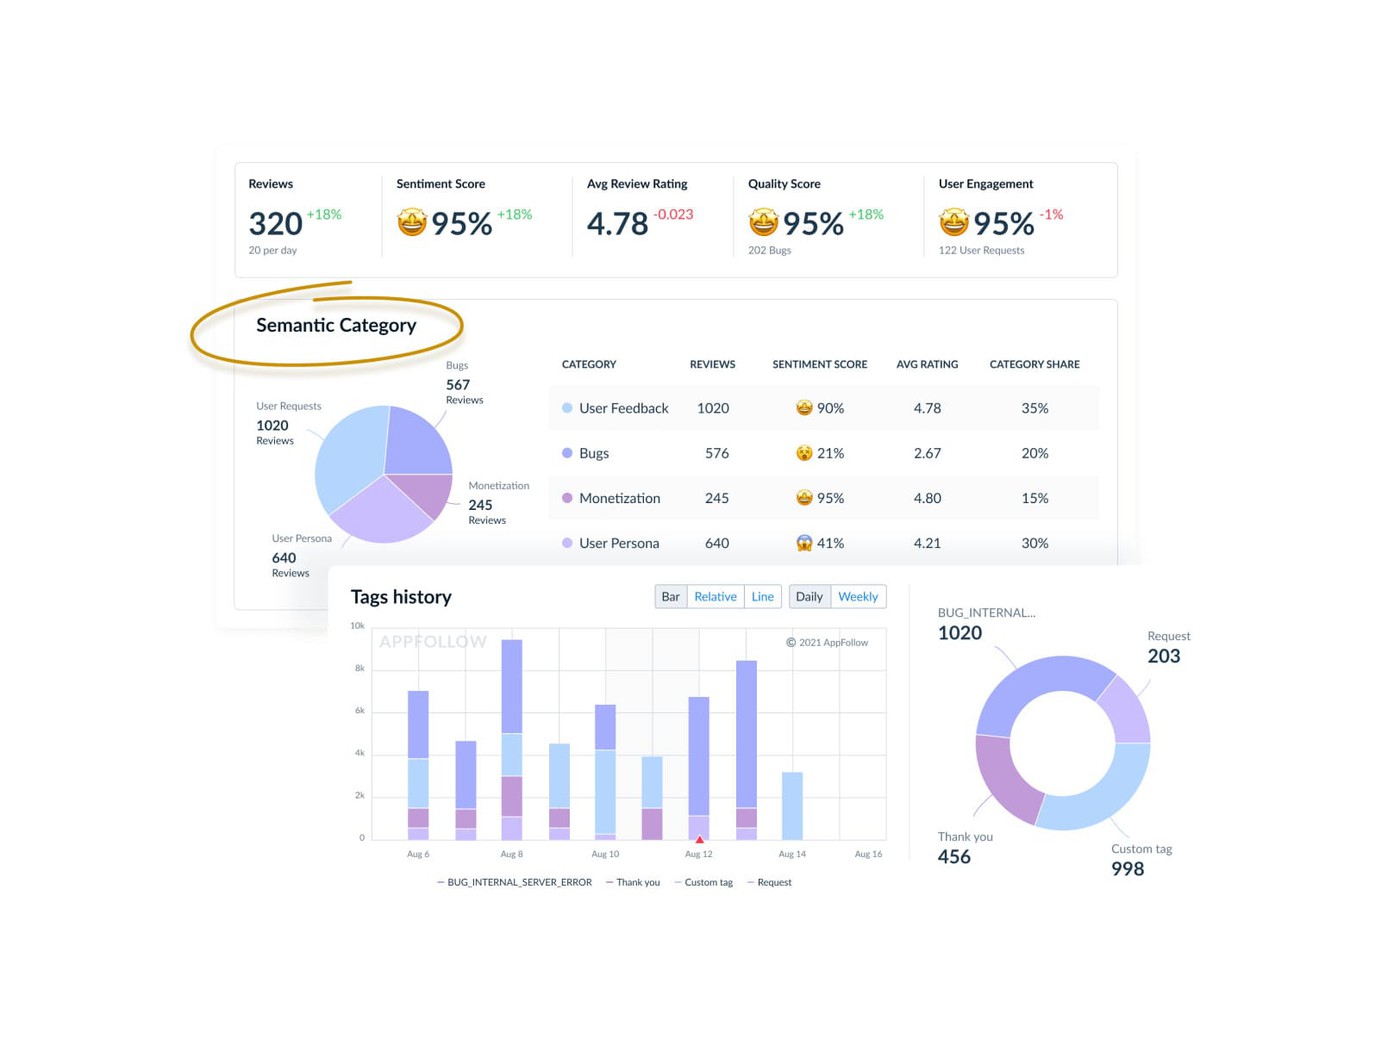
At gaming review volumes that signal needs routing, not just reading — our mobile game review management guide covers how.
Category context closes the last gap. Competitor Intelligence tracks competitor metadata, ranking movements, and featuring events, so if your variant wins the same week a close competitor repositions or gets featured, you know that before crediting the creative with every point of movement.
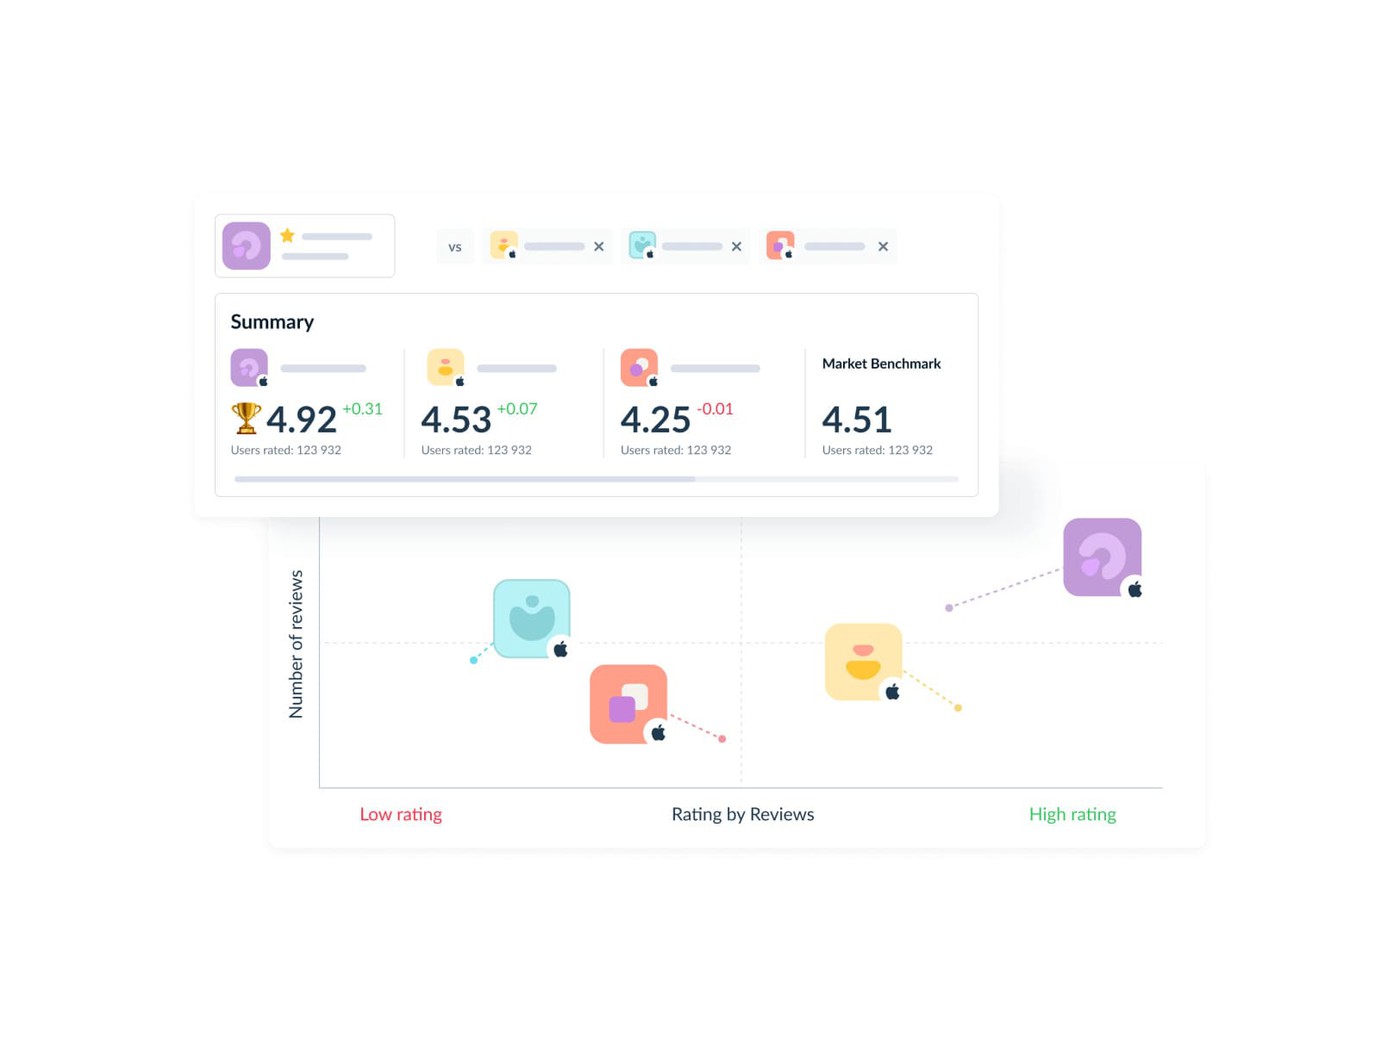
The 30-day validation from rule six is where this comes together. Keep watching conversion, rank, and sentiment for a month after rollout, with the start, end, and rollout dates marked. A short-lived lift and a durable improvement look identical on the day you ship. They stop looking identical around week three.
cta_get_started_purple
Frequently asked questions about ASO A/B testing for mobile games
How do I run an ASO A/B test on my mobile game?
On Google Play, create a store listing experiment in Play Console, pick one asset, build the variant, then set your audience percentage, confidence level, and minimum detectable effect. On iOS, use Product Page Optimization in App Store Connect for randomized icon, screenshot, and preview-video tests. Change one variable, and decide your threshold before the test starts.
How long should I run a Google Play store listing experiment?
Run at least seven days so the sample covers a full weekday-weekend cycle. Fourteen days is the practical working window for most games. Play Console’s calculator estimates time to completion from your traffic and settings, and experiments stop automatically after six months. Lower-traffic games and smaller target effects need considerably longer.
What sample size do I need for an ASO A/B test?
There is no universal number. Required sample depends on baseline conversion, audience percentage, variant count, your minimum detectable effect, and your confidence level. Play Console calculates the estimate for you once those are set. If the console says the test needs more data, collect it rather than treating a directional result as a win.
Can I A/B test my mobile game’s icon on the App Store?
Yes. Apple’s Product Page Optimization supports icon, screenshot, and app preview video tests through App Store Connect, with up to three treatments against the original page and a maximum run of 90 days. Apple recommends acting only once a treatment is declared better or worse at 90% confidence.
What can I test in a Google Play store listing experiment?
A default graphics experiment covers your icon, feature graphic, and screenshots in the default listing language. A localized experiment covers those plus your descriptions in up to five languages. You can run up to two variants against the control. App title, category, contact details, and the promo video are not experiment assets.
How does AppFollow help with ASO A/B testing?
AppFollow does not run store listing experiments — the stores do. It supplies the measurement record around them: Downloads, Page Views, and Impressions split by traffic channel and country, keyword rank movement across 100+ storefronts, review sentiment as an outcome signal, and competitor metadata changes during your test window.