ASO benchmarks 2026: four checks to run before you trust a number

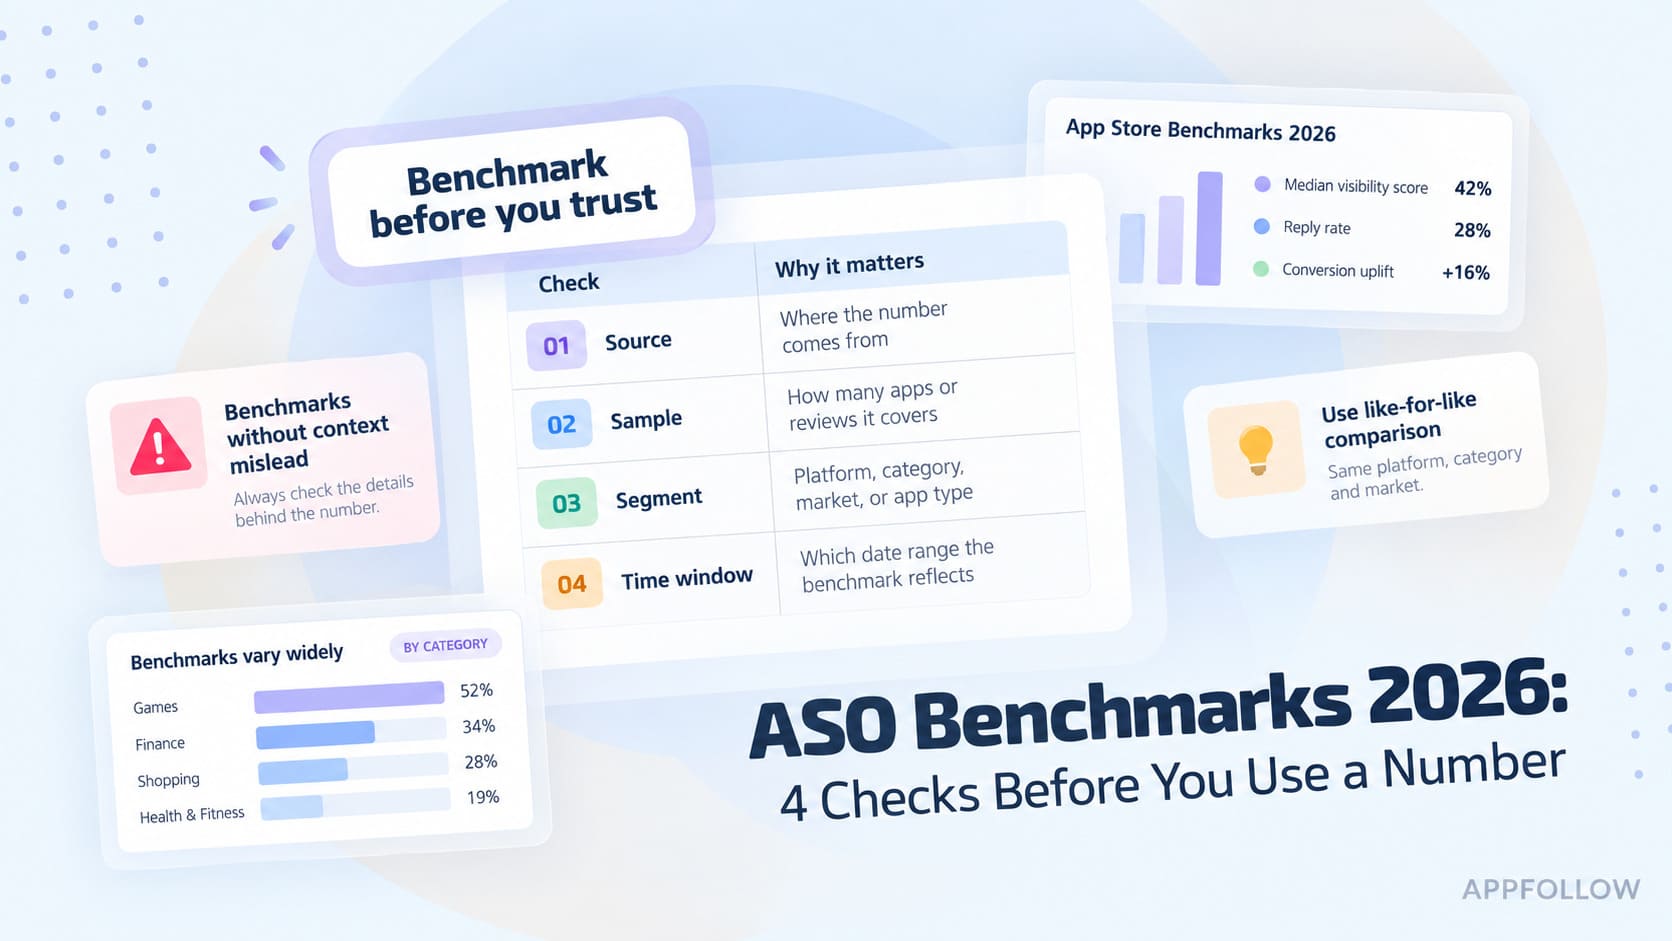
Table of Content:
- Key ASO benchmark findings for 2026
- Which ASO benchmarks should you track?
- Why published ASO benchmarks may not fit your app
- ASO benchmarks by metric: what normal looks like in 2026
- Build a baseline you can defend at the quarterly review
- Three benchmarking mistakes that lead to the wrong fix
- Compare conversion, keyword, and rating gaps on one page
- ASO benchmark FAQs
ASO benchmarks are comparable norms for app-store performance. A useful benchmark matches your metric definition, store, traffic channel, country, category depth, and period.
That match matters when someone asks whether your app’s store performance is good. Published answers often describe different traffic, markets, categories, and dates.
A category median becomes useful only after those fields match your app. Otherwise, the comparison can send budget toward the wrong constraint.
This guide covers visibility, conversion, and reputation benchmarks. You will get four rejection checks, current 2026 ranges, and a reusable baseline worksheet. It also shows when a rating gap should change a conversion diagnosis.
The result is a defensible answer to one follow-up question: good compared with what?
Key ASO benchmark findings for 2026
These app store optimization benchmarks combine a live AppFollow conversion data pull, Apple’s first-party guidance, and AppFollow’s worldwide reputation report.
- In August 2026, U.S. App Store Search category medians ranged from 2.6% for Games to 12.4% for Food & Drink.
- App Store Browse medians ranged from 0.1% to 2.5% across top-level U.S. categories during the same month.
- App Referrer category medians ranged from 4.5% to 53.0%; Web Referrer medians ranged from 4.0% to 75.1%.
- Apple reports 25th, 50th, and 75th percentiles for eight App Store metrics, using privacy-protected peer groups.
- The App Reputation Benchmarks 2026 report covers 92.9 million reviews of 20,700 apps in 13 industries from July 2025 to July 2026.
- Across that reputation dataset, the market answered 24.5% of reviews, while apps using AppFollow for review management answered about 41%.
- Industry ratings averaged 3.77–4.36. Reply rates ranged from 9% to 51%, and reply times from 43.3 to 204.2 hours.
- A rate above 100% can occur when downloads use product page views as the denominator.
Which ASO benchmarks should you track?
An average summarizes a dataset. A benchmark becomes a decision tool after you prove that its comparison group matches your operating conditions.
Use the same metric definition, store, channel, country, category depth, and measurement period. If one field differs, record the difference before interpreting the gap.
When someone asks what metrics matter most in ASO, start with three families: visibility, conversion, and reputation. Each answers a different diagnostic question.
- Visibility asks whether enough relevant shoppers can find the listing. Useful measures include keyword positions, search visibility, category rank, top-chart position, and impressions. Compare keyword coverage against named competitors in the same country, rather than seeking a universal visibility average.
- Conversion asks whether exposed shoppers move toward an install. Track conversion to install, impressions to product page views, and product page views to installs. Subscription apps may continue through download, trial, and paid conversion, but those later steps need separate denominators.
- Reputation asks what prospective users encounter before deciding. Track star rating, review volume, sentiment, reply rate, and reply time. Split every comparison by store because review behavior and sentiment differ between the App Store and Google Play.
Build each family from a frozen comparison set. For visibility, hold the keyword list, countries, device, and competitor group constant. For conversion, preserve the source type and traffic channel. For reputation, compare the same store, rating window, and review cohort.
Track the current level beside its change from the previous period. A healthy level with a sudden decline still needs investigation, even when it remains above median.
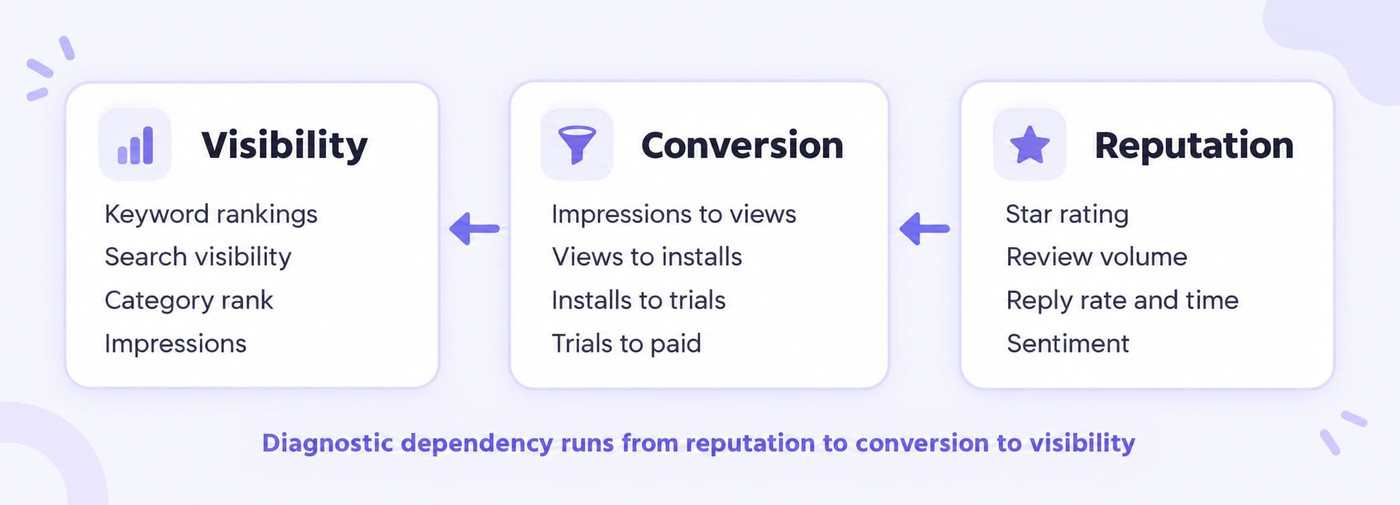
Read the relationship from right to left during diagnosis. Weak ratings or repeated complaints can depress listing confidence and conversion. Lower conversion can then reduce the return from strong keyword positions and impressions.
A conversion gap therefore needs a reputation check before anyone commissions new screenshots. The same logic prevents a visibility team from chasing more traffic toward a listing that already loses qualified visitors.
“There’s a metric most teams underweight: review recency.” Veronika Bocharova, Customer Success Manager at AppFollow, makes that point in AppFollow’s 2026 ASO metrics guide. That is why reputation belongs beside conversion: a healthy lifetime rating can hide a recent decline that shoppers see first.
Use the full ASO metric set only when you need acquisition, engagement, monetization, and retention measures beyond this diagnostic.
Why published ASO benchmarks may not fit your app
The question “What is a good App Store conversion rate?” has no defensible answer until four fields match. Check the denominator, channel, market, and collection period before borrowing any figure.
Why some conversion benchmarks exceed 100%
Two formulas often appear in one column labeled conversion rate. Downloads divided by unique device impressions measures exposure-to-install conversion. Downloads divided by product page views measures page-to-install conversion.
Apple defines conversion rate as total downloads and pre-orders divided by unique device impressions. Product page views use a smaller denominator because many users install directly from search results.
That second formula can exceed 100%. Adapty’s widely republished category table lists Navigation at 115% and explains direct search installs. The figure describes downloads per page view, so comparing it with downloads per impression creates a false gap.
Before using any number, locate its numerator and denominator. If either is missing, exclude the source from your review. See how conversion is defined before aligning exports from different tools.
Metric definition | Denominator | August 2026 U.S. top-level category median range | What it answers | Common misuse |
|---|---|---|---|---|
App Store Search installs | Unique device impressions | 2.6% to 12.4% | How often search exposure becomes an install | Compared with page-view conversion |
App Store Search page views | Unique device impressions | 3.3% to 10.8% | How often search exposure opens the listing | Treated as install conversion |
App Store Browse installs | Unique device impressions | 0.1% to 2.5% | How often browse exposure becomes an install | Blended with high-intent search traffic |
App and web referrer installs | Product page views | 4.0% to 75.1% | How often referral page visits become installs | Read as impossible when it exceeds 100% |
Four conversion definitions and what each one is for. Source: AppFollow Conversion Benchmark, U.S. App Store, August 2026.
How channel mix hides the real performance gap
Search, Browse, App Referrer, and Web Referrer begin with different intent. Their conversion rates should therefore be reviewed separately.
Use AppFollow to split conversion by channel, country and store. A search-heavy app should not inherit a category average dominated by web referrals.
A mobile app subscription conversion rate benchmark starts even later in the funnel. Match download-to-trial and trial-to-paid figures by acquisition channel, offer, market, and cohort date.
“The most common mistake we see is teams changing multiple things at once and celebrating the lift.” The warning comes from Ilia Kukharev, Product Manager at AppFollow, in AppFollow’s gaming ASO testing guide. A blended channel average creates the same attribution problem. Separate Search, Browse, App Referrer, and Web Referrer before deciding what to fix.
How country and category depth change the comparison
Country-level demand, pricing, brand recognition, and creative conventions can move the result. Pull benchmarks for the markets that produce your installs.
Use the deepest reliable category available. A top-level Games norm hides material differences among Casino, Puzzle, Racing, and Strategy apps. Check category benchmarks by country, then document any broader fallback used because a subcategory lacked data.

Check the data date, not the article date
Several pages published during 2026 still repeat figures collected during H1 2024. A recent publication date does not refresh an older sample.
Record the collection month beside every benchmark. Prefer live or regularly refreshed sources, and keep older figures only when you need historical context.
ASO benchmarks by metric: what normal looks like in 2026
Conversion ranges below come from AppFollow’s public U.S. App Store tables for August 2026, preserving each channel’s denominator. Reputation figures come from AppFollow’s worldwide July 2025–July 2026 report of about 92.9 million reviews across 20,700 apps in 13 industries. Apple’s privacy-protected peer groups provide directional App Store context, not exact competitor rankings.
Conversion to install
Use a range because category medians vary with traffic intent. In August 2026, U.S. App Store Search medians spanned 2.6% to 12.4% across top-level categories. Browse produced a lower 0.1% to 2.5% range.
A single average app install conversion rate would conceal that spread. Pull your category’s conversion benchmark, then match the country, channel, store, and month.
The public table refreshes monthly. AppFollow currently warns that Google Play non-gaming benchmark data is temporarily unavailable. Document that gap instead of substituting App Store data.
Interpret the comparison with your own impressions. Below-median conversion with normal impressions points toward listing friction; median conversion with weak impressions points toward visibility.
Apple offers another baseline through percentile benchmarks inside App Store Connect. Use its 25th, 50th, and 75th percentiles for App Store context, then add channel detail separately.
Keyword and category visibility
Visibility has no trustworthy public category average. Benchmark your keyword footprint against three to five direct competitors in each priority country.
Use one tracked keyword set and compare shares in Top 1, Top 5, Top 10, and Top 50. Keep branded terms separate because they can make a weak generic footprint look healthy.
AppFollow tracks Popularity, Difficulty, Keyword Effectiveness Index, and Search Visibility Score. Its competitor view groups keyword footprints by ranking bucket, which makes gaps visible without inventing an industry norm.
Track category rank and top-chart position alongside keyword coverage. Those measures explain discovery from different surfaces and should never be collapsed into one score.
Star rating and review volume
AppFollow’s worldwide industry table puts Productivity at the top with a 4.36 average rating. Auto & Vehicles and Social share the lowest average at 3.77. The 13 rows cover leading apps by review volume and combine Apple App Store and Google Play data.
That range is useful for locating an industry, not for setting a universal rating target. Start with your industry’s row, then split your own rating distribution by store, country, app version, and period. The public report does not provide those country-level cuts, so any local target needs first-party data beside it.
Rating and conversion gaps often require one investigation. Compare the one-star share, recurring review themes, affected versions, markets, and rating movement before assuming creatives caused the conversion shortfall.
“Usually, the worst comments give you a clue about what’s wrong with the app.” Ilia Kukharev, Product Manager at AppFollow, explains this in his rating and conversion guide. That guide points to release-specific crashes, server failures, and broken functionality. Group recent one-star reviews by version, country, and issue before commissioning new creative.
The source is AppFollow’s App Reputation Benchmarks 2026. Its methodology states the sample, period, stores, industry grouping, and selection rule. It also separates the full market from AppFollow’s client subset.
Reply rate, reply time, and sentiment
The report’s summary gives 24.5% as the share of reviews answered across the whole market dataset. Apps that run review management through AppFollow answered about 41%.
Reputation benchmark | Published result | Scope | Safe interpretation |
|---|---|---|---|
Dataset | 92.9M reviews; 20,700 apps | 13 industries; worldwide; both stores; Jul 2025-Jul 2026 | Use for industry context, then add store and country cuts from first-party data |
Overall reply rate | Market 24.5%; AppFollow clients about 41% | Client apps are a subset of the market | Evidence of different response coverage, not causal product impact |
Industry reply rate | 9% to 51% | Social to Finance | Compare with the exact industry row |
Industry reply time | 43.3 to 204.2 hours | Finance to Education | Review beside coverage and backlog age |
Industry rating and sentiment | Rating 3.77-4.36; sentiment 48.5-74.8 | Industry averages across both stores | Diagnose rating distribution and review text separately |
Reply effect | -0.578 to 1.393 rating points | Education to Health & Sports | Association after a reply; sample and selection can affect the result |
Worldwide reputation benchmarks from AppFollow’s App Reputation Benchmarks 2026, covering July 2025 to July 2026.
Those groups are not independent. The market figure already includes AppFollow clients, which are a subset of the tracked apps. The comparison shows an operational association. It does not establish an experimental uplift. The report notes that a pure non-client comparison would show a slightly wider gap.
There is also a small aggregation warning worth recording. The report shows 24.5% for the whole set but labels 24.2% as the average reply rate beside its industry chart. The report does not publish the weighting formula for those two aggregates. Use the exact industry row in planning instead of reconciling them into one target.
Finance had the highest industry reply rate at 51%; Social had the lowest at 9%. Reply time ran from 43.3 hours in Finance to 204.2 hours in Education. Read the two metrics together. A fast average can reflect selective replies, while broader coverage can pull older reviews into the response-time average.
The report’s reply-effect metric tracks rating changes after a developer response. Health & Sports showed the largest positive market result at 1.393 rating points, while Education was -0.578. The report attributes negative values cautiously to the reviews that trigger replies and to small covered samples. Treat the metric as an association that helps prioritize an investigation, not proof that a reply caused a rating change.
Read reply time with volume and coverage. A fast median can hide a large untouched backlog, while selective replies can exclude difficult complaints.
Build a baseline you can defend at the quarterly review
The strongest ASO benchmarks fit on one working page. Build yours in four steps, then preserve the sources beside each number.
- Fix definitions before pulling data. Write the numerator, denominator, store, countries, channels, and date range for each metric. Record these fields before extraction so later exports can be reconciled.
- Pull first-party numbers at the deepest available level. Split App Store Connect and Google Play Console data by country and channel, not at the account rollup. Fill remaining discovery gaps with free ASO tools.
- Choose two comparison sets. A category norm answers whether performance is typical. A named competitor set shows whether you are losing ground. Use the Conversion Benchmark for the first, then track the same keyword set across competitors for the second.
- Write every gap as a decision. Record the likely constraint, planned action, owner, and verification date. A benchmark without a decision belongs in an appendix, not the quarterly plan.
“Most teams we onboard track dozens of metrics and actively use only a handful.” Ilia Kukharev, Product Manager at AppFollow, makes that tradeoff explicit in his 2026 ASO metrics guide. Keep metrics that predict a decision, and drop decorative coverage.
Copy this worksheet and replace every illustrative value with a matched source. The likely-constraint and owner columns prevent the table from becoming a decorative scorecard.
Metric | Our figure | Source and period | Matched benchmark | Gap | Likely constraint | Action | Owner |
|---|---|---|---|---|---|---|---|
Search installs per impression | 4.8% | App Store Connect, U.S., Aug 2026 | 6.4% | -1.6 pp | Listing relevance | Review search creative by keyword theme | ASO lead |
Browse installs per impression | 0.7% | App Store Connect, U.S., Aug 2026 | 0.9% | -0.2 pp | Featuring fit | Compare featured cohorts and creative | Growth analyst |
Generic keywords in Top 10 | 18% | Keyword tracker, U.S., Sep 2026 | 27% competitor median | -9 pp | Metadata coverage | Test one missing semantic cluster | ASO lead |
Store rating | 3.9 | Store console, Sep 2026 | 4.2 category median | -0.3 | Product complaints | Group one-star themes by version | Product manager |
Reply rate | 31% | Review export, Sep 2026 | 40% internal target | -9 pp | Queue coverage | Route billing and crash reviews | Support lead |
Median reply time | 28 hours | Review export, Sep 2026 | 24-hour service level | +4 hours | Weekend backlog | Add weekend triage rule | Support operations |
A benchmark baseline worksheet filled with an illustrative app. “pp” means percentage points.
How to read the example: Search conversion trails the matched median by 1.6 percentage points, while rating trails by 0.3. Because both gaps share the U.S. market and period, the team checks one-star themes by version before changing creative. If the rating issue is release-specific, product owns the first fix. If conversion stays low afterward, the ASO lead runs the listing test.
Use different cadences for different signals. Review ratings, replies, and material keyword movement weekly. Refresh conversion monthly and revisit external category norms quarterly. That rhythm catches operational changes without turning every fluctuation into a project.
cta_get_started_purple
Three benchmarking mistakes that lead to the wrong fix
Benchmarking against a blended average
This happens because the easiest figure lacks channel detail. The warning sign is stable conversion beside flat installs.
A team may spend a quarter refreshing creatives because its benchmark blends Search with paid web referrals. Rebuild the baseline with per-channel benchmarks before approving creative work. Answer every request for a good rate with the matched channel and denominator.
Verify the comparison against one complete month with the same source filters. If the apparent gap disappears after the channels are separated, cancel the unnecessary creative project.
Treating a benchmark as a target
A number in a planning slide invites an OKR beside it. “Reach the category average” then replaces a real competitive goal.
App store optimization benchmarks describe distributions, including weak performers. Choose the percentile you intend to occupy and add named competitors. The median can be a diagnostic threshold, but it should not become an automatic ceiling.
Translate the chosen percentile into a business guardrail. Record why that position matters and which tradeoff prevents endless optimization. When percentiles are unavailable, use a competitor range and label the limitation.
Benchmarking conversion while ignoring reputation
Conversion usually sits with ASO, while reviews belong to support. Separate dashboards can make two teams investigate one customer problem twice.
The warning sign is simultaneous rating and conversion gaps with separate owners. Put conversion, rating, reply rate, and recurring review themes on one page. Use the matching industry row from App Reputation Benchmarks 2026 to frame the diagnostic. Then assign one investigation before two workstreams begin.
Join the records by country, app version, and date. Shared movement across those fields supports a joint investigation. Divergent movement sends each team back to its own constraint.
The correction is operational, not cosmetic. One owner should verify whether the affected version, market, and complaint cohort overlaps the conversion decline. Only then should the team choose product fixes, review responses, or listing experiments.
Compare conversion, keyword, and rating gaps on one page
Your benchmark page needs matched comparisons across conversion, visibility, and reputation. AppFollow brings those views together across stores, countries, and traffic sources, while Apple peer groups remain App Store-only.
Start with one app, one category, one country, one channel, and the most recent complete month. Compare the app’s conversion line with the matching category line.
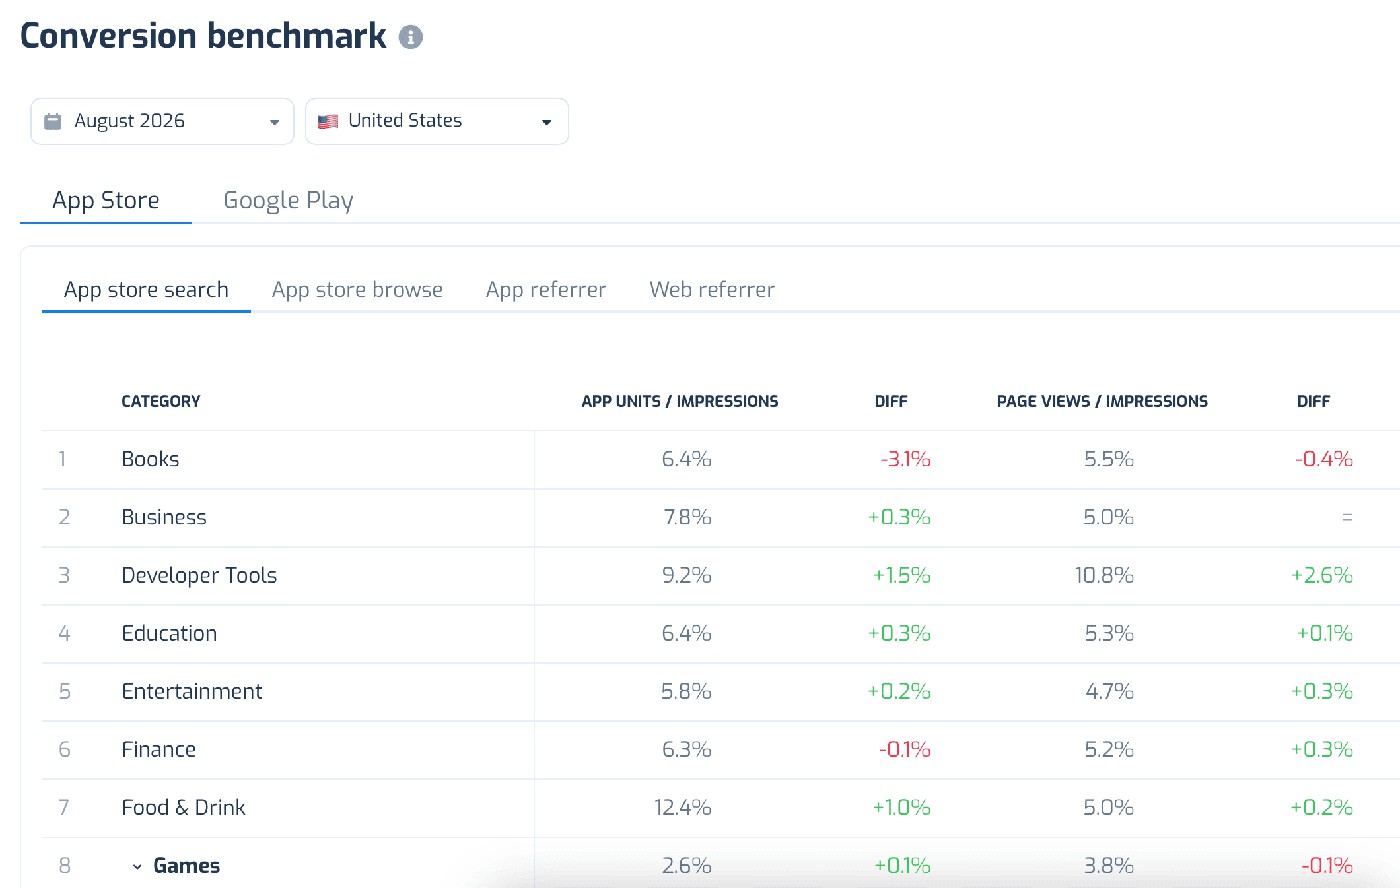
A below-benchmark result with normal impressions directs attention toward the listing. A matched conversion result with weak impressions redirects the next investigation toward visibility.
Three AppFollow capabilities support that review:
- Conversion Benchmark provides category rates by store, country, and channel. AppFollow updates the data monthly for major countries.
- Keyword tracking and Search Visibility Score compare tracked terms across countries and stores. Competitor footprints use Top 1, Top 5, Top 10, and Top 50 buckets.
- Review and reputation analytics place ratings, review volume, replies, reply time, and sentiment together across supported stores.
The public Conversion Benchmark works without an account. Account views sit under Store Analytics. Search-download attribution requires connecting App Store Connect or the Google Play ASO console.
Current plan availability still requires product-team confirmation before publication.
cta_get_started_yellow
ASO benchmark FAQs
What is a good ASO benchmark to start with?
Start with conversion to install for your primary category, country, store, and channel. It helps separate listing friction from weak traffic volume.
Add search visibility and rating next. Those measures show whether qualified users reached the page and what social proof shaped their decision.
What is a good App Store conversion rate?
There is no reliable universal rate. A useful figure matches your denominator, category depth, country, channel, store, and measurement period.
Use your category and country as the first comparison. Then compare the same channel and month with your own prior periods.
Why do published conversion benchmarks disagree?
They often use different denominators, traffic sources, countries, category levels, and collection dates. One table may measure downloads per impression, while another uses product page views.
Check those five fields before comparing values. If the source omits its denominator or sample period, exclude it from decision-making.
Can a conversion rate really exceed 100%?
Yes, when downloads use product page views as the denominator. Users may install directly from search results without opening the listing.
That makes downloads higher than recorded page views for some categories. It does not make impression-based conversion exceed normal mathematical limits.
Do App Store Connect benchmarks cover Google Play?
No. Apple’s peer group benchmarks cover the App Store and show 25th, 50th, and 75th percentile values.
Add Google Play Console data and a cross-store benchmark source for Android comparisons. Keep the store split visible because traffic and sentiment patterns differ.
How often should ASO benchmarks be refreshed?
Review ratings, reply coverage, and urgent keyword shifts weekly. Refresh conversion monthly because traffic mix and creative changes need enough volume.
Revisit external category norms quarterly, or after a major market change. Record each sample date so older numbers remain recognizable.
Pick the metric with the largest matched gap. Name its likely constraint, assign an owner, and define what would disprove the diagnosis.
The Conversion Benchmark is the fastest starting point for category, country, store, and channel comparisons. Carry that result into the same worksheet as visibility and reputation before funding the next quarter.