Mobile Game KPIs: The 2026 Guide to Gaming Metrics That Predict Growth

Table of Content:
- Key insights: what gaming metrics actually predict success
- All 14 mobile game KPIs at a glance — comparison table
- Engagement KPIs
- Monetisation KPIs: ARPU, ARPPU, ARPDAU, conversion, and LTV
- Retention KPIs
- User Acquisition KPIs Gaming Companies Live and Die By
- Game Telemetry — the Raw Data Behind Every KPI
- How to Interpret Mobile Game KPIs (Without Misreading Them)
- How AppFollow Complements Your Game Analytics Stack
Most studios track more than 30 mobile game KPIs, yet product decisions, monetisation changes, and user acquisition budgets often come down to three or four numbers on a dashboard. A long list of gaming metrics looks impressive. Knowing which ones predict growth is what actually matters.
Open almost any analytics platform, and you'll find hundreds of data points tied to player behaviour, retention, revenue, and the in-game economy. Not all of them deserve equal attention. A rising ARPU can hide a shrinking payer base. Strong install volume means very little if Day-30 retention is collapsing. Chasing lower CPI rarely ends well when the players you acquire never become valuable users.
That's why successful mobile gaming teams focus on a small set of metrics that connect acquisition, engagement, retention, and monetisation. Every benchmark report tells a slightly different story, but they all point in the same direction. Optimizing one KPI rarely changes the trajectory of a game on its own. Growth comes from understanding how the metrics work together.
This guide breaks down 14 mobile game KPIs, grouped by category, with formulas, benchmarks, interpretation tips, and a comparison table you can reference quickly. You'll also learn how game telemetry fits into the picture, how to avoid common measurement mistakes, and where AppFollow complements your analytics stack. If you're looking for ASO metrics, those belong to the store side of the funnel. This guide covers what happens after the install.
At a glance: acquisition KPIs bring players in, engagement and retention KPIs reveal whether they stay, and monetisation KPIs determine whether your game can grow profitably.
Key insights: what gaming metrics actually predict success
Not all gaming metrics carry the same decision-making value. Some tell you what's happening today. Others give you an early signal about where revenue, retention, or growth will be a month from now. The most useful mobile game KPIs help you identify future outcomes before they show up in the dashboard.
- Revenue forecasting: ARPDAU + LTV
- Player engagement: Day-1 retention + session length
- Monetization health: ARPPU + first-purchase conversion rate
- Long-term player health: Day-30 retention + churn rate
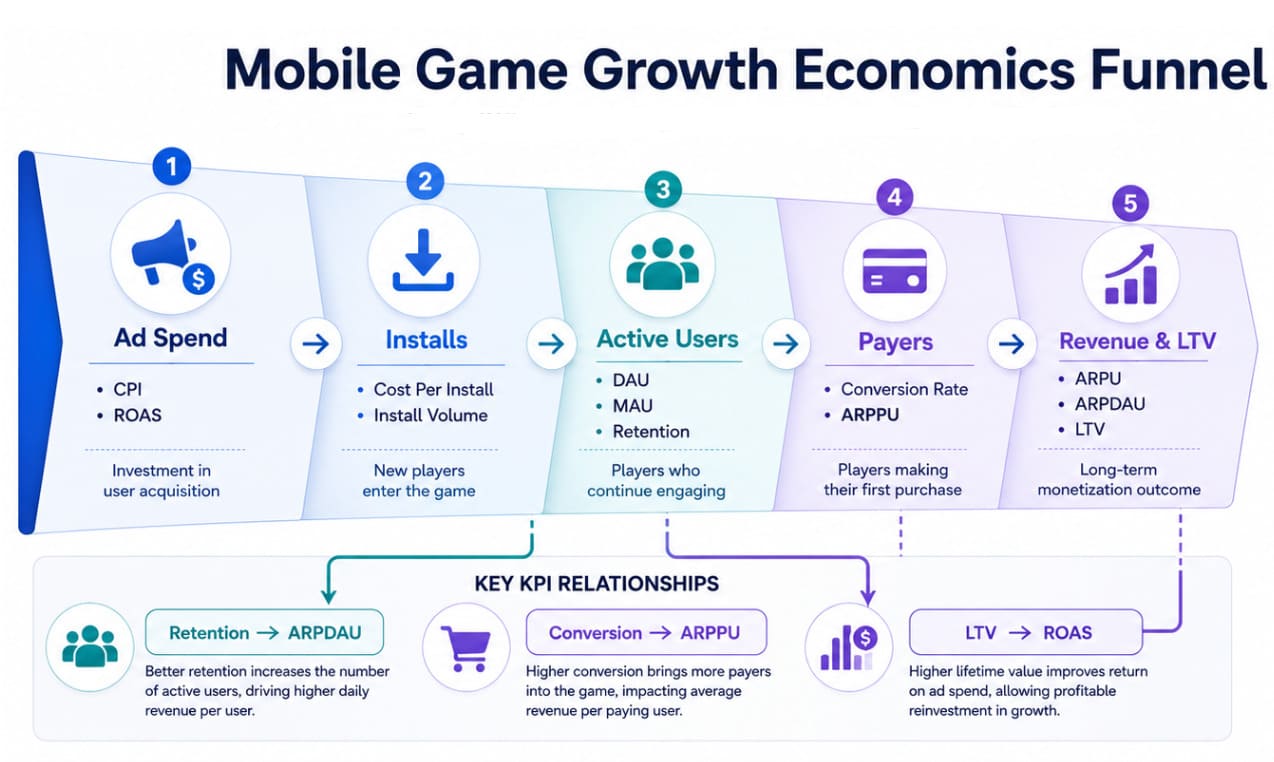
- Acquisition efficiency: ROAS + CPI
- Product-market fit: DAU/MAU stickiness ratio + K-factor
Think of these as a chain rather than a checklist. Players engage before they spend, and they have to stay before lifetime value has a chance to grow. Monetisation affects LTV. LTV determines how aggressively you can acquire users. Looking at any metric without understanding those relationships often leads to poor decisions.
Here are the mobile game KPIs that matter most:
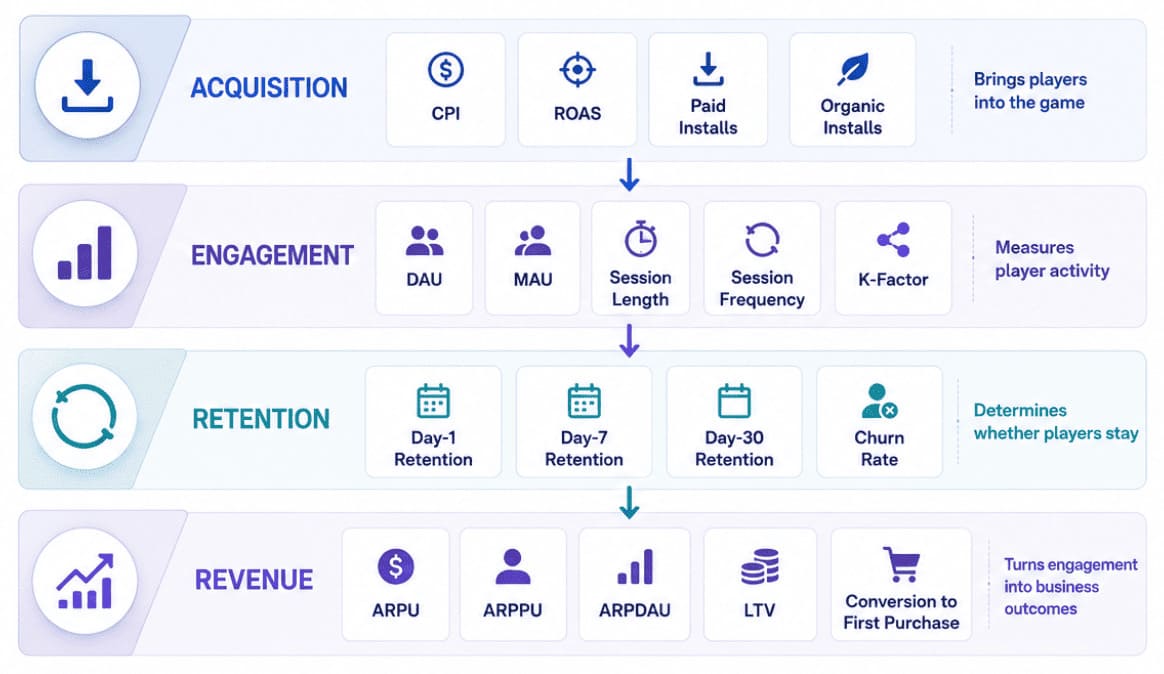
The benchmarks below provide useful context, but genre always matters. Casual, mid-core, and hardcore games operate under very different engagement and monetisation dynamics.
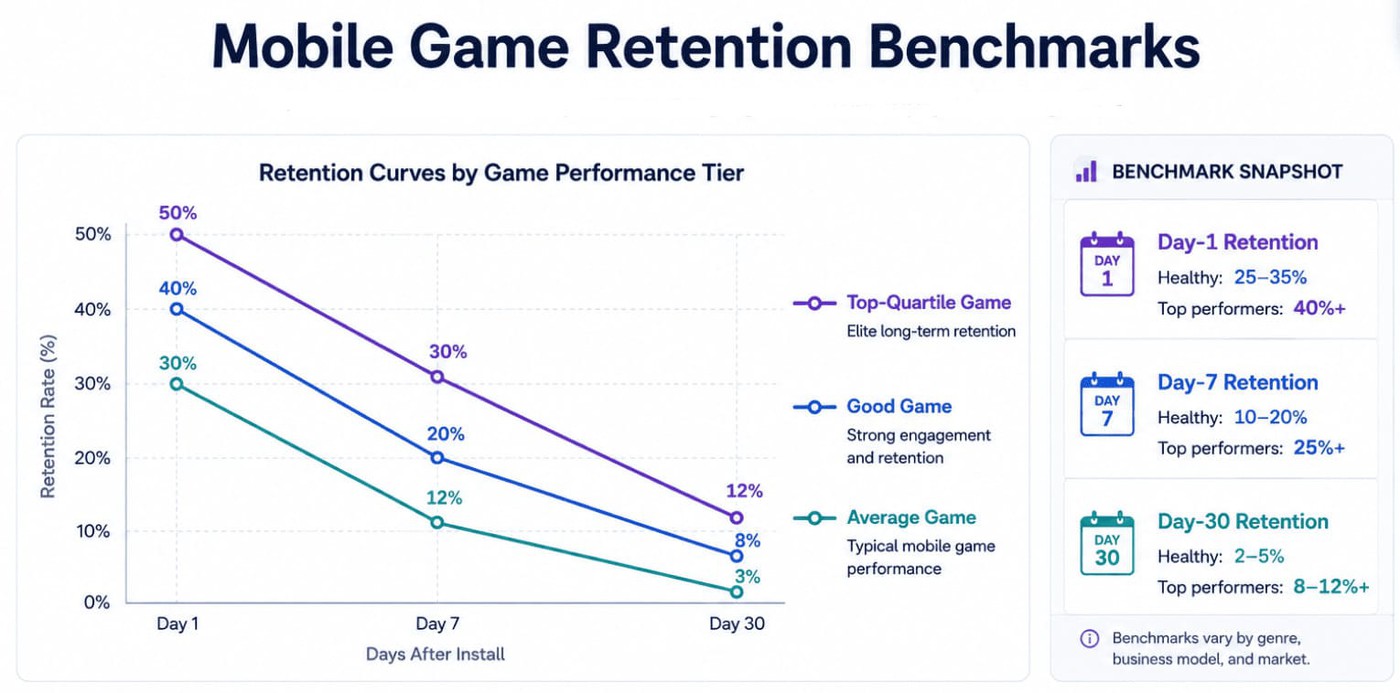
- Median Day-1 retention across mobile games is roughly 25–35%; top-quartile games often reach 40–50%.
- Day-30 retention typically falls between 2–5%; leading titles can sustain 8–12%.
- Fewer than 5% of players ever make an IAP, yet those users generate more than 80% of revenue in many games.
- Spending patterns look very different depending on the genre. Casual games often see ARPPU in the $10–30 range, while mid-core titles can reach $50–100. In top-performing gacha games, monthly ARPPU may climb well beyond $100.
- Session length follows a similar pattern. Hyper-casual games usually keep players engaged for only a few minutes at a time, whereas strategy and RPG titles often stretch well past the 8–15 minute industry median.
- Stickiness tells another part of the story. A DAU/MAU ratio above 0.20 is generally considered healthy, while many of the strongest-performing games push beyond 0.40, according to recent industry benchmarks from Sensor Tower.
- LTV ranges from a few cents in ad-driven games to more than $20 in leading gacha titles. What matters most is maintaining a healthy LTV-to-CPI ratio.
"The first thing we ask any game studio onboarding with us is which three KPIs they review every morning. Nine times out of ten, DAU is one of them. ARPDAU and Day-1 retention usually deserve more attention because they're often the earliest indicators of whether growth is sustainable. Watch the inputs that create the outcome, not just the outcome itself."
— Ilya Kataev, Professional Services Team Lead
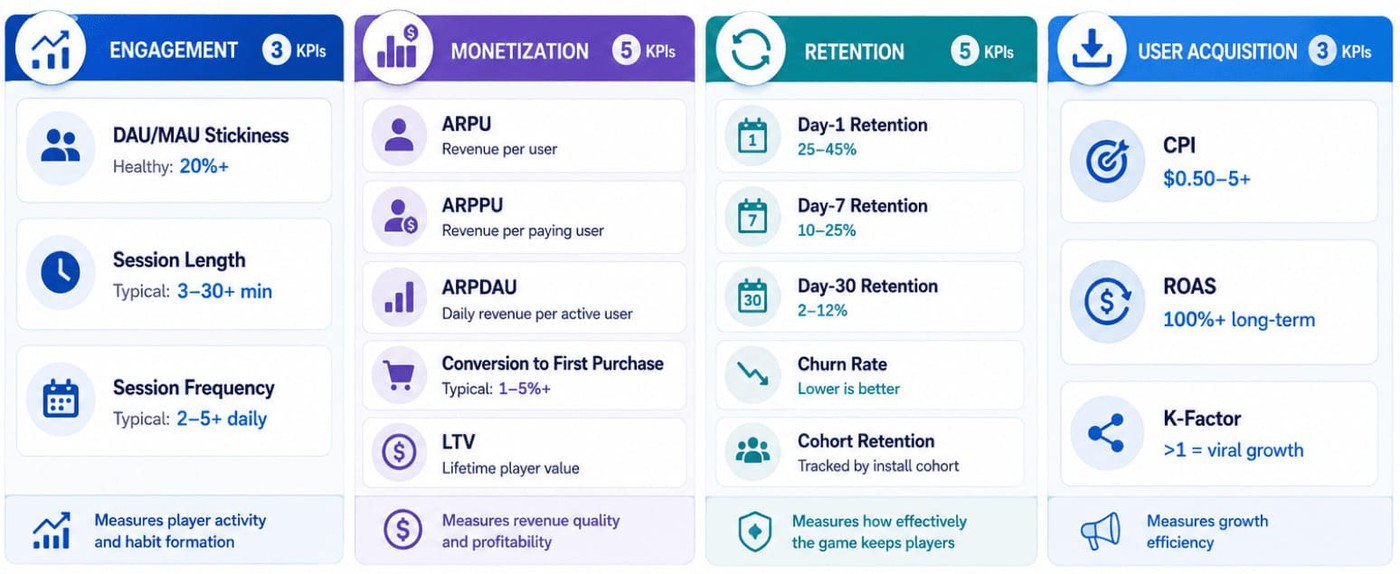
All 14 mobile game KPIs at a glance — comparison table
Before diving into each KPI, here's the full picture. These gaming metrics cover four areas that determine whether a game can attract players, keep them engaged, generate revenue, and scale efficiently.
Most teams track 5–7 metrics daily and review the rest weekly or monthly. The goal is not to monitor every possible kpi game indicator. If you're the kind of person who likes to see everything before digging into the details, this table is a good place to start.
Keep it handy as you work through the rest of the guide or come back to it when you need a quick reminder of what each KPI measures.
Benchmark note: Unless otherwise stated, the benchmark ranges throughout this guide are compiled from recent mobile gaming research published by AppsFlyer, Sensor Tower, Newzoo, GameAnalytics, and other industry sources. Actual performance varies by genre, platform, geography, monetization model, attribution methodology, and game maturity. Treat these figures as directional benchmarks, not universal targets.
KPI | KPI Category | Formula (Short) | Benchmark Range | Best For |
DAU/MAU Stickiness | Engagement | DAU ÷ MAU | 0.20+ healthy • 0.40+ top tier | Daily player habit |
Session Length | Engagement | Total Session Time ÷ Sessions | 3–30+ min | Time spent per session |
Session Frequency | Engagement | Sessions ÷ DAU | 2–5+ daily | How often players come back |
ARPU | Monetisation | Revenue ÷ Users | Genre-dependent | Revenue per player |
ARPPU | Monetisation | Revenue ÷ Paying Users | $10–100+ | Spending by paying players |
ARPDAU | Monetisation | Daily Revenue ÷ DAU | $0.05–0.50+ | Daily revenue trend |
Conversion to First Purchase | Monetisation | First-Time Payers ÷ Users | 1–5%+ | First purchase conversion |
LTV | Monetisation | Lifetime Revenue ÷ Users | Should exceed CPI | User acquisition profitability |
Day-N Retention (D1/D7/D30) | Retention | Returning Users ÷ Cohort | D1: 25–45% • D30: 2–12% | Returning players |
Churn Rate | Retention | Lost Users ÷ Users | Lower is better | Player churn |
Cohort Retention | Retention | Retention by Install Cohort | Genre-dependent | Compare player cohorts |
CPI | User Acquisition | Ad Spend ÷ Installs | $0.50–5+ | Cost to acquire players |
ROAS | User Acquisition | Revenue ÷ Ad Spend | 100%+ at payback | Ad campaign payback |
K-Factor | User Acquisition | Invites × Conversion Rate | >1 indicates viral growth | Organic growth potential |
Engagement KPIs
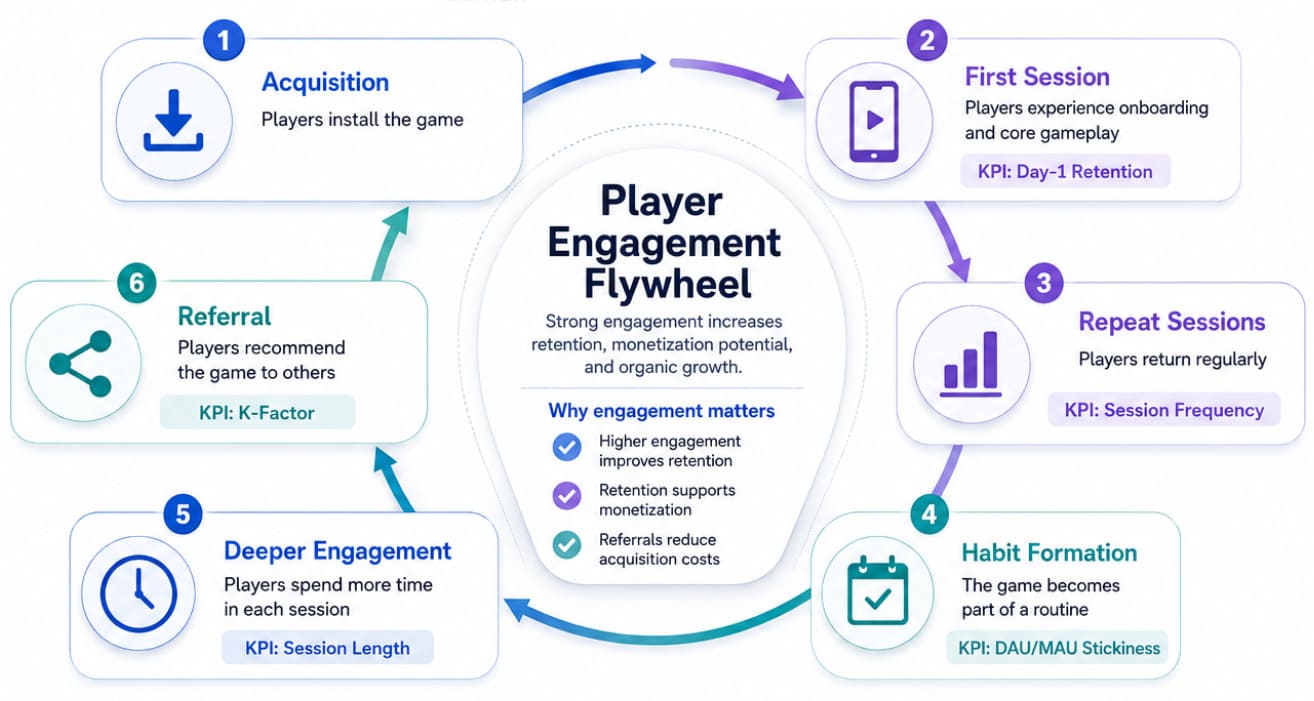
Engagement KPIs answer a simple question: are players coming back, and are they playing while they're here? These mobile game performance metrics sit near the top of the growth funnel because they influence almost every revenue outcome that follows. Retention starts with engagement. Monetisation depends on engagement. Even referral loops become stronger when players enjoy spending time in the game.
A title with weak engagement can generate installs, run LiveOps events, and launch new content, yet still struggle to grow. That's why many of the most important gaming metrics focus on player activity before they focus on revenue.
DAU/MAU stickiness ratio
Best for: Measuring product-market fit and player habit formation.
Definition: Think of stickiness as a quick way to answer one question: How many of your monthly players come back today? By comparing DAU with MAU, you can see whether your game is becoming part of a player's routine instead of something they open only occasionally. Some studios also track WAU to fill in the picture between daily and monthly activity.
Formula: DAU ÷ MAU
Industry benchmark: A ratio above 0.20 is generally considered healthy. Top-performing games often exceed 0.40. Casual titles frequently sit closer to 0.10-0.15.
Pros: It's one of the fastest health checks you can run. Because the ratio isn't tied to audience size, it's useful whether your game has ten thousand active players or ten million. | Cons: A high stickiness score doesn't tell you what happened after players opened the game. Someone who logs in for thirty seconds counts exactly the same as someone who spends an hour playing. Large MAU numbers can also hide churn. |
Session length
Best for: Designing pacing, content cadence, and monetisation moments.
Definition: Session length tells you how much time players spend during each visit. I usually read it alongside retention because long sessions only matter if players actually come back for another one.
Formula: Total session minutes ÷ Total sessions
Industry benchmark: Hyper-casual games often average 3-6 minutes per session. Casual games commonly fall between 8 and 12 minutes. Mid-core titles reach 15-25 minutes, while hardcore games may exceed 30 minutes.
Pros: Longer sessions usually create more opportunities for ads, purchases, and progression, so the metric often moves in the same direction as monetization. | Cons: More minutes aren't always good news. Players can spend longer in a game because they're enjoying it, but they can also get stuck, lost, or frustrated. |
Session frequency
Best for: Understanding habit cadence and return behaviour.
Definition: While session length tells you how long people play, session frequency tells you how often they come back. That's why LiveOps teams pay close attention to it after launching new events or features.
Formula: Total daily sessions ÷ DAU
Industry benchmark: Casual games typically generate 2-4 sessions per day. Mid-core games often reach 3-5. Hyper-casual titles can exceed five daily sessions.
Pros: Frequent short sessions often signal a healthy habit loop. That makes the metric useful when planning notification timing, daily rewards, or LiveOps schedules. | Cons: Treat spikes with a bit of caution. Aggressive push notifications can inflate session counts without creating genuine engagement, making the game look healthier than it actually is. |
Monetisation KPIs: ARPU, ARPPU, ARPDAU, conversion, and LTV
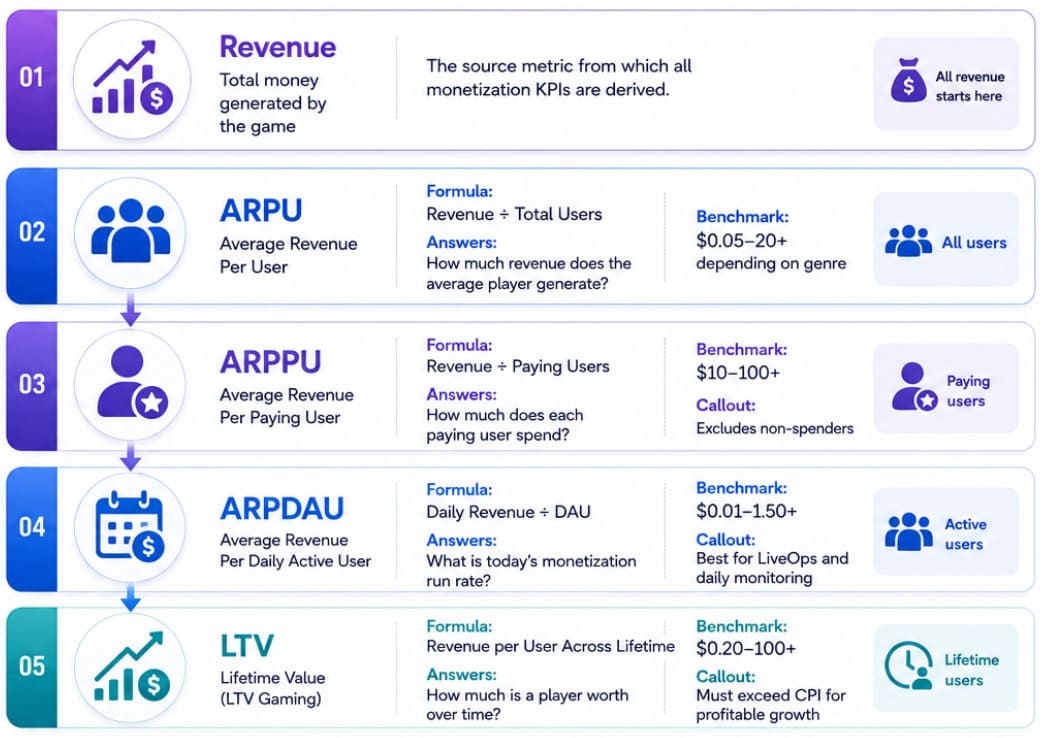
The cluster of ARPU, ARPPU, and ARPDAU metrics answers a straightforward question: how much revenue does each player generate, and over what period?
New teams often confuse these numbers because they look similar on a dashboard. They tell different stories.
- ARPU measures revenue across all users, whether they spend money or not.
- ARPPU focuses only on paying users.
- ARPDAU shows how much revenue your active audience generates on a typical day.
None of these metrics should be viewed in isolation. If you're building a broader mobile game monetization strategy, these KPIs explain whether that strategy is actually improving player value over time. Healthy monetisation depends on understanding how they interact with retention, conversion, and player behavior. The strongest gaming metrics frameworks use all three together.
ARPU — Average Revenue Per User
Best for: Topline revenue, health, and CPI-to-revenue comparisons.
Definition: ARPU spreads your revenue across everyone, including players who never spend a cent. That makes it a useful snapshot of overall monetization, especially when you're comparing revenue against acquisition costs.
Formula: Total revenue ÷ Total active users
Industry benchmark: Hyper-casual games often fall between $0.05–0.30 per month. Casual games commonly range from $0.50–2.00. Mid-core titles may reach $2–8, while gacha and hardcore games can exceed $5–20.
Pros: I usually look at ARPU first when checking whether user acquisition still makes economic sense. It's simple to calculate and easy to compare with CPI. | Cons: The average can be misleading. Two games with the same ARPU may have completely different player economies if one relies on thousands of small purchases and the other on a handful of whales. |
ARPPU — Average Revenue Per Paying User
Best for: Understanding spender behavior and pricing strategy.
Definition: Ignore everyone who never opens their wallet and ARPPU suddenly becomes much more revealing. It tells you how much your paying players actually spend during the period you're measuring.
Formula: Total revenue ÷ Paying users
Industry benchmark: Casual games often range between $10–30 per month. Mid-core titles commonly fall between $50–100. Gacha games frequently exceed $100.
Pros: If you're experimenting with bundles, pricing, seasonal offers, or your in-game shop, ARPPU is one of the first numbers worth checking. | Cons: Bigger isn't always better. Sometimes ARPPU climbs because fewer people are making purchases and the remaining spenders are simply spending more. |
ARPDAU — Average Revenue Per Daily Active User
Best for: Daily revenue monitoring and LiveOps decision-making.
Definition: ARPDAU answers a straightforward question: How much revenue did each active player generate today? Because it updates daily, it's one of the most useful metrics for games that rely on frequent LiveOps events.
Formula: Daily revenue ÷ DAU
Industry benchmark: Hyper-casual games often generate $0.01–0.10. Casual titles frequently range from $0.05–0.50. Mid-core games may reach $0.30–1.50, while top-grossing gacha games can exceed $1.
Pros: Few metrics tell you as quickly whether yesterday's event, offer, or update actually moved the needle. | Cons: Don't panic after one exceptional day. Seasonal events, promotions, or limited-time offers can push ARPDAU up temporarily. Looking at a seven-day average usually gives you a much steadier signal. |

Conversion Rate to First Purchase
Best for: Diagnosing monetisation funnel performance.
Definition: This is where free players become paying customers. The metric measures how many players make their first in-app purchase after installing the game.
Formula: First-time payers ÷ Total installs (or DAU)
Industry benchmark: Most mobile games convert 2–5% of players into payers. Top-performing mid-core games can reach 8–12%.
Pros: It quickly tells you whether the problem sits in user acquisition or in the monetization experience players see after they install. | Cons: A first purchase is only the beginning. This metric won't tell you whether players come back to spend again or disappear after a single transaction. |
LTV — Lifetime Value (LTV gaming)
Best for: User acquisition profitability and long-term planning.
Definition: Lifetime value tries to answer one of the biggest questions in mobile gaming: How much is an average player worth before they leave? Once you know that number, it's much easier to decide how aggressively you can invest in acquiring new users.
Formula: ARPDAU × Average player lifetime (days), or a cohort-based revenue model.
Industry benchmark: Hyper-casual games often range from $0.20–1. Casual titles commonly generate $2–10. Mid-core games may reach $10–30, while leading gacha games can exceed $100.
Pros: Almost every important business decision eventually points back to LTV. It brings together acquisition costs, retention, and monetization in a single number. | Cons: Forecasts are only as good as the assumptions behind them. Small changes in retention or cohort revenue can noticeably change your LTV estimate, especially early in a game's lifecycle. |
"The most common reporting mistake we see is a dashboard where ARPU goes up, and everyone assumes monetisation has improved.
Often, the opposite happened.
Conversion fell, ARPPU increased, and revenue became concentrated among fewer spenders. ARPU, ARPPU, and conversion rate should always be reviewed together because each metric explains a different part of the same story."
— Veronika Bocharova, Customer Success Manager at AppFollow
Retention KPIs
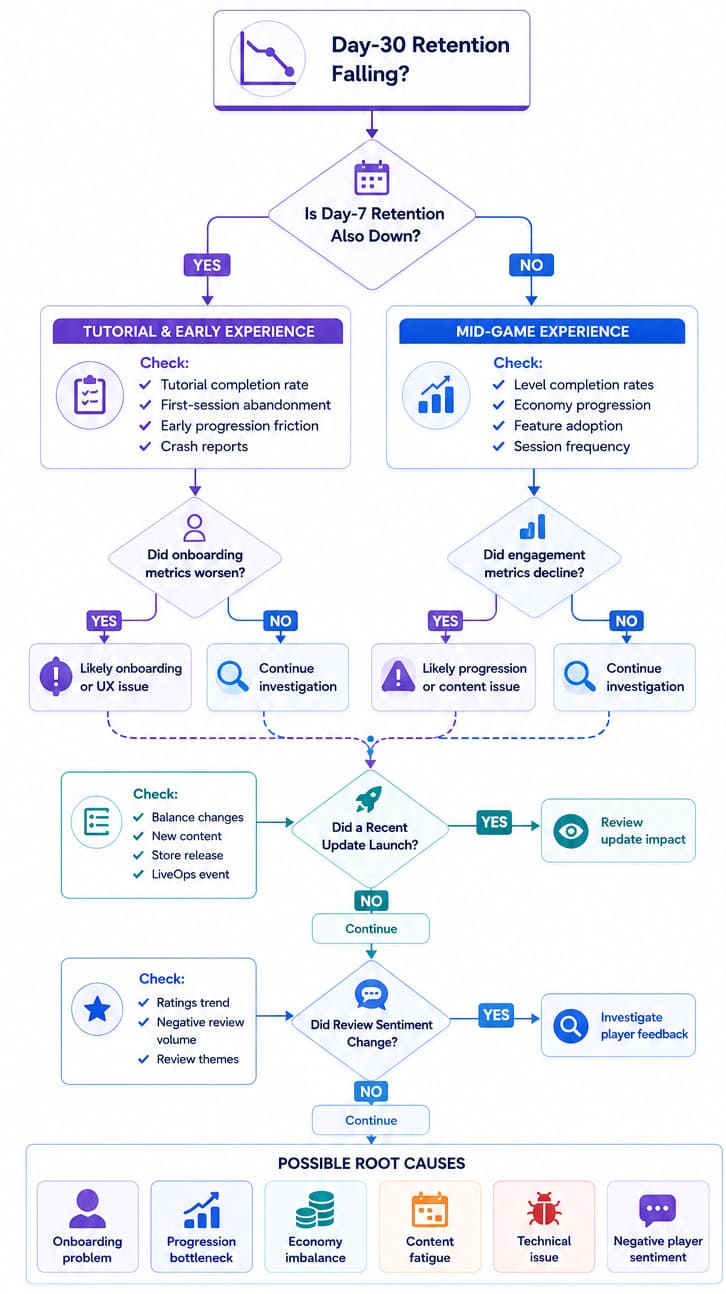
Retention is the most predictive category of mobile game KPIs. A game with strong Day-1 retention but weak Day-7 often has an onboarding or tutorial problem. Strong Day-7 retention paired with weak Day-30 retention usually points to content cadence, progression, or LiveOps issues. Looking at individual checkpoints helps, but the real story sits inside the retention curve itself.
That's why experienced product teams rely on retention more than almost any other group of gaming metrics. Read the curve, not just the points.
Day-N Retention (D1, D7, D30)
Best for: Diagnosing where in the player journey players are dropping off.
Definition: Retention answers one of the first questions every game team asks after launch: Do players come back? Day-1 reflects the first impression, Day-7 shows whether the core loop is working, and Day-30 tells you whether the game is giving people a reason to stick around.
Formula: (Cohort users active on day N) ÷ (Cohort install size) × 100
Industry benchmark: D1 retention typically falls between 25-35%, with top performers reaching 40-50%. D7 often lands around 10-15%, while leading games exceed 20-25%. D30 commonly ranges from 2-5%, with top titles maintaining 8-12%.
Pros: Almost every mobile game tracks these numbers, which makes them easy to compare across genres, markets, and competitors. They're also one of the quickest ways to spot where players begin dropping off. | Cons: Looking only at D1, D7, and D30 can hide what's happening in between. The full retention curve usually explains much more than three checkpoints ever will. |
Churn Rate
Best for: Measuring the health of an established player base.
Definition: If retention tells you who's coming back, churn tells you who's quietly disappearing. It measures the share of active players who stop playing over a given period, making it especially useful once your game has an established audience.
Formula: (Players lost during period) ÷ (Players at start of period) × 100
Industry benchmark: Churn varies significantly by genre and lifecycle stage. Healthy mid-core games often keep monthly churn below 15%, while casual games may tolerate higher levels.
Pros: Mature games often learn more from churn than from installs. A rising churn rate can quickly reveal whether recent updates, LiveOps events, or win-back campaigns are having the intended effect. | Cons: There's no universal definition of a churned player. Some studios use 30 days of inactivity, others 60 or 90. Whatever threshold you choose, stick with it so your trend lines remain meaningful. |
Cohort Retention
Best for: Comparing game performance over time.
Definition: Instead of mixing everyone together, cohort retention follows players who installed during the same week or month. Comparing those groups over time makes it much easier to spot whether a new update, acquisition campaign, or product change actually improved retention.
Formula: Day-N retention calculated within a single install cohort
Industry benchmark: Compare recent cohorts against cohorts from 90, 180, and 365 days ago. Consistent declines often indicate product issues or lower-quality user acquisition.
Pros: Comparing cohorts side by side removes a lot of the noise that builds up in mature games. If newer cohorts consistently outperform older ones, you're probably moving in the right direction. | Cons: Patience helps here. Small cohorts fluctuate more, and meaningful patterns usually emerge over several weeks rather than after a single reporting period. |
cta_get_started_purple
User Acquisition KPIs Gaming Companies Live and Die By
User acquisition KPIs sit at the intersection of marketing and product. They tell you whether the installs you bought are paying for themselves. The biggest mobile game companies review these mobile game KPIs daily, broken down by channel, campaign, and cohort.
The same discipline applies whether you're spending $500 or $500,000 per day. Strong gaming metrics in this category help you decide where to invest, what to scale, and when to pull back.
CPI — Cost Per Install
Best for: Daily UA spend management.
Definition: Every paid acquisition campaign starts with the same question: How much did it cost to bring in each new player? That's exactly what CPI answers. It's usually the first number marketers check before digging into retention or revenue.
Formula: Total ad spend ÷ Installs from paid sources
Industry benchmark: CPI increases substantially as competition and expected player value rise. Hyper-casual games generally have the lowest acquisition costs, while mid-core and gacha titles often pay several times more because higher lifetime value supports larger acquisition budgets. (Source: AppsFlyer State of Gaming App Marketing Report.)
Pros: Few metrics are easier to compare across campaigns. If one channel delivers similar players for a lower cost, CPI usually tells you first. | Cons: Cheap isn't always good. A campaign that delivers inexpensive installs can still lose money if those players never return or make a purchase. |
ROAS — Return on Ad Spend
Best for: Measuring channel-level profitability.
Definition: ROAS answers the question every UA manager eventually asks: Did this campaign pay for itself? It compares the revenue generated by an acquisition cohort with the cost of bringing those players into the game.
Formula: Cohort revenue ÷ Cohort ad spend
Industry benchmark: Industry targets vary widely by genre and business model. Many studios evaluate ROAS at Day 7, Day 30, and Day 90, with user acquisition payback commonly targeted within 90–180 days, depending on player lifetime value and monetization strategy. (Source: AppsFlyer – State of Gaming App Marketing Report)
Pros: It's one of the few metrics that connects marketing performance with business results, making it much easier to decide where the next advertising dollar should go. | Cons: Don't treat ROAS as absolute. Attribution models, privacy frameworks such as SKAdNetwork, and differences between MMPs can all change what the final number looks like. |
K-Factor (Virality Coefficient)
Best for: Understanding the organic multiplier generated by existing users.
Definition: Some players do more than keep playing. They bring other players with them. K-factor estimates how much organic growth comes from referrals, invitations, creator content, and word of mouth rather than paid campaigns.
Formula: Invites per user × Conversion rate of invites
Industry benchmark: A K-factor greater than 1 indicates self-sustaining viral growth, although very few mobile games maintain that level over time. Most rely on a combination of paid acquisition and organic referrals, resulting in a K-factor below 1. (Source: Tenjin K-Factor Glossary.)
Pros: Paid acquisition only tells part of the story. K-factor helps you understand whether your existing players are doing some of the growth work for you. | Cons: Not every recommendation leaves a measurable trail. Players often discover games through conversations, creators, or social posts that never appear in attribution reports, which makes K-factor harder to measure precisely. |
Game Telemetry — the Raw Data Behind Every KPI
The KPIs we've covered so far tell you what happened. When you need to understand why it happened, you have to go one level deeper. That's where game telemetry becomes useful. A retention drop, a falling conversion rate, or a sudden change in ARPDAU rarely explains itself. The answers usually live inside the event data generated by players as they move through the game.
What Is Game Telemetry?
Game telemetry is the raw event data captured from a player's device during gameplay. Every tap, level start, level completion, session start, purchase, ad view, tutorial step, and crash can be recorded as an event. KPIs are calculated from this underlying data. In practical terms, telemetry is to dashboards what logs are to monitoring systems.
Long before launch, most teams decide exactly which player actions they'll track. They'll define an event schema that captures the moments they care about, from tutorial completion and failed levels to inventory actions, progression milestones, and custom events unique to the game's mechanics.
Tools such as Unity Analytics, GameAnalytics, Firebase, and deltaDNA collect those raw events automatically. From there, they become the game analytics metrics you see in reports and dashboards. If the underlying telemetry is incomplete or inconsistent, every KPI built on top of it becomes less reliable.
From Telemetry to Dashboard — The Typical Pipeline
The pipeline itself is fairly straightforward. An SDK inside the game client records player events as they happen. Those events are collected by platforms such as Unity Analytics, GameAnalytics, AppsFlyer, or Firebase before being sent to a data warehouse like BigQuery or Snowflake. Reporting tools including Looker, Tableau, and Amplitude then turn that raw event stream into dashboards the team can actually use.
For most studios, this entire workflow lives separately from store analytics. That's where AppFollow fills the gap by helping teams connect in-game behavior with store visibility, ratings, reviews, and competitor activity.
At each stage, raw events become increasingly useful for decision-making. Product teams can analyze progression bottlenecks, identify churn risks, and measure feature adoption. Most studios keep this in-game analytics stack separate from store analytics.
On the store side, AppFollow provides the second half of the picture through conversion insights, ratings, review sentiment, and competitor metadata. Together, those datasets help explain both what players do inside the game and how they perceive it before and after installation.
How to Interpret Mobile Game KPIs (Without Misreading Them)
Collecting data is easy. Making good decisions from it is harder. The biggest mistakes rarely come from bad dashboards. They come from reading mobile game KPIs without enough context.
A benchmark from the wrong genre, a single outlier cohort, or a temporary LiveOps spike can make healthy performance look broken. Strong teams treat gaming metrics as signals that require investigation, not automatic answers.
Read KPIs in Context, Not in Isolation
A single metric rarely explains what's happening inside a game. Before changing a roadmap, pricing model, or acquisition strategy, apply three simple checks:
- Start with the supporting metrics. If ARPU moves, don't stop there. Check ARPPU and payer conversion before deciding whether monetization actually improved.
- Benchmarks only matter in context. A retention rate that looks healthy for a casual game could be a warning sign for a mid-core title, so compare yourself with games that have similar audiences and business models.
- Always ask what changed recently. A LiveOps event, balance update, or new content release can shift your numbers for a few days without saying much about the game's long-term health.
Statistical significance matters too. One day's data is a data point. A consistent pattern across multiple cohorts is evidence.
Watch for Vanity Metrics That Drive Wrong Decisions
Some metrics look impressive while hiding underlying problems.
- Installs are rising, but active players are not. Acquisition is working. Engagement may not be.
- ARPU is increasing while payer share declines. Revenue may be concentrating among a smaller group of spenders rather than improving overall monetisation.
- One cohort looks exceptional. The next two cohorts may already be trending in the opposite direction.
Vanity metrics create confidence without clarity. Segment by cohort, account for seasonality, and look for patterns that persist across multiple player groups before making major decisions.
How AppFollow Complements Your Game Analytics Stack
Game analytics tools such as Unity Analytics, GameAnalytics, and AppsFlyer measure what happens inside the game. AppFollow measures what happens on the store, and the two together create a more complete view of your mobile game KPIs.
Store-side KPIs That Complete Your Dashboard
Most game teams already track retention, ARPU, and acquisition performance. The missing piece is often what happens before a player ever launches the game. Store conversion rate, install velocity, ratings, visibility, and keyword rankings influence the quality and volume of incoming users, yet they sit outside most game analytics platforms.
That's where AppFollow's ASO Dashboard comes in. Track keyword rankings, visibility, category rankings, ratings, review trends, and competitor movements from a single dashboard instead of switching between multiple tools.
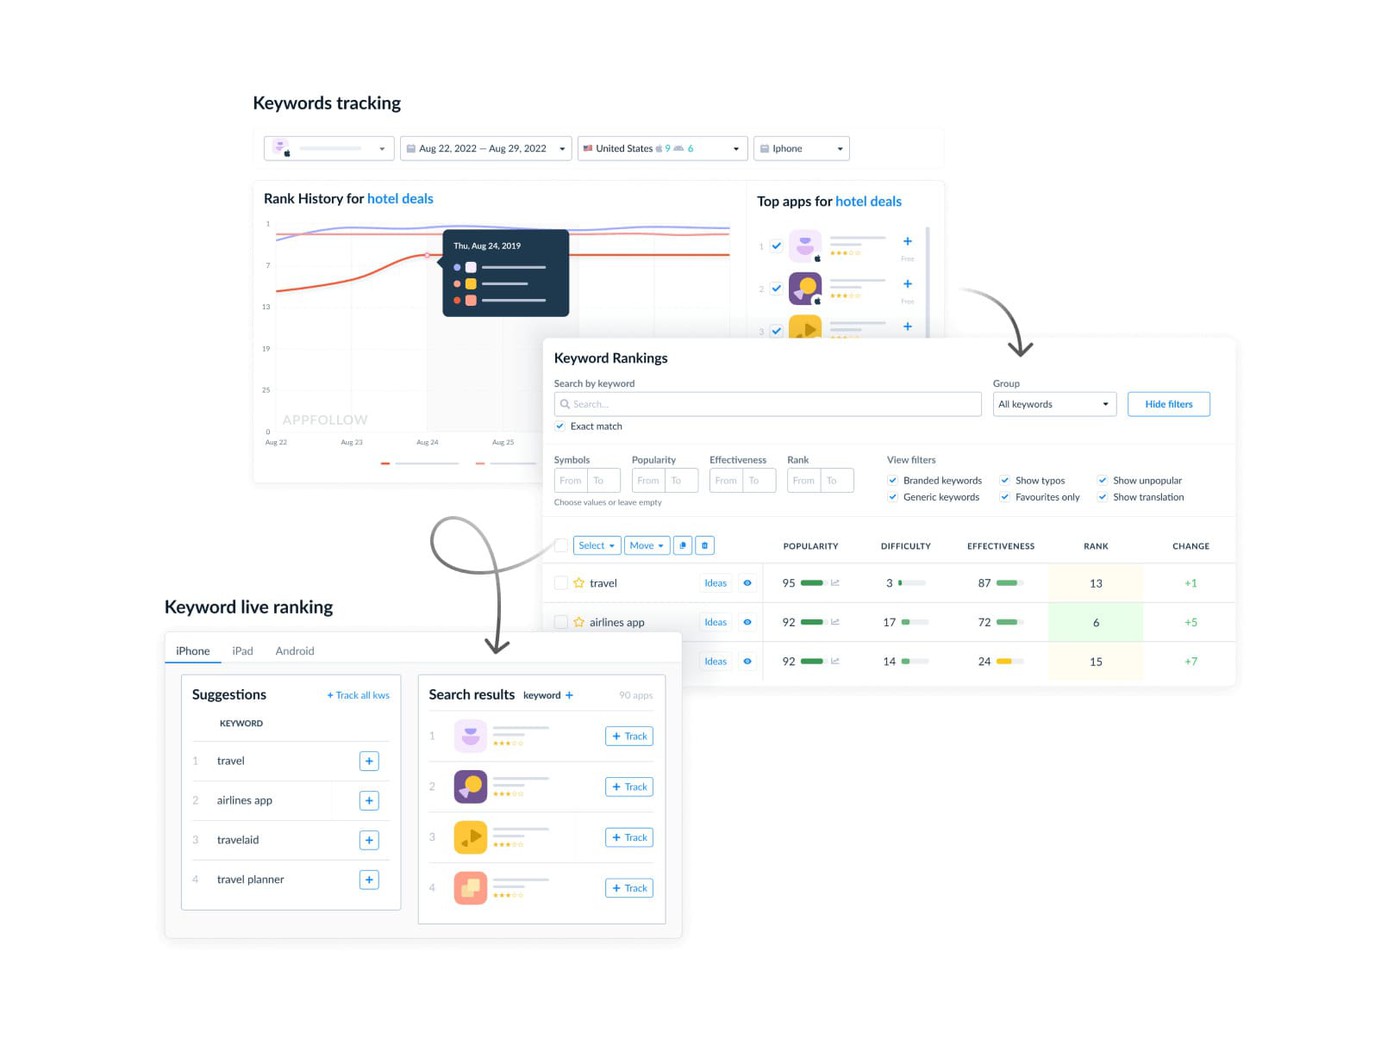
Use it to monitor your store performance from a single dashboard instead of switching between App Store Connect, Google Play Console, and multiple third-party tools. Track changes in keyword rankings, store conversion, visibility, and install velocity as they happen. If you're also improving your Google Play ASO keywords, comparing those store-side changes with in-game metrics makes it much easier to understand what influenced install quality.
If installs slow down or conversion drops, you'll have the store-side context needed to investigate the cause before it affects downstream KPIs. For a deeper look at these signals, see our ASO metrics guide.
Review Sentiment as a Leading Indicator of Churn
It's also worth monitoring your store review rating gap, because a widening gap between review volume and star ratings often highlights emerging player frustration before retention metrics fully reflect it. A spike in complaints about progression, bugs, matchmaking, rewards, or performance can appear weeks before those issues show up in retention cohorts.
Pairing review monitoring with strong response workflows also helps teams react faster to player issues. Our gaming reply time benchmarks show how quickly leading studios respond across the major app stores. Instead of reading thousands of reviews one by one, automatically group recurring themes, filter feedback by issue, language, or sentiment, and identify emerging problems while they're still manageable.
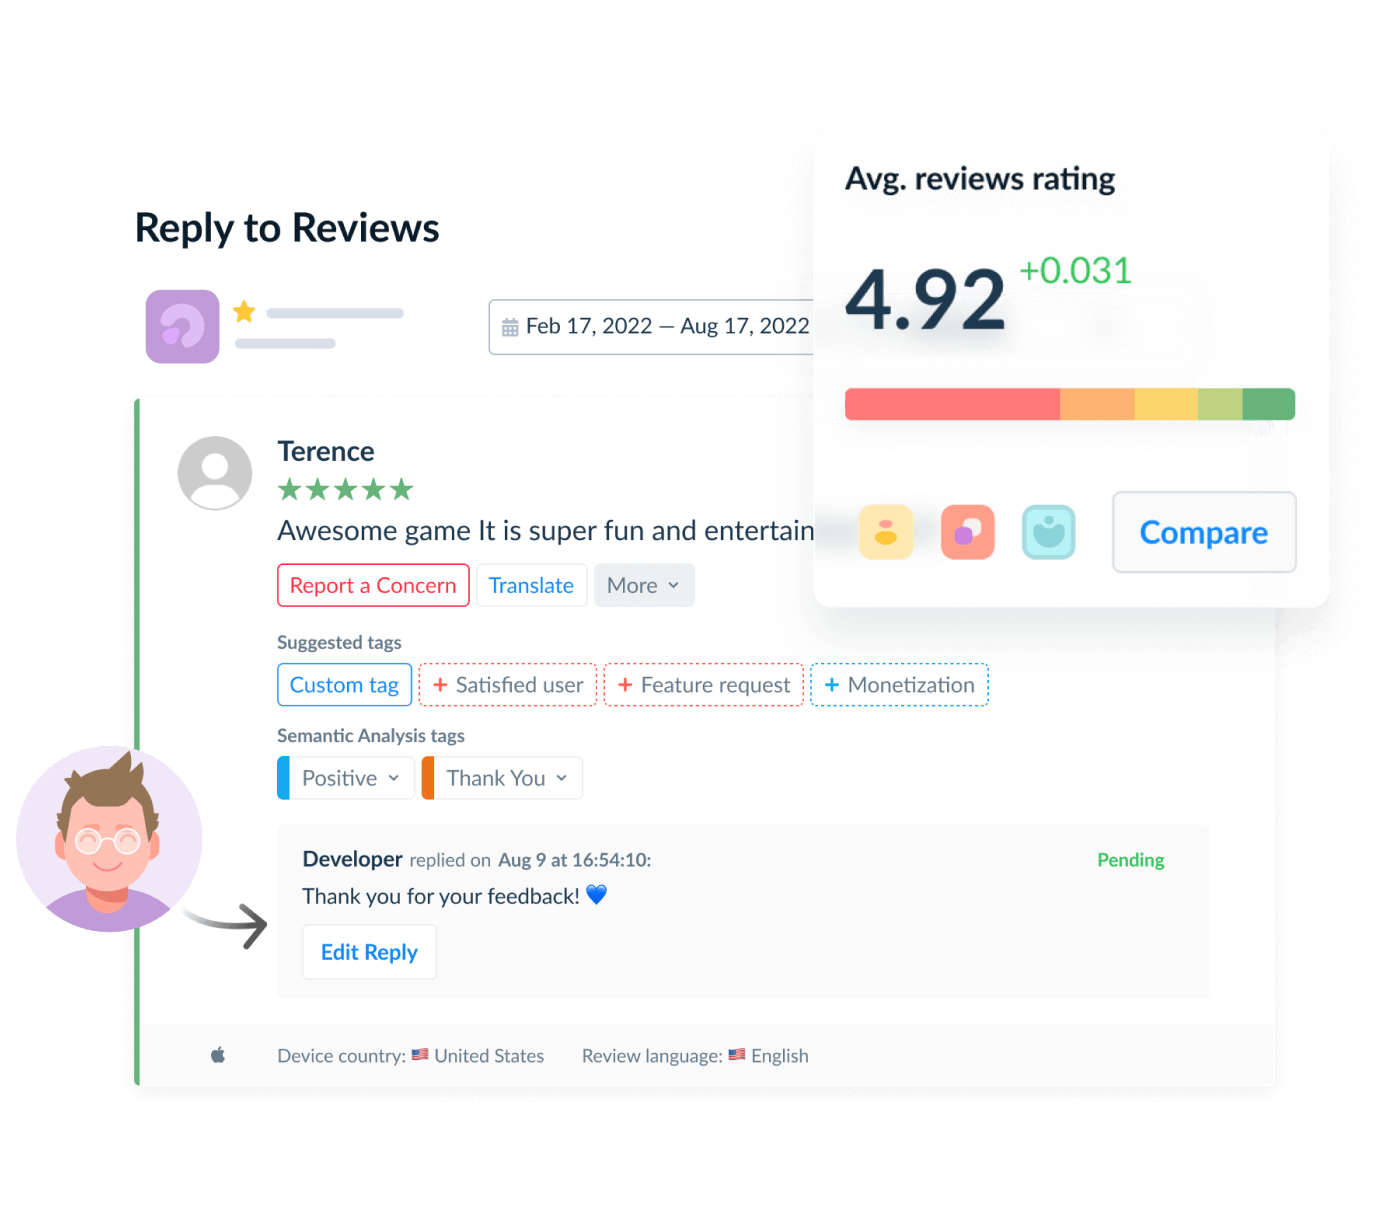
Watch sentiment trends alongside your retention dashboards. Comparing your results against current gaming sentiment score benchmarks also helps you understand whether negative feedback reflects an isolated issue or a broader market pattern. When review sentiment starts declining, investigate the complaints before they become measurable churn. Reviews won't replace telemetry or cohort analysis, but they often explain why a KPI moved.
Competitor Intelligence: Benchmark KPI Proxies Against the Top 12
You can't see a competitor's retention curve, payer conversion rate, or ARPDAU. You can observe the signals surrounding those KPIs. Ranking movements, review velocity, ratings changes, store conversion performance, and metadata updates often reveal where momentum is building.
Use AppFollow's Competitor Intelligence to monitor those proxy signals in one place. Track competitors' keyword rankings, metadata updates, review trends, and visibility over time. If you want to understand where those visibility gains originate, our guide on how to find competitors' keywords walks through the process. When a competing game suddenly climbs the charts or receives a wave of positive reviews, you'll have the context to investigate what changed and decide whether it's worth responding.cta_get_started_yellow