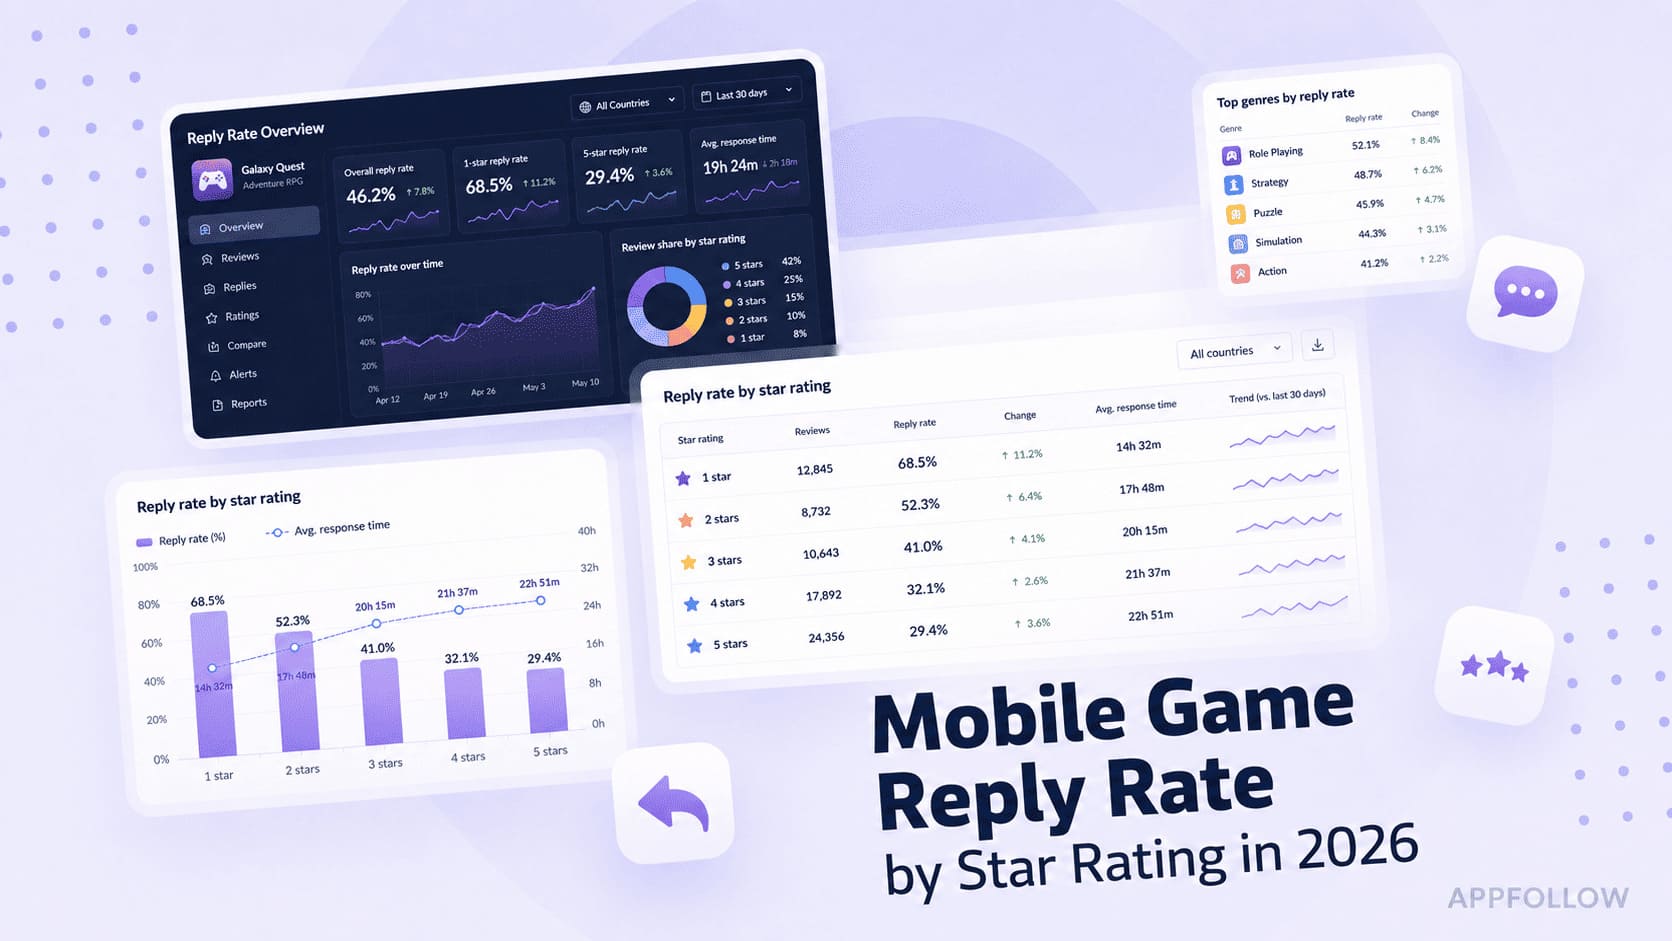
Mobile Game Reply Rate by Star Rating in 2026: Why the 2-Star Band Is the Hidden Goldmine of Player Recovery

Table of Content:
- Key insights at a glance
- How we collected this data
- 2026 reply-rate-by-star-rating snapshot: who replies to what
- Most studios reply to the wrong star ratings
- What is reply rate by star rating?
- How does your reply pattern look?
- Why the 2-star band is the hidden goldmine
- The volume distribution that makes the middle look small
- Bottom 10% vs. Top 10% — two completely different reply philosophies
- The conversion math — why middle-band coverage compounds
- Fingersoft’s reply effect flip — middle-band coverage in practice
- FAQ
Most studios reply to 1-star reviews for damage control and 5-star reviews for the easy thank-yous. The 2, 3, and 4-star middle gets neglected. The 2026 benchmark across 51.5 million reviews shows top studios flipping that pattern.
AppFollow clients reply to 73.8% of 2-star reviews — the highest of any star tier — alongside 69.4% of 1-star, 70.9% of 3-star, 67.8% of 4-star, and 63.7% of 5-star. The bottom 10% of apps spend 48.4% of their reply budget on 5-stars and almost nothing on the middle.
The 2-star band is the most convertible cohort in mobile gaming reviews. Cover it and the rating-recovery math turns dramatically more favorable.
Key insights at a glance
- Dataset: 51.5M reviews, 561,000+ replies, 22,800+ gaming apps, January 2025 – January 2026.
- AppFollow client reply rates by star rating: 1-star 69.4%, 2-star 73.8% (highest), 3-star 70.9%, 4-star 67.8%, 5-star 63.7%.
- Bottom 10% of apps allocate replies: 48.4% to 5-star, 28.1% to 1-star, 8.7% to 2-star, 7.1% to 3-star, 7.6% to 4-star.
- Top 10% of apps allocate replies: 63.6% to 5-star, 18.2% to 1-star, more even spread across middle.
- Review volume distribution is wildly skewed: 1-star reviews make up 65.1% of total AppFollow client reviews. 5-star: 25.7%. Middle (2/3/4-star): just 9.2% combined.
- Despite being only 9.2% of volume, the 2-4 star middle is the most convertible cohort — most likely to update their rating after a developer response.
- Up to 30% of users update their reviews after receiving a developer response.
- The +0.42 industry-wide reply effect runs higher in the middle band because middle-rating reviewers are more likely to upgrade their score post-response.
- Toca Boca: 3.1 → 4.1 stars; Fingersoft: reply rate 36.77% → 71.76% with reply effect flipping from -0.3 to +0.15.
How we collected this data
AppFollow Research · Data range: January 1, 2025 to January 1, 2026
- Sample. 51.5 million reviews and 561,000+ developer replies across 22,800+ gaming apps on Apple App Store and Google Play. Includes a non-aggregated dataset of 2,115 individual apps (1,797 on Google Play, 318 on App Store) for app-level distribution analysis, plus the top 100 featured games chosen by the platforms in 2025.
- Sources. First-party AppFollow telemetry across 1,000+ managed client apps (64% Google Play, 36% App Store), plus public store data ingested through the AppFollow Reviews API across 15 gaming genres.
- Benchmarks. Three tiers compared head-to-head: global (the whole market), featured (the top 100 apps each platform chose to promote during 2025), and AppFollow clients (managed apps using our review-management and AI reply tooling).
- Caveats. Sentiment is scored at review level via AppFollow’s in-house classifier and requires a minimum review volume. About 400+ apps in the non-aggregated set carry a store rating of zero due to insufficient ratings. Top 10% and bottom 10% segments are based on store rating percentiles, not revenue or volume.
2026 reply-rate-by-star-rating snapshot: who replies to what
Star rating | AppFollow client reply rate | Bottom 10% reply share | Top 10% reply share |
|---|---|---|---|
1-star | 69.4% | 28.1% | 18.2% |
2-star (highest AF coverage) | 73.8% | 8.7% | More even |
3-star | 70.9% | 7.1% | More even |
4-star | 67.8% | 7.6% | More even |
5-star | 63.7% | 48.4% | 63.6% |
Key takeaway: AppFollow clients cover the 2–4 star middle at 67–74% reply rates. The bottom 10% of apps cover the same middle at 7–9%. The gap is the opportunity.
Most studios reply to the wrong star ratings
Picture how a typical studio handles its review queue. A 1-star review comes in. The team scrambles to put out the fire. A 5-star review comes in. Someone drops in a thank-you. A 2, 3, or 4-star review comes in. Silence.
This pattern is so common that we documented it across 22,800 gaming apps. The bottom 10% of apps spend 48.4% of their reply budget on 5-star reviews and 28.1% on 1-star reviews. The entire 2-3-4 star middle gets roughly 23% of total reply effort spread across three star bands.
Half the reply hours go to players who already love the game. A quarter goes to firefighting. The middle — the most convertible cohort — gets the leftovers.
AppFollow clients run the opposite playbook. Their highest coverage band is 2-star reviews at 73.8%. Their lowest is 5-star at 63.7%. Coverage doesn’t collapse on the middle — it peaks there. And the rating outcomes follow.
Anatoly Sharifulin, CEO and co-founder at AppFollow: "A timed response to a review is often the thing that keeps a player from uninstalling, and a bad reputation compounds faster than most studios realize." The 2-star band is where that compounding either starts or stops.
What is reply rate by star rating?
Reply rate by star rating is the percentage of reviews in each star band (1, 2, 3, 4, 5) that receive a developer response. The metric exposes how a team is allocating its response effort — and whether that allocation matches the underlying rating-recovery math.
How does your reply pattern look?
Quick diagnostic. Look at your last 100 replies. What share went to each star tier?
- If 5-star replies dominate (40%+) and the middle is under 15% combined — you are in the bottom 10% pattern. Reactive firefighting.
- If 5-star replies are around 60%+ and the middle has meaningful coverage — you are in the top 10% pattern. High overall coverage, with the volume distribution skewing the percentages toward 5-stars.
- If 2-star reviews get the highest individual-star coverage — you are running the AppFollow client pattern. Middle-band first, extremes second.
Why the 2-star band is the hidden goldmine
2-star reviewers are unhappy. They are also paying attention. They wrote enough text to articulate a specific complaint, but they didn’t rage-tap the lowest possible rating. That combination of dissatisfaction and engagement is the most convertible state in the entire review distribution.
Reply to a 2-star review with a real answer — acknowledge the issue, name the fix, point to the timeline — and a meaningful share of those reviewers will update their rating inside the engagement window. Industry data shows up to 30% of users update reviews after a developer response. The conversion rate runs higher in the middle band because the reviewer was already on the fence.
AppFollow client behavior reflects this math. Reply rates by star rating across the client base:
- 1-star — 69.4%
- 2-star — 73.8% (highest)
- 3-star — 70.9%
- 4-star — 67.8%
- 5-star — 63.7%
The curve peaks at 2-star, declines gently through 3 and 4-star, and bottoms out at 5-star. That shape is the operational signature of a team prioritizing rating recovery over thank-yous.
Key takeaway: The 2-star band is the hidden goldmine. AppFollow clients cover it at 73.8%. The bottom 10% of apps cover it at 8.7%. Closing that gap is where the rating-uplift math lives.
The volume distribution that makes the middle look small
One reason most teams under-cover the middle is that the middle band looks small on a volume chart. Across AppFollow client reviews, the star distribution runs:
- 1-star — 65.1% of total review volume
- 2-star — 2.6%
- 3-star — 3.0%
- 4-star — 3.6%
- 5-star — 25.7%
The 2-4 star middle is just 9.2% of total review volume. The 1-star and 5-star tiers together account for 90.8%.
This is review volume, not app quality. The skew reflects who actually writes reviews — people angry enough to leave a 1-star or happy enough to leave a 5-star. The middle requires more emotional energy to articulate, so fewer players land there.
But the conversion math runs the opposite direction. The middle band, despite being only 9.2% of volume, contains the highest-conversion reviewers in the dataset. Every reply hour spent on a 2-star review returns more rating uplift than a reply hour spent on a 5-star.
Key takeaway: Volume share and conversion impact don’t correlate. The 2-4 star band is 9.2% of reviews and far more than 9.2% of the rating-recovery opportunity. Prioritize by leverage, not by queue size.
Bottom 10% vs. Top 10% — two completely different reply philosophies
When apps are split into the bottom 10% and top 10% by store rating, the difference in how they allocate replies tells you everything about their philosophy.
Bottom 10% reply distribution by star rating
- 5-star — 48.4% of replies
- 1-star — 28.1%
- 4-star — 7.6%
- 3-star — 7.1%
- 2-star — 8.7%
Top 10% reply distribution by star rating
- 5-star — 63.6% of replies (note: higher because 5-stars are 25.7% of total volume)
- 1-star — 18.2% (note: lower share because top apps have fewer 1-stars proportionally)
- Middle (2/3/4) — distribution is more even than the bottom 10%, reflecting higher overall coverage
Read those numbers carefully. The bottom 10% allocates almost half its replies to 5-star reviews while having a 3.18 average store rating. They’re thanking happy users while their angry users sit unanswered.
The top 10% allocates a similar share to 5-stars but with a much higher absolute coverage — because they cover everything. Their 5-star share looks high because their 5-star volume is high, not because they’re ignoring the middle.
Janire Rodríguez Indias, Head of Customer and Professional Services at AppFollow: "Silence is costing gaming apps growth. While almost a third don’t reply to reviews, those that engage smartly, focusing on negative feedback first, see measurable rating increases (up to +0.42)." The +0.42 baseline doubles when the negative-focus extends through the middle band.
The conversion math — why middle-band coverage compounds
Reply effect runs differently across the star rating distribution. The 2026 report shows the industry-wide reply effect at +0.42 stars (apps that reply at all versus apps that don’t). That number is the blended average across all star ratings.
Inside the average, the math varies. A 1-star reviewer updating to 3 stars is a +2 star move. A 2-star updating to 4 is also a +2. A 3-star updating to 5 is another +2. The middle band carries the same upside potential as the bottom band, with a much higher conversion likelihood per reply.
Reply to a 5-star reviewer and the maximum upside is zero — they’re already at the ceiling. Reply to a 5-star reviewer who downgrades because of an unaddressed bug, and the downside is severe. The 5-star band is a defensive channel, not an offensive one. The middle band is where rating growth actually comes from.
Key takeaway: Middle-band replies have the highest expected rating uplift per response hour. Allocate accordingly.
Fingersoft’s reply effect flip — middle-band coverage in practice
Antti Pennanen at Fingersoft, as published in the 2026 benchmark:
"In 2025, granular data allowed us to track what responses help the most, doubling our efficiency and flipping our impact. Reply Rate: increased from 36.77% to 71.76%. Reply Effect: shifted from -0.3 to +0.15."
The reply-effect flip from negative to positive is the giveaway. Before the redistribution, Fingersoft’s replies were arriving too late, or covering the wrong star bands, and the team’s effort was accidentally dragging the rating down. Once the coverage shifted to include the middle band more aggressively — and once the speed got faster — the effect flipped to positive.
Jonny Hair at Toca Boca, on the broader operational pattern: "We managed to get the total review score from 3.1 stars to 4.1 using AppFollow. The road that we’re taking is the right one."
A full star of recovery on a high-volume children’s app required middle-band coverage by default — there’s no way to get from 3.1 to 4.1 without flipping the 2-3 star reviewers.
FAQ
What is the average reply rate by star rating for mobile games in 2026?
Across AppFollow client apps in 2026: 1-star 69.4%, 2-star 73.8%, 3-star 70.9%, 4-star 67.8%, 5-star 63.7%. The 2-star band is the highest-coverage tier.
Why do top studios reply to so many 2-star reviews?
2-star reviewers are unhappy but engaged. They wrote enough text to articulate a specific complaint without rage-tapping the lowest rating. That combination of dissatisfaction and engagement makes them the most convertible cohort in the review distribution. A meaningful share will update their rating upward after a developer response.
Should I prioritize 1-star reviews over 2-star reviews?
Both matter. 1-star reviews need fast damage control. 2-star reviews offer higher conversion per reply hour. AppFollow clients cover 1-star at 69.4% and 2-star at 73.8% — a small but meaningful tilt toward the middle band where the conversion math is stronger.
Are 5-star reviews worth replying to?
Yes, but automate them. AppFollow clients reply to 63.7% of 5-star reviews — meaningful coverage, almost certainly powered by AI templates rather than agent hours. The marginal conversion impact of a 5-star reply is low (the reviewer is already at the ceiling), but the visible engagement compounds for store-page conversion.
What share of users update their review after a developer response?
Up to 30% of users update their reviews after receiving a developer response. The conversion is highest when the reply lands inside the player’s 30-day engagement window and the response specifically addresses the complaint in the review.
Which star rating gets the lowest reply coverage from struggling apps?
Among the bottom 10% of apps by store rating, the 3-star band gets just 7.1% of replies. The 2 and 4-star bands sit at 8.7% and 7.6%. The middle is the most under-replied cohort in struggling studios.
Why do struggling apps over-reply to 5-star reviews?
Reactive behavior. 5-star replies are easy — drop in a thank-you, no judgment required. The bottom 10% of apps spend 48.4% of their reply budget on 5-stars and roughly 28% on 1-star damage control, leaving the middle band almost entirely uncovered. The pattern reflects a team running on autopilot rather than running a rating-recovery program.
How does AppFollow measure reply rate by star rating?
AppFollow segments review-level data by star rating (1-2-3-4-5) and calculates the percentage of reviews in each band that received a developer response. Reported per genre, per store, per team, and per cohort (global, featured, AppFollow clients, top/bottom 10%).
Where does AppFollow source its 2026 reply-rate-by-star data?
First-party AppFollow telemetry across 1,000+ managed client apps plus public store data covering 22,800+ gaming apps and 51.5 million reviews, January 2025 through January 2026.