The Store Rating vs. Review Rating Gap in 2026: The Leading Indicator That Predicts Where Your Mobile Game’s Rating Is Heading

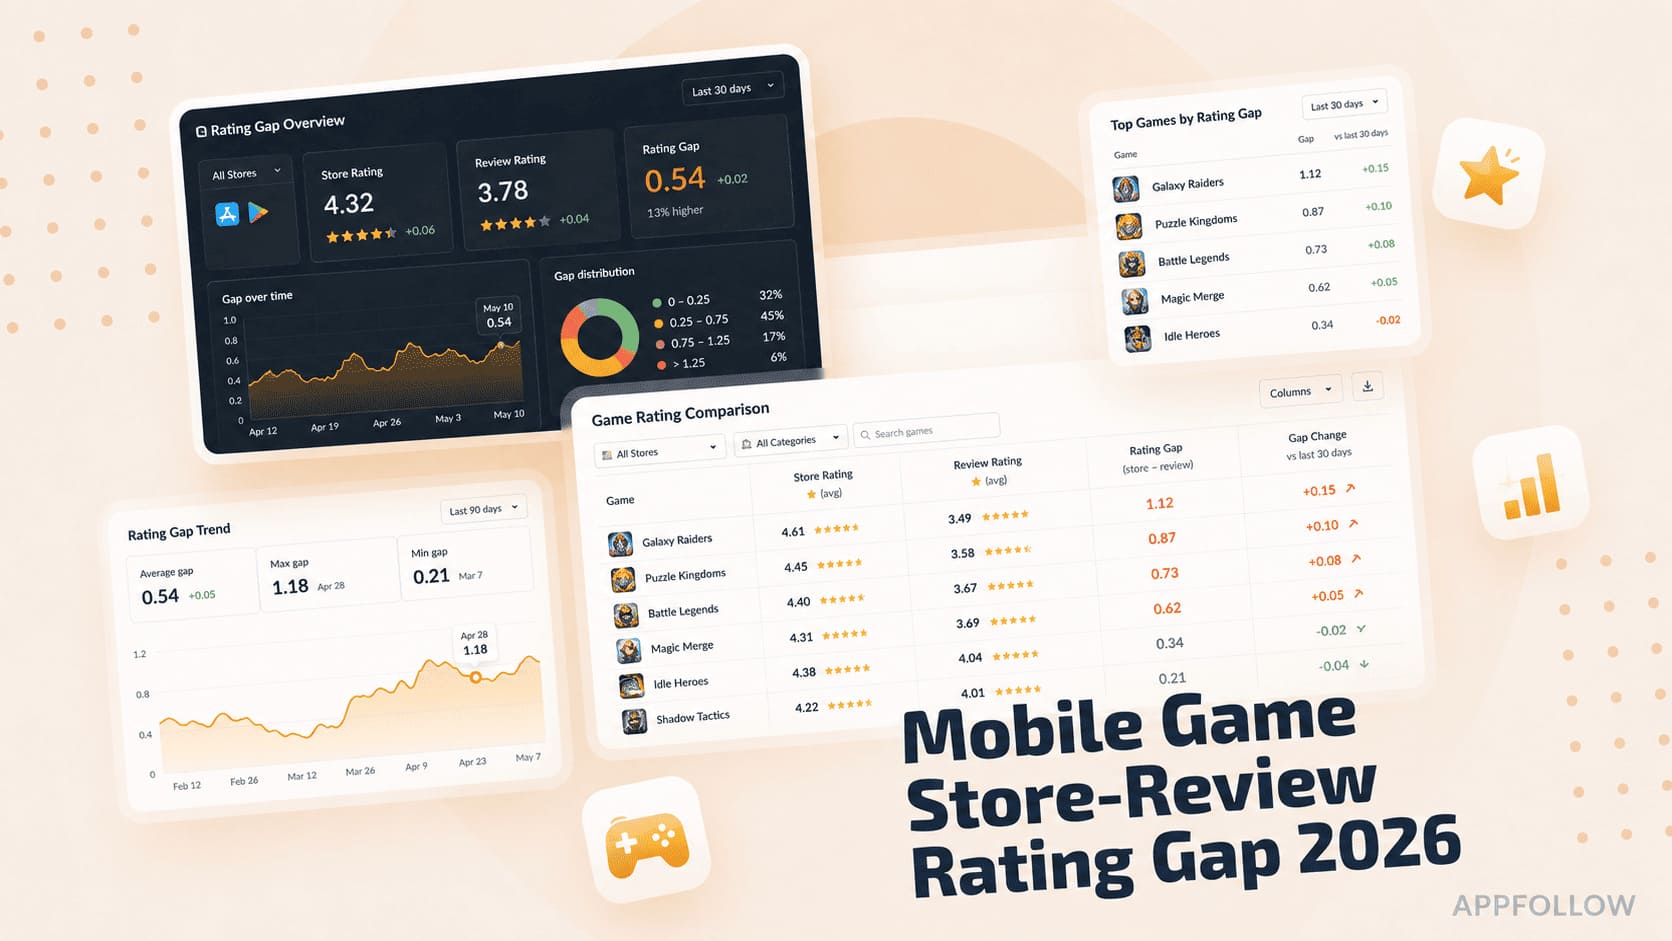
Table of Content:
- Key insights
- How we collected this data
- 2026 store-vs-review rating gap snapshot — by store and tier
- Every store page has two ratings. Most studios only watch one.
- What is the store-review rating gap?
- Where does your game sit relative to the 2026 gap benchmarks?
- The most counterintuitive finding in the 2026 report
- The featured-games cautionary tale — borrowed time, plain and simple
- AppFollow clients — why a moderate gap is actually healthy
- Why the gap matters — the two-quarter leading indicator
- The gap, the sentiment score, and the order of operations
- How the rating gap influences your role specifically
Every mobile game carries two ratings on its store page. The big one — the cumulative store rating — is what shoppers see. The hidden one — the recent-reviews average — is what predicts where the big number is heading next. The gap between them is the most underused leading indicator in mobile gaming ASO.
In 2026, featured App Store games carry a +1.48 store-review gap (their cumulative rating is living on borrowed time). Global Google Play apps sit at -0.53 (recent reviews are actually better than the cumulative number, so the rating is climbing).
Knowing your gap, store by store and genre by genre, gives you a two-quarter head start on rating drift.
Key insights
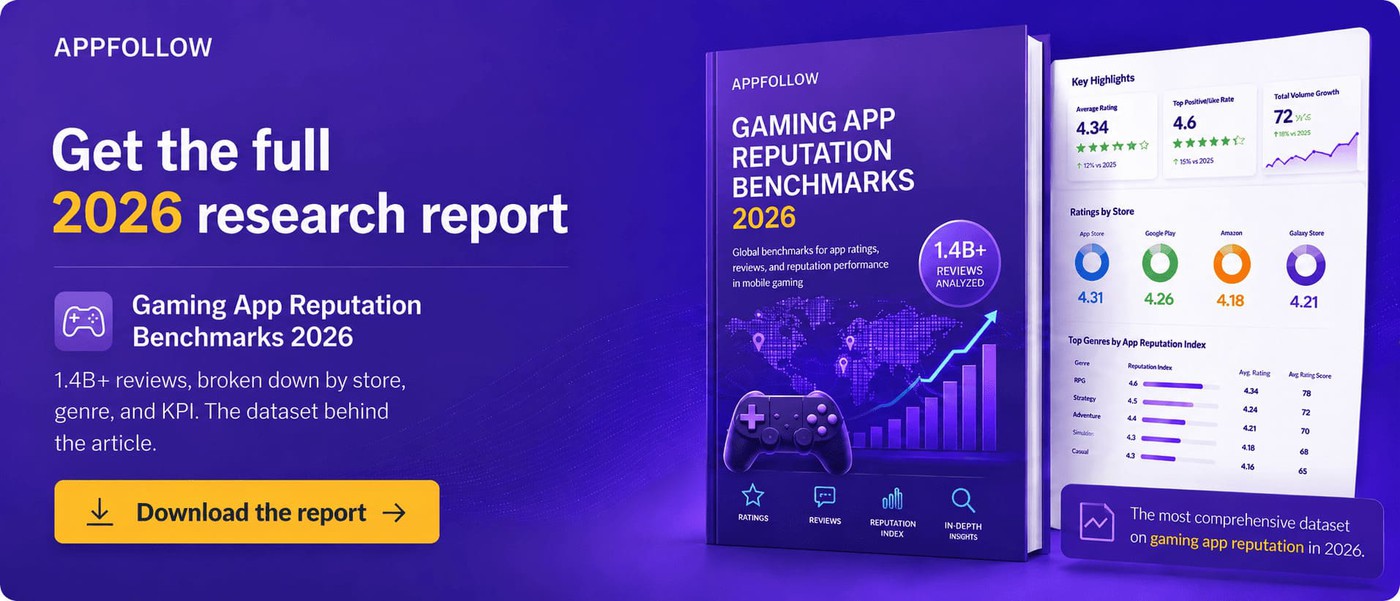
- Dataset: 51.5M reviews across 22,800+ gaming apps, January 2025 – January 2026.
- Global Google Play gap: -0.53 (review rating BETTER than store rating — improving).
- Global App Store gap: +0.59 (review rating below store rating — declining).
- Featured games on Google Play: +0.12 gap (near stable).
- Featured games on App Store: +1.48 gap (biggest of any tier — living on borrowed time).
- AppFollow clients on Google Play: +0.54 gap (healthy historical track record).
- AppFollow clients on App Store: +0.68 gap (consistent with platform-wide skew).
- Card featured games carry the biggest single-genre gap at +1.76.
- Educational featured games — the only category with a negative gap at -0.20 (actively improving).
- Genre-level featured gaps (App Store): Action +1.23, Role Playing +1.02, Puzzle +0.94, Word +0.94, Sports +0.80.
- The gap is a two-quarter leading indicator for the store-rating headline number.
- The mechanism: store ratings are cumulative averages, review ratings reflect what current players are writing today.
How we collected this data
- Sample. 51.5 million reviews and 561,000+ developer replies across 22,800+ gaming apps on Apple App Store and Google Play. Includes a non-aggregated dataset of 2,115 individual apps (1,797 on Google Play, 318 on App Store) for app-level distribution analysis, plus the top 100 featured games chosen by the platforms in 2025.
- Sources. First-party AppFollow telemetry across 1,000+ managed client apps (64% Google Play, 36% App Store), plus public store data ingested through the AppFollow Reviews API across 15 gaming genres.
- Benchmarks. Three tiers compared head-to-head: global (the whole market), featured (the top 100 apps each platform chose to promote during 2025), and AppFollow clients (managed apps using our review-management and AI reply tooling).
- Caveats. Sentiment is scored at review level via AppFollow’s in-house classifier and requires a minimum review volume. About 400+ apps in the non-aggregated set carry a store rating of zero due to insufficient ratings. Top 10% and bottom 10% segments are based on store rating percentiles, not revenue or volume.
2026 store-vs-review rating gap snapshot — by store and tier
Tier | Google Play gap | App Store gap | What the gap means |
|---|---|---|---|
Global market | -0.53 | +0.59 | GP improving / AS declining |
Featured games | +0.12 | +1.48 | Featured AS rating is at risk |
AppFollow clients | +0.54 | +0.68 | Strong historical base, healthy operations |
Card (featured) | — | +1.76 | Biggest single-genre gap (declining) |
Action (featured) | — | +1.23 | Cumulative rating ahead of recent reviews |
Educational (featured) | — | -0.20 | Only featured genre actively improving |
Key takeaway: Negative gaps are good news for tomorrow. Positive gaps mean the current rating is unsustainable. The bigger the positive gap, the faster the cumulative number will drift downward.
Every store page has two ratings. Most studios only watch one.
Open your store page right now. Look at the rating at the top. Then scroll down to the reviews — the most recent ones, the ones still being written this week.
Notice the gap?
The number at the top is the cumulative store rating. Years of votes, averaged out. Slow to move. Lagging by design.
The numbers underneath are what your current players think. Fast to move. Predictive.
Subtract one from the other and you get the gap — the most underused leading indicator in mobile gaming ASO. The 2026 benchmark report makes the case across 51.5 million reviews: the gap predicts which direction your headline rating is heading. The bigger the positive gap, the harder gravity will pull your cumulative number down.
Anatoly Sharifulin, CEO at AppFollow:
"Players remember whether you showed up for them, and so do the store algorithms that decide what gets featured. A bad reputation compounds faster than most studios realize." The gap is where that compounding starts.
What is the store-review rating gap?
The store-review rating gap is the difference between an app’s cumulative store rating and the average rating of its current reviews.
Calculated as (store rating − review rating). A positive gap means the cumulative store rating sits higher than what current reviewers are giving — historical goodwill is propping up the visible number. A negative gap means current reviews are stronger than the cumulative average — the rating is on the way up.
AppFollow reports this gap per genre, per store, and per cohort.
Where does your game sit relative to the 2026 gap benchmarks?
Quick diagnostic before the deep dive. Calculate your gap (store rating minus current review rating) and match it to one of the bands below.
- Gap of -0.30 or lower — you are with the AppFollow client cohort’s best trajectories. Recent reviews beating cumulative average.
- Gap of -0.30 to +0.20 — stable. Your cumulative rating reflects what current players are saying.
- Gap of +0.20 to +0.60 — moderate decline pressure. AppFollow client average on Google Play sits here at +0.54.
- Gap of +0.60 to +1.00 — sustained decline pressure. AppFollow client average on App Store sits at +0.68.
- Gap above +1.00 — alarm territory. Featured App Store games sit here at +1.48. The cumulative rating will visibly drift down within two quarters unless something changes.
- Gap above +1.50 — emergency. Card featured games sit here at +1.76. Ship product fixes immediately.
The most counterintuitive finding in the 2026 report
Global Google Play apps carry a gap of -0.53. Recent reviews are actually better than the cumulative store rating across the average Google Play game.
That means most apps on Google Play are improving over time, or they’ve shed enough of their most negative early users that recent reviewers paint a fairer picture. Either way, the average Android game’s visible rating is about to climb.
App Store global gap: +0.59. The opposite. Recent App Store reviews are running half a star below the cumulative rating, which means the average iOS game’s visible rating is about to decline.
Two stores, two completely different trajectories at the same moment in time. Any cross-platform studio reading the same store rating on iOS and Android is reading two different futures.
Key takeaway: Google Play averages are bending up. App Store averages are bending down. Without intervention, the platform asymmetry that exists today will widen by the end of 2026.
The featured-games cautionary tale — borrowed time, plain and simple
Featured games on the App Store sit at a +1.48 store-review gap. Their cumulative rating averages 4.43. Their current users are writing reviews at 2.95 stars.
A 1.48-star gap is gravity. Recent reviews will drag the cumulative average down over the next two to four quarters, and the featuring window almost certainly closes before the rating catches up. By the time the rating does catch up, the studio has lost both the editorial slot and the visible quality signal.
Featured Google Play games run a much healthier +0.12 gap. The cumulative number and current reviews are nearly aligned. That alignment is what holds a featured slot across multiple cycles. App Store featured games are mostly burning their editorial moment.
Card featured games have it worst — a +1.76 gap. Action featured games sit at +1.23. Role Playing at +1.02. Puzzle and Word both at +0.94. Sports at +0.80. Most of the App Store editorial cohort is structurally vulnerable to a rating decline that hasn’t shown up in the visible number yet.
Featured App Store store-review gaps by genre
- Card — +1.76 (biggest gap of any genre)
- Action — +1.23
- Role Playing — +1.02
- Puzzle — +0.94
- Word — +0.94
- Sports — +0.80
- Simulation — +0.79
- Family — +0.74
- Arcade — +0.71
- Strategy — +0.59
- Board — +0.55
- Music — +0.18
- Adventure — +0.09
- Racing — +0.07
- Casual — +0.01
- Educational — -0.20 (only featured genre actively improving)
Key takeaway: Educational is the only featured genre where current reviews are better than cumulative ratings. Every other featured genre is on a clock. The size of the gap is the speed of the timer.
cta_get_started_purple
AppFollow clients — why a moderate gap is actually healthy
AppFollow clients on Google Play carry a +0.54 gap. On the App Store, +0.68. Both are positive, both look mildly concerning on paper. They’re actually a healthy signal in context.
A moderate positive gap means the cumulative store rating reflects sustained positive performance over time, while current reviews stay slightly below that long-term ceiling. That’s what you’d expect from any high-rated app — newer users include a wider mix of casual reviewers, and the cumulative number captures the historical peak.
The structural risk shows up only when the gap exceeds +1.0 (featured App Store territory) or when it widens quarter over quarter without a product event explaining the change.
Compare the trajectories:
- AppFollow clients GP: 4.36 store / 3.82 review → +0.54 gap
- AppFollow clients AS: 3.99 store / 3.32 review → +0.68 gap
- Global GP: 3.44 store / 3.96 review → -0.53 gap
- Global AS: 3.75 store / 3.16 review → +0.59 gap
- Featured GP: 4.29 store / 4.17 review → +0.12 gap
- Featured AS: 4.43 store / 2.95 review → +1.48 gap
AppFollow clients sit between featured games and the global market on absolute store rating, and they sit between featured Google Play (healthy gap) and featured App Store (alarming gap) on gap behavior. That middle position is the operational sweet spot — high enough to compete, balanced enough to defend.
Why the gap matters — the two-quarter leading indicator
Cumulative store ratings are slow. They accumulate over years. They take months of consistent recent reviews to meaningfully move.
Review ratings — what current players are writing this week — move fast. They reflect the present moment. They predict where the cumulative number is heading.
That difference is what makes the gap a leading indicator. A studio watching only the store rating sees nothing until the trend has been ongoing for a full quarter. A studio watching the gap sees the divergence forming weeks earlier, which buys runway to ship fixes, run reply campaigns, or rework messaging before the visible number takes the hit.
Yaroslav Rudnitskiy, Senior Professional Services Manager:
"Silence is costing gaming apps growth. While almost a third don’t reply to reviews, those that engage smartly, focusing on negative feedback first, see measurable rating increases (up to +0.42)." The +0.42 reply effect is one of the few documented mechanisms for closing a widening gap. Coverage of negative and middle-distribution reviews is how studios actively defend their cumulative rating.
The gap, the sentiment score, and the order of operations
The gap predicts where the rating is heading. Sentiment predicts where the gap is heading. Together they form a two-tier early-warning system.
Sentiment drift fires first — typically two to three weeks before the headline rating moves. The store-review rating gap fires next, as recent reviews begin to skew lower than the cumulative number. By the time the gap has widened by half a star, the cumulative rating is one or two quarters away from visible decline.
Watch sentiment daily. Watch the gap weekly. Watch the cumulative store rating monthly. Three different cadences, three different levels of leading indicator.
Read also: Customer Sentiment Analysis - How To Turn Reviews Into Decisions
How the rating gap influences your role specifically
For game developers
The gap tells you whether your current product trajectory is positive or negative — regardless of what the headline rating says. A +0.5 gap means you have roughly two quarters of runway before the visible rating reflects what your current players are saying.
Use that window.
Ship the patches that show up in negative sentiment-by-feature-tag. Run a reply campaign that catches negative reviews inside their 30-day engagement window. The gap closes when current reviews start matching or beating the cumulative average.
For game publishers
Cross-portfolio gap tracking is one of the cheapest risk-management plays available. Sort your titles by gap. Any title above +1.0 on the App Store or +0.7 on Google Play is structurally vulnerable. Allocate engineering and support attention proportional to gap size.
The titles with the biggest gaps are the ones losing tomorrow’s rating today, and the early intervention is dramatically cheaper than the recovery once the cumulative number has already started declining.
For marketers and ASO leads
Store-page conversion is driven by the cumulative number that shoppers see. The gap tells you what that number is about to become. Plan paid acquisition curves around the gap, not just the current rating.
A 4.4-star game with a +1.4 gap is about to look like a 3.8-star game in two quarters, and your CPI math should reflect that.
A 3.8-star game with a -0.4 gap is about to look like a 4.2-star game, and your spend should ramp ahead of the rating recovery.
For support and player-experience leads
The gap is the operational case for response-coverage funding. Every percentage point of reply rate added during a widening gap window is a percentage point of rating decline averted.
Dmitry Gerastenok, Head of Customer Support at G5 Entertainment: "Every response to a player review is both a support action and a public statement. Sometimes, calming a wave of negative reviews is more important than solving a single case."
The gap shows you which titles need the calming most.
Sources: AppFollow Gaming App Reputation Benchmarks 2026 (data range: January 1, 2025 to January 1, 2026; 51.5M reviews across 22,800+ apps; top 100 featured games per platform).