Subscription metrics for mobile apps: what to track and why they move

Table of Content:
- Key insights
- The 12 subscription metrics at a glance
- What subscription metrics mean in a mobile app
- Funnel metrics: from install to first payment
- Revenue metrics: MRR, ARPU, ARPPU and realized LTV
- Retention and churn: the subscription metrics that predict revenue
- Where to find each subscription metric
- How to triage a drop in subscription revenue
- Why subscription metrics move: what app reviews tell you
- Three mistakes that distort subscription metrics
- Trace every churn or refund spike to the reviews behind it
- FAQ
Subscription metrics are the numbers that show how a mobile app turns installs into paying subscribers, how much those subscribers earn, and how long they keep paying. In mobile, the App Store and Google Play count most of them, not your own billing system.
That detail shapes everything below. The store runs the trial, charges the card, retries failed payments, and handles most refunds. You get the numbers, but rarely the reasons.
The gap between apps is wide. The median subscription app earns $23 per payer in its first year, while top-quartile apps start at $44 (RevenueCat, 2026). Both use the same formulas. What separates them is how fast a team notices a move in churn or refunds and finds its cause.
This guide covers 12 subscription KPIs: formulas, 2026 benchmarks, worked examples, where to find each number, and how to trace a change to what users actually say.
Key insights
- Track 12 metrics in three groups: funnel, revenue, and retention.
- Trial length beats most paywall tweaks. Trials of 17–32 days convert at 42.5%; trials of four days or less at 25.5% (RevenueCat, 2026).
- Much of churn is a payment problem. Failed billing causes 32.2% of cancellations on Google Play and 15.2% on the App Store.
- Plan type matters more than market. After 380 days, 5.5% of weekly subscribers still pay, against 19.9% on annual plans with a trial (Adapty, 2026).
- Dashboards show what changed; reviews show why. Complaints about charges and renewals usually appear in reviews before the cohort report closes. Yet three in four app reviews never get a reply (AppFollow, 92.9M reviews).
The 12 subscription metrics at a glance
Use this table as a reference. Each metric is explained further down, with an example and the signal to watch.
Metric | Question it answers | Formula | 2026 benchmark |
|---|---|---|---|
Install-to-trial | Does the paywall sell the trial? | Trial starts ÷ installs | 10.9% median (Adapty) |
Install-to-paid | How many installs end up paying? | New payers ÷ installs, in a fixed window | 2.0% by day 35 (RevenueCat) |
Trial-to-paid | Does the trial prove the value? | Converted trials ÷ completed trials | 25.6% median (Adapty) |
Revenue per install (RPI) | What is one install worth? | Cohort revenue by day N ÷ installs | $0.23 at D14, $0.34 at D60 (RevenueCat) |
MRR | How big is the recurring business? | Active paid subscriptions, each normalized to one month | Depends on price and scale |
ARPU | How well do you monetize everyone? | Revenue ÷ active users | Depends on paywall model |
ARPPU | How much does a payer spend? | Revenue ÷ paying users | Depends on price points |
Realized LTV | What has a payer actually earned you? | Net cohort revenue ÷ payers in the cohort | $23 in year one (RevenueCat) |
Retention by plan | Who keeps paying? | Cohort still paying on day N ÷ cohort size | 5.5% weekly to 19.9% annual with trial, day 380 (Adapty) |
Voluntary churn | Who chose to leave? | User cancellations ÷ active subscriptions at start | Top reasons: low usage 37%, cost 35% |
Involuntary churn | Who lost access through a failed payment? | Unrecovered billing failures ÷ active subscriptions at start | 32% of cancellations on Google Play, 15% on App Store |
Refund rate | Who regretted paying? | Refunded transactions ÷ paid transactions | 3.5% median, non-AI apps (RevenueCat) |
What subscription metrics mean in a mobile app
In a SaaS business, you own the billing system. In a mobile app, Apple and Google do. Users cancel in their phone settings, so you never see the moment they leave, and you rarely get to ask why.
That changes how you read subscription business metrics. A SaaS churn number reflects decisions your customers made. A mobile churn number mixes those decisions with expired cards and payment retries. Apple gives a failed renewal a 60-day retry window before it counts as involuntary churn (Apple Developer).
In practice, a subscription team works with three data layers:
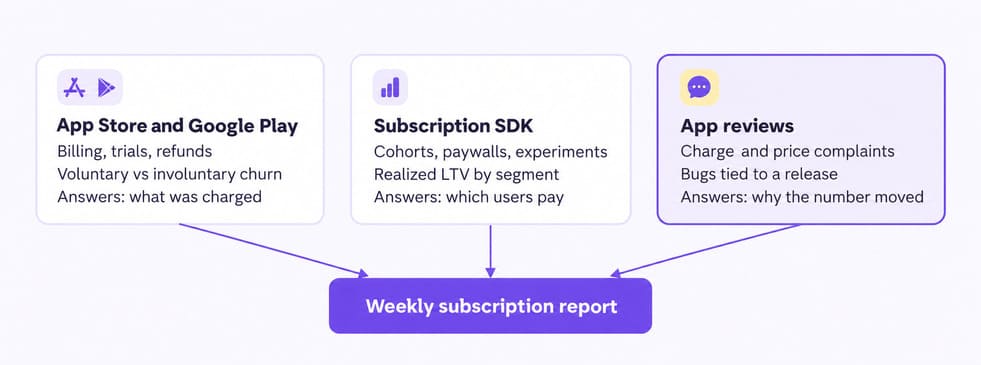
Stores and SDKs such as RevenueCat or Adapty count transactions well. Neither tells you why a user turned off auto-renew, asked for a refund, or skipped the paywall. That answer usually sits in the third layer, written by the user in a review.
One more boundary before the numbers. Subscription retention is not user retention. Day 1, Day 7, and Day 30 retention measure who opens the app; we cover those in our mobile game retention guide. Here, retention means who keeps paying. For engagement and acquisition KPIs, see our overview of broader mobile app KPIs.
Funnel metrics: from install to first payment
The subscription funnel starts on the store page, before your SDK records a single event. If your app store conversion rate falls, every metric below falls with it. So when payers drop, check the store page first.
Install-to-trial and install-to-paid rate
Install-to-trial rate is the share of installs that start a free trial. Install-to-paid rate is the share of installs that become paying subscribers, with or without a trial. These two subscription KPIs usually open a weekly report.
- Formula: install-to-trial = trial starts ÷ installs × 100. Install-to-paid = new paying subscribers ÷ installs × 100.
- Benchmark: 10.9% install-to-trial (Adapty, 2026). 2.0% download-to-paid by day 35, with hard paywalls at 10.7% and freemium apps at 2.1% (RevenueCat, 2026).
- Platform gap: iOS converts at 2.6%, Android at 0.9%, so report each store separately.
Always measure inside a fixed window, such as 35 days after install. Without one, older cohorts look better simply because they had more time to convert.
Trial-to-paid conversion rate
Trial-to-paid conversion rate is the share of completed free trials that become paid subscriptions. Apple uses the same definition in App Store Connect: only finished trials count.
- Formula: trials converted to paid ÷ trials completed × 100.
- Benchmark: 25.6% median across about 16,000 apps. Health and Fitness leads at 35.0%; Entertainment trails at 19.1% (Adapty, 2026).
Trial length moves the free trial to paid conversion rate more than category does:
Trial length | Trial-to-paid | Share of trials cancelled on Day 0 |
|---|---|---|
Short (4 days or less; 3-day for Day 0) | 25.5% | 55.4% |
Medium (5–9 days; 7-day for Day 0) | 37.4% | 39.8% |
Long (17–32 days; 30-day for Day 0) | 42.5% | 31.1% |
Source: RevenueCat, State of Subscription Apps 2026. Conversion uses RevenueCat's length bands; Day 0 figures refer to the named trial length.
What to check: the Day 0 column. More than half of three-day trials are cancelled the day they start. Those users signed up and immediately protected themselves from a charge they expect to forget. If your Day 0 share is that high, test a longer trial or a clear renewal reminder before you redesign the paywall.
Revenue per install
Revenue per install (RPI) is the revenue a cohort of installs earns by a given day, divided by the number of installs. It joins acquisition and monetization in one number.
- Formula: RPI (D14) = cohort revenue by day 14 ÷ installs in the cohort.
- Benchmark: $0.23 at D14 and $0.34 at D60. Hard paywall apps reach $2.32 and $3.09 (RevenueCat, 2026).
- Decision rule: if your cost per install is above D60 RPI, paid growth loses money until renewals catch up.
Worked example: a month of funnel data
Here is how the four funnel metrics fit together for a meditation app in March. Numbers are illustrative.
Step | Count | Metric |
|---|---|---|
Installs | 40,000 | — |
Trial starts | 4,000 | 10.0% install-to-trial |
Trials converted to paid | 1,040 | 26.0% trial-to-paid |
Direct purchases, no trial | 200 | — |
New payers | 1,240 | 3.1% install-to-paid |
Revenue by day 14 | $9,200 | $0.23 RPI (D14) |
Every number sits close to the 2026 medians, so the funnel looks healthy. The open question is whether those 1,240 payers stay. Retention, two sections below, answers it.
Revenue metrics: MRR, ARPU, ARPPU and realized LTV
Funnel metrics show how payers arrive. Revenue metrics show what they are worth. Keep these four on separate lines of your report, because each answers a different question.
MRR across weekly, monthly, and annual plans
Monthly recurring revenue (MRR) is the revenue from active paid subscriptions, normalized to one month. App Store Connect now reports MRR this way in its subscription analytics.
- Formula: for each active paid subscription, divide its price by the months in its billing period, then add them up.
- Example: a $34.80 annual plan adds $2.90 to MRR. A $5.99 weekly plan adds about $25.96 (5.99 × 52 ÷ 12).
- Limitation: MRR lags. A spike in cancellations this week reaches MRR only when those subscriptions fail to renew.
Treat MRR as the outcome. The retention metrics in the next section are your early warnings.
ARPU vs ARPPU
ARPU (average revenue per user) spreads revenue across all active users. ARPPU (average revenue per paying user) spreads it across payers only. The gap between them shows how much of your audience you monetize at all.
- Formulas: ARPU = revenue ÷ active users. ARPPU = revenue ÷ paying users.
- Example: $60,000 in monthly revenue, 150,000 active users, and 6,000 payers give an ARPU of $0.40 and an ARPPU of $10.
The pair is most useful when you read how it moves:
ARPPU | ARPU | What it usually means | Where to look |
|---|---|---|---|
Steady | Falling | Non-paying users grow faster than you convert them | Funnel metrics |
Falling | Steady | Payers shift to cheaper plans or discounts | Plan mix and offers |
Falling | Falling | Payers leave or ask for money back | Churn and refunds |
For ways to raise either number, see our guide to ARPU vs LTV.
cta_get_started_purple
Realized LTV vs predicted LTV
Realized LTV is the net revenue a cohort of payers has actually generated, divided by the payers in that cohort. Predicted LTV is a model of what they will generate. Use realized LTV for decisions and predicted LTV for planning.
- Formula: realized LTV (12 months) = net revenue from the payer cohort over 12 months ÷ payers in the cohort.
- Benchmark: $23 median per payer in year one, $32 in North America, $44 and above in the top quartile (RevenueCat, 2026).
- Example: 1,000 payers who joined in January have earned $23,000 net by December. Their realized 12-month LTV is $23.
Averages hide trade-offs. AI-powered apps earn about 41% more per payer, $30.16 against $21.37, yet churn roughly 30% faster. That is why subscription LTV should come from cohort analysis by install month, plan, and country. A subscription cohort analysis that mixes weekly and annual plans will mislead you, as the next section shows.
Retention and churn: the subscription metrics that predict revenue
Retention moves before revenue does, which makes it the earliest warning in your report. Plan type explains most of the variation. Adapty measured a retention gap of more than 15 points between plan types, and only 4.1 points between the best and worst regions.
Subscription retention rate by plan
Subscription retention rate is the share of a starting cohort still paying after a set period. Measure it per plan, because weekly, monthly, and annual plans renew on different clocks.
Formula: subscribers from the cohort still paying on day N ÷ subscribers who started in the cohort × 100.
Plan | Still paying after about a year | Source |
|---|---|---|
Annual with trial | 19.9% (day 380) | Adapty 2026 |
Annual, all | 28% in 2025, down from 31% in 2024 | RevenueCat 2026 |
Monthly | 14.2% (day 380) | Adapty 2026 |
Weekly | 5.5% (day 380) | Adapty 2026 |
The two datasets measure differently, so compare plans within one source. The direction holds in both: weekly plans bring revenue fast and lose it fast. They now earn about 56% of subscription app revenue, up from 43% in 2023 (Adapty). Weekly renewal rate is the number most likely to surprise you.
Trials help here too. Subscribers who started with a trial retain 1.4–1.7 times better than direct buyers (Adapty).
Voluntary vs involuntary churn
Subscription churn rate is the share of active subscriptions that end in a period. Before you act on it, split it in two, because each type needs a different fix.
Formula: subscriptions that ended in the period ÷ active subscriptions at the start × 100.
Voluntary churn | Involuntary churn | |
|---|---|---|
What happened | The user turned off auto-renew | A renewal payment failed and was never recovered |
Share of cancellations | 82.9% on App Store, 66.3% on Google Play | 15.2% on App Store, 32.2% on Google Play |
Top causes | Low usage (37.0%), cost (34.6%), a better app (9.5%), technical issues (7.1%) | Expired or declined cards, payment method problems |
Who owns the fix | Product, pricing | Billing, engineering |
First fixes to try | Onboarding, value before the paywall, plan mix | Billing grace periods, payment retries, update-your-card messages |
Sources: shares of cancellations from RevenueCat 2026 via PPC Land; voluntary reasons from Google Play cancellation surveys in RevenueCat, 2025.
Worked example. Illustrative numbers. On May 1, 10,000 monthly subscribers are active. By May 31, 900 have ended: 650 cancelled and 250 failed billing. The app churn rate is 9%. Yet 28% of that churn is involuntary, and no paywall test will touch it.
Refund rate
Refund rate is the share of paid transactions refunded in a period. On iOS, Apple decides most refund requests, so many teams see only the outcome.
- Formula: refunded transactions ÷ paid transactions × 100.
- Benchmark: 3.5% median for non-AI apps and 4.2% for AI apps; the top of the range sits near 12.5% and 16% (RevenueCat, 2026).
- What to check: any rise above your own baseline. It usually follows a renewal users did not expect, a price they did not notice, or a feature that broke after they paid.
Where to find each subscription metric
No single dashboard holds all 12 metrics. Stores own billing events, your subscription SDK owns cohorts and paywalls, and neither stores the reasons. Subscription analytics in practice means joining three sources on a schedule.
Metric | App Store Connect | Google Play Console | Subscription SDK |
|---|---|---|---|
Install-to-trial, install-to-paid | Partly (offer starts, paid starts) | Partly (subscription reports) | Yes, by cohort |
Trial-to-paid | Yes (Trial to Paid Conversion) | Yes | Yes |
MRR | Yes | Revenue only, not normalized | Yes |
Realized LTV | No | No | Yes |
Retention by plan | Cohorts page | Subscription reports | Yes |
Voluntary churn | Yes, with cancellation reason | Yes, with cancellation survey | Yes |
Involuntary churn | Yes (grace period, billing retry) | Yes | Yes |
Refunds | Yes | Yes | Yes |
Apple's cancellation reason dimension is coarse by design: billing issue, turned off auto-renew, price increase, or removed from sale. It tells you a user left. It cannot tell you that they left because the trial charged them a day earlier than they expected.
Two platform changes matter for your reporting this year. Apple is moving Sales and Trends into App Store Analytics, starting with subscription dashboards in mid-2026 and finishing through 2027. Apple's Retention Messaging also reaches general availability this fall. It lets you show a message, a plan switch, or a discount when a user taps Cancel (Adapty, WWDC26). Early results look modest but real: RevenueCat measured a 16.7% median save rate across 309 apps (RevenueCat, October 2026).
For a walkthrough of the store consoles themselves, see our App Store analytics guide and the Google Play analytics overview. That last column matters most once a number moves, as the next two sections show.
How to triage a drop in subscription revenue
When MRR or revenue per install drops, check the metrics in a fixed order. Each step rules out a cause before you spend time on the next one.
- Store page and installs. Did installs or store conversion fall? If so, the problem starts before the paywall.
- New payers. Compare install-to-trial and trial-to-paid with the previous four weeks, per store. A drop here points to the paywall, trial length, or onboarding.
- Renewals by plan. Check weekly, monthly, and annual renewals separately. A shift in plan mix can look like churn.
- Churn type. Split cancellations into voluntary and involuntary. Rising billing failures belong to payments and engineering.
- Refunds. A refund spike right after a renewal date usually means users did not expect the charge.
- Reviews from the same period. Filter by version, country, and topic. This is where you learn why.
A weekly subscription report you can copy
Five metrics cover most weekly decisions. The thresholds below are starting points. Replace them with your own after 8–12 weeks of baseline data.
Metric | Split by | Investigate when | First place to look |
|---|---|---|---|
Trial-to-paid | Store, trial length | Down 3+ points week over week | Paywall, renewal reminder, reviews about trial charges |
Day 0 trial cancellations | Trial length | Above 50% | Paywall copy, price clarity |
Renewal rate | Plan | Down 2+ points against the 4-week average | Release notes, reviews by version |
Involuntary churn | Store, country | Share of cancellations up 5+ points | Billing retry recovery, "payment failed" reviews |
Refund rate | Store | 1.5 times your baseline | Renewal reminders, reviews about unexpected charges |
Thresholds are illustrative starting points, not industry standards.
MRR and realized LTV stay in the monthly report. They move too slowly to trigger a weekly investigation.
cta_get_started_purple
Why subscription metrics move: what app reviews tell you
Step 6 of that triage is the one most teams skip. Every metric above tells you what changed; none of them tells you why. Users explain the why in public, in App Store and Google Play reviews, often within hours of the problem.
Teams that react fast build one habit. When a metric moves, they open the reviews for the same period, version, and country before anyone writes a hypothesis.
Map each metric to a review signal
Start with a fixed mapping, so nobody debates where to look when a number moves. The phrases below are the ones that typically cluster around each change.
When this moves | Look for reviews that mention | Filter first | Likely owner |
|---|---|---|---|
Trial-to-paid drops | "charged after trial", paywall confusion, features promised but missing | Last 14 days, 1–2 stars | Growth, product |
Involuntary churn rises | "payment failed", "can't restore purchase", card errors | Country and store | Engineering, billing |
Voluntary churn rises | "too expensive", "not worth it", a named competitor | Last 30 days, price topics | Product, pricing |
Refund rate rises | "didn't know it renews", "charged twice", unexpected annual charge | Days after the renewal date | Support, growth |
RPI drops | Rating falls after a release, crash or login complaints | App version | Engineering, ASO |
Read the table as a starting point, not a verdict. A spike in "too expensive" right after a price change is pricing feedback. The same spike after a broken feature is a value problem dressed as a price complaint.
Billing complaints set your rating floor
Payment complaints hurt twice. They predict churn and refunds, and they drag down the rating that sells your next trial. The arithmetic is unforgiving: at a 4.5 average, one 1-star review cancels out seven 5-star reviews.
Rating, in turn, moves store conversion. Our analysis of how ratings and reviews affect conversion rate covers that link in detail. A bad billing week can therefore lower install-to-paid twice: fewer installs, and fewer of them willing to start a trial.
Most of those complaints sit unanswered. AppFollow's App Reputation Benchmarks 2026 covers 92.9 million reviews on about 20,700 apps across both stores, from July 2025 to July 2026. Only about one review in four received a developer reply. The categories where many subscription apps sit look like this:
Category | Average rating | Reply rate | Average reply time |
|---|---|---|---|
Education | 4.16 | 29% | 204 hours |
Lifestyle | 4.10 | 25% | 110 hours |
Health & Sports | 4.13 | 21% | 143 hours |
Productivity | 4.36 | 12% | 105 hours |
Source: AppFollow, App Reputation Benchmarks 2026. App Store and Google Play combined.
The gap is worth closing. In AppFollow's client data, raising reply rate by 10 percentage points tends to lift an app's rating by roughly 0.3 to 0.5 stars. For a subscription app, that is the rating that sells the next trial. Replies also seem to land best in the category many fitness subscriptions belong to: Health & Sports shows the strongest reply effect in the dataset, a 1.39-point rating lift tied to replies.
Speed matters as much as coverage for billing complaints, because the user is often still deciding whether to ask for a refund.
"Answer routine feedback quickly, but route payment, account-access, and detailed bug reports to a named owner with the relevant context attached."
Lucija Knezic, Senior CSM & Product Strategy Manager at AppFollow
Release regressions show up in reviews first
Cohort reports close weeks after a release. Reviews arrive the same day. If version 5.4.0 broke purchase restore, users will say so long before your 30-day churn report confirms it.
The workflow takes three steps:
- Tag the reviews that matter for subscriptions. In AppFollow, semantic tags such as Monetization and Bug are applied automatically. Add a custom tag for billing, refunds, and renewals so payment complaints sit in one stream.
- Filter to the period around the release. Narrow the Reviews feed by tag, period, rating, and country. Every review shows the app version it was written on.
- Compare tagged volume and rating by version. Export the filtered set and group it by version. A jump on one version points to a regression; a slow rise across versions points to pricing or value.
Here is what step 3 can look like for an app whose billing complaints jumped after an update:
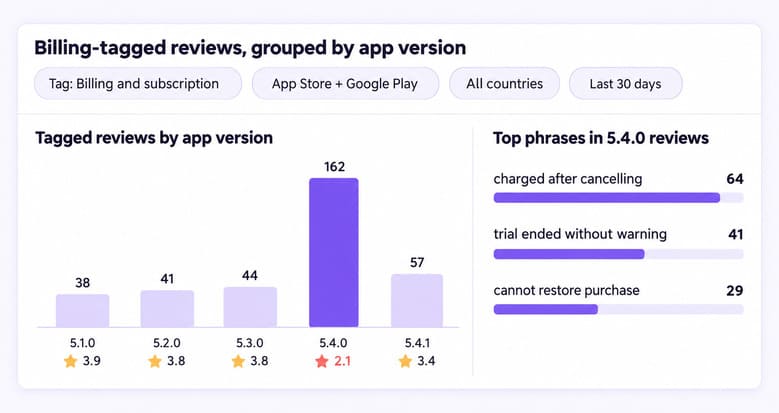
In this mock example, billing reviews jump from about 40 per version to 162 on 5.4.0, and their average rating falls to 2.1. The top phrase, "charged after cancelling", points to a renewal or restore bug, not a pricing decision. That becomes an engineering ticket today instead of a churn post-mortem next month.
The partial recovery on 5.4.1 shows whether the fix worked. For the performance side of a release check, see our guide to application performance metrics.
cta_get_started_yellow
Three mistakes that distort subscription metrics
Formulas rarely break a subscription report. What breaks it is what gets averaged together, or what gets left out. These three mistakes show up again and again.
Averaging weekly, monthly, and annual plans together
A blended churn number hides the plan mix. Imagine a team shifting users from annual to weekly plans. Blended monthly churn rises, and the team blames the product. In reality, nothing broke: weekly plans renew 52 times a year and simply give users more chances to leave.
Warning sign: blended churn looks stable while MRR slides, or the reverse.
Fix: report retention and churn per plan and per install cohort. Keep a blended line only for leadership, and never base a decision on it.
Treating billing failures as product churn
When a third of Android cancellations are failed payments, a single churn number sends the wrong team to work. Product runs onboarding experiments while expired cards quietly drain revenue.
Warning sign: churn rises with no change in engagement, often concentrated in a few countries or payment methods.
Fix: enable billing grace periods on both stores and track recoveries as their own line. On iOS, test Retention Messaging at the cancel step. Then watch reviews for "payment failed" and "can't restore purchase". Those users often have not decided to leave at all.
Reading churn without the reasons
Numbers without reasons produce the wrong hypothesis. A rise in cancellations after a redesign looks like a UX problem. The reviews may show it was a renewal email that never arrived.
Warning sign: the team debates causes in a meeting instead of quoting users.
Fix: put three inputs in one weekly view: Apple's cancellation reason, the Google Play cancellation survey, and tagged review volume by topic. Add what competitors' users say about price, too. A wave of "cheaper alternative" reviews on a rival's page is an early warning for your own voluntary churn.
"Break sentiment down by app version, market, rating, and topic, then compare the affected cohort with support contacts, cancellations, or another business metric your team owns."
Karen Taborda, Customer Growth Team Lead at AppFollow
Trace every churn or refund spike to the reviews behind it
When involuntary churn or refund rate jumps in App Store Connect, the next question is always the same: what happened? AppFollow answers it from the review side. Reviews from App Store and Google Play land in one feed, already tagged by topic, with the app version, country, and rating attached. Your team can see the likely cause the same day instead of waiting for the cohort to close.
The Reviews feed is where that work happens:
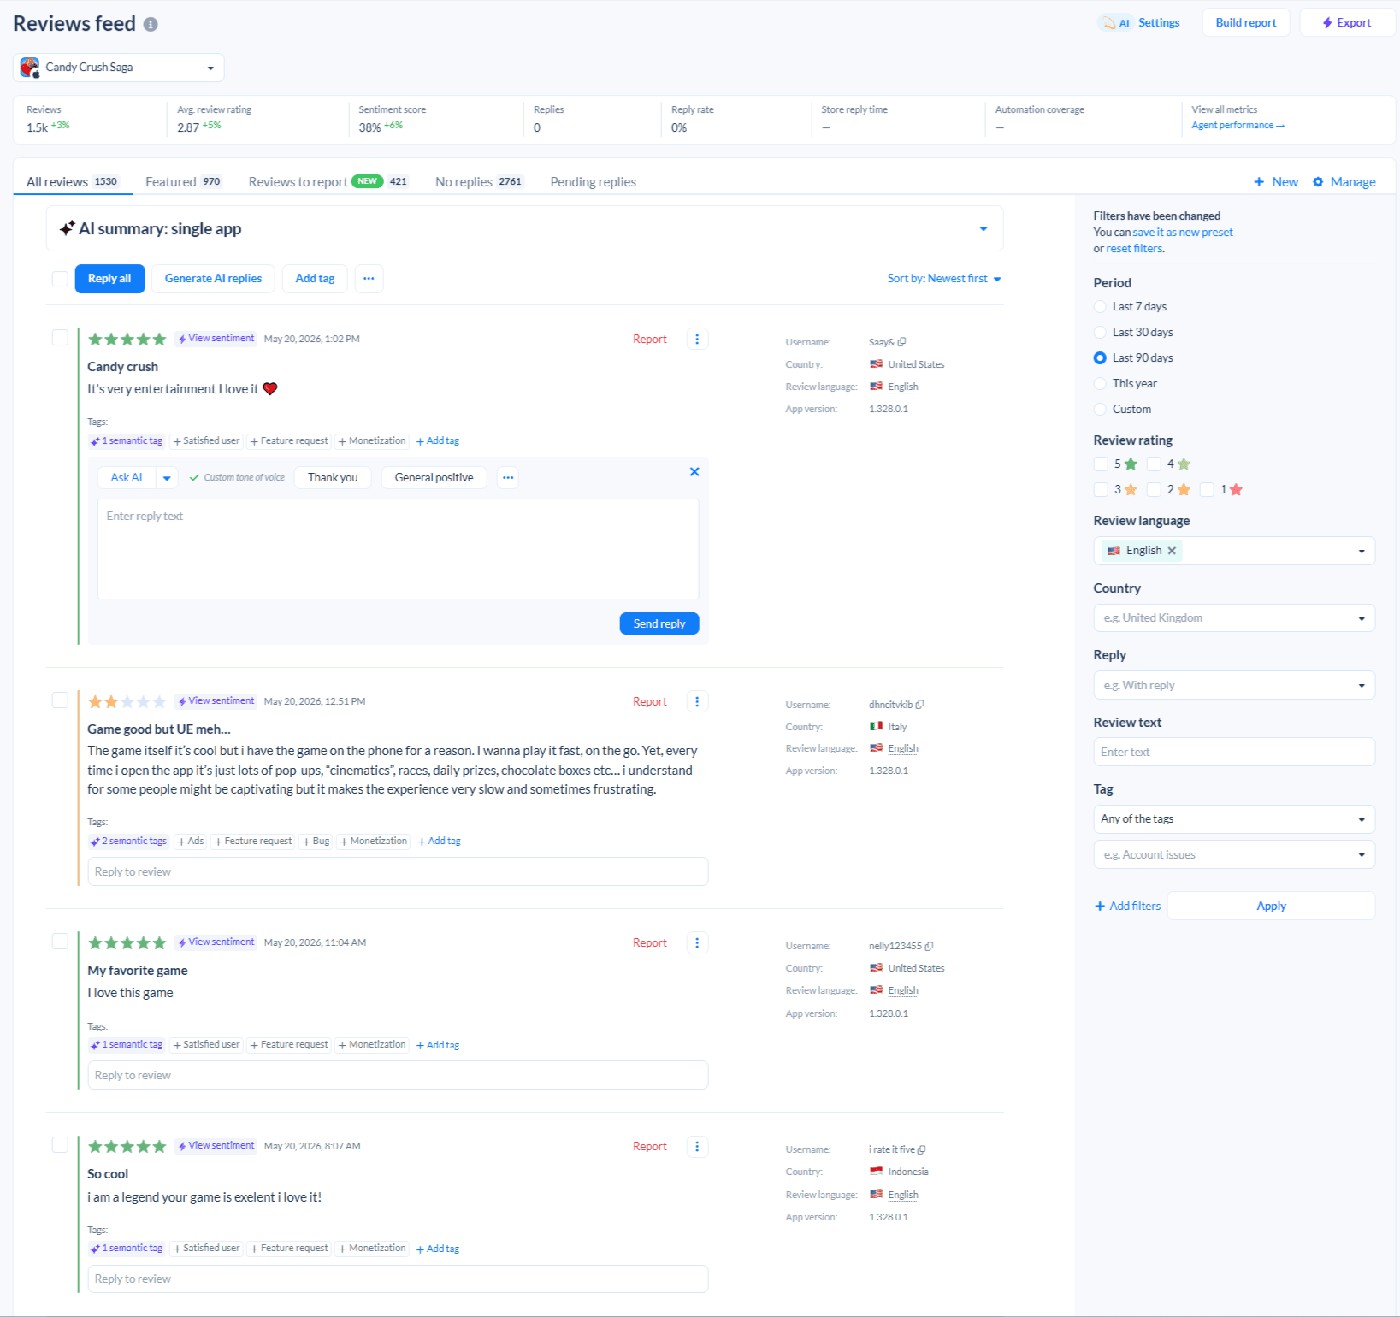
AppFollow Reviews feed, shown on a public app. Each review carries semantic tags, its app version, and country; filters sit on the right.
Look at the second review. It is two stars, complains about pop-ups slowing the app down, and is already tagged Monetization and Bug. That pairing is exactly what a subscription team wants to catch early: a monetization complaint that is really a product problem. The metrics row above the feed tracks reply rate, store reply time, and automation coverage, so you can see whether complaints like this get answered at all.
For billing complaints, the rule of thumb is to automate the routine and keep the risky cases human:
"Start with an eligibility matrix: repetitive, low-risk reviews can receive an approved automated response, while payment problems, account-access cases, safety concerns, and detailed bug reports stay with a human."
Ilia Kukharev, Product Manager at AppFollow
What helps most for subscription metrics:
- Semantic and custom tags for monetization, billing, refunds, and bugs, so every metric in your report has a matching stream of reviews.
- Alerts on 1-star spikes, sent to Slack or Microsoft Teams.
- AI replies with a support hand-off. Generate a reply in your tone of voice, or pass refund cases to Zendesk, Freshdesk, or Intercom for a person to resolve.
- Reports and exports to join tagged review counts with your App Store Connect or SDK data in one weekly report.
Semantic tags are available from the Team plan, and paid plans start with a 10-day free trial (AppFollow).
See the reasons behind your churn and refund numbers.
FAQ
What are the most important subscription metrics for a mobile app?
Start with five: trial-to-paid conversion, retention by plan, voluntary churn, involuntary churn, and refund rate. Together they show whether users convert, stay, and stay happy after paying. Add realized LTV and revenue per install once you buy traffic, because they tell you what an install is actually worth.
What is a good trial conversion rate for subscription apps?
The 2026 median is 25.6% across about 16,000 apps (Adapty). RevenueCat reports 25.5% for trials of four days or less and 42.5% for trials of 17–32 days. Compare yourself with apps in your category and trial length. A blended benchmark will mislead you.
How do you calculate subscription churn rate?
Divide the subscriptions that ended in a period by the active subscriptions at its start, then multiply by 100. Calculate it separately for weekly, monthly, and annual plans. Split the result into voluntary and involuntary churn, because the two need different fixes.
What is involuntary churn in app subscriptions?
Involuntary churn is a subscription that ends because a renewal payment failed and the store could not recover it. On the App Store, that means the 60-day billing retry window passed without success. It causes about 32% of cancellations on Google Play and 15% on the App Store.
What is a normal refund rate for subscription apps?
The median is 3.5% for non-AI apps and 4.2% for AI apps, according to RevenueCat's 2026 data. Rates above 12–16% sit at the top of the range. Watch your own baseline: a sudden rise usually tracks an unexpected renewal, an unclear price, or a broken feature.
Where can I find subscription metrics for iOS and Android apps?
App Store Connect and Google Play Console report trials, conversions, renewals, churn, and refunds. A subscription SDK such as RevenueCat or Adapty adds cohorts and realized LTV. For the reasons behind the numbers, read cancellation surveys alongside tagged app reviews from both stores.
How often should you review subscription metrics?
Review funnel conversion, churn by type, and refunds weekly, split by store and plan. Review MRR, realized LTV, and cohort retention monthly, because they move slowly. Watch reviews daily after every release: a billing bug shows up there first, often before any metric moves.