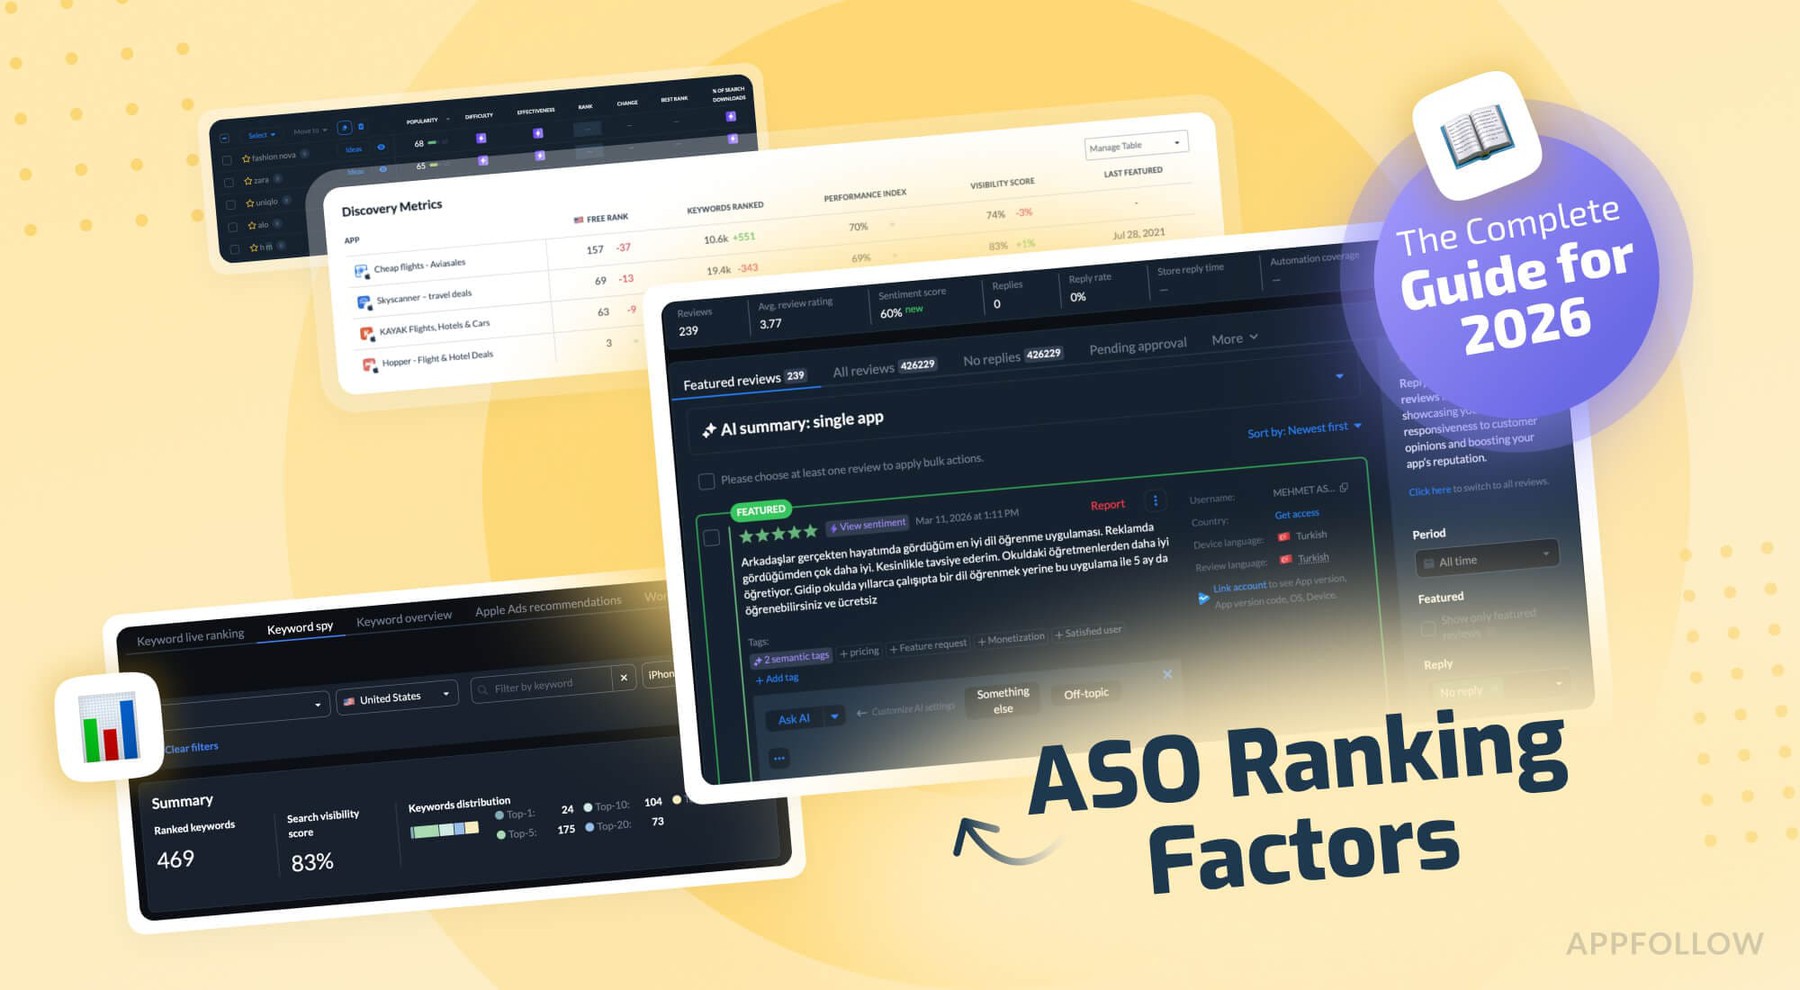
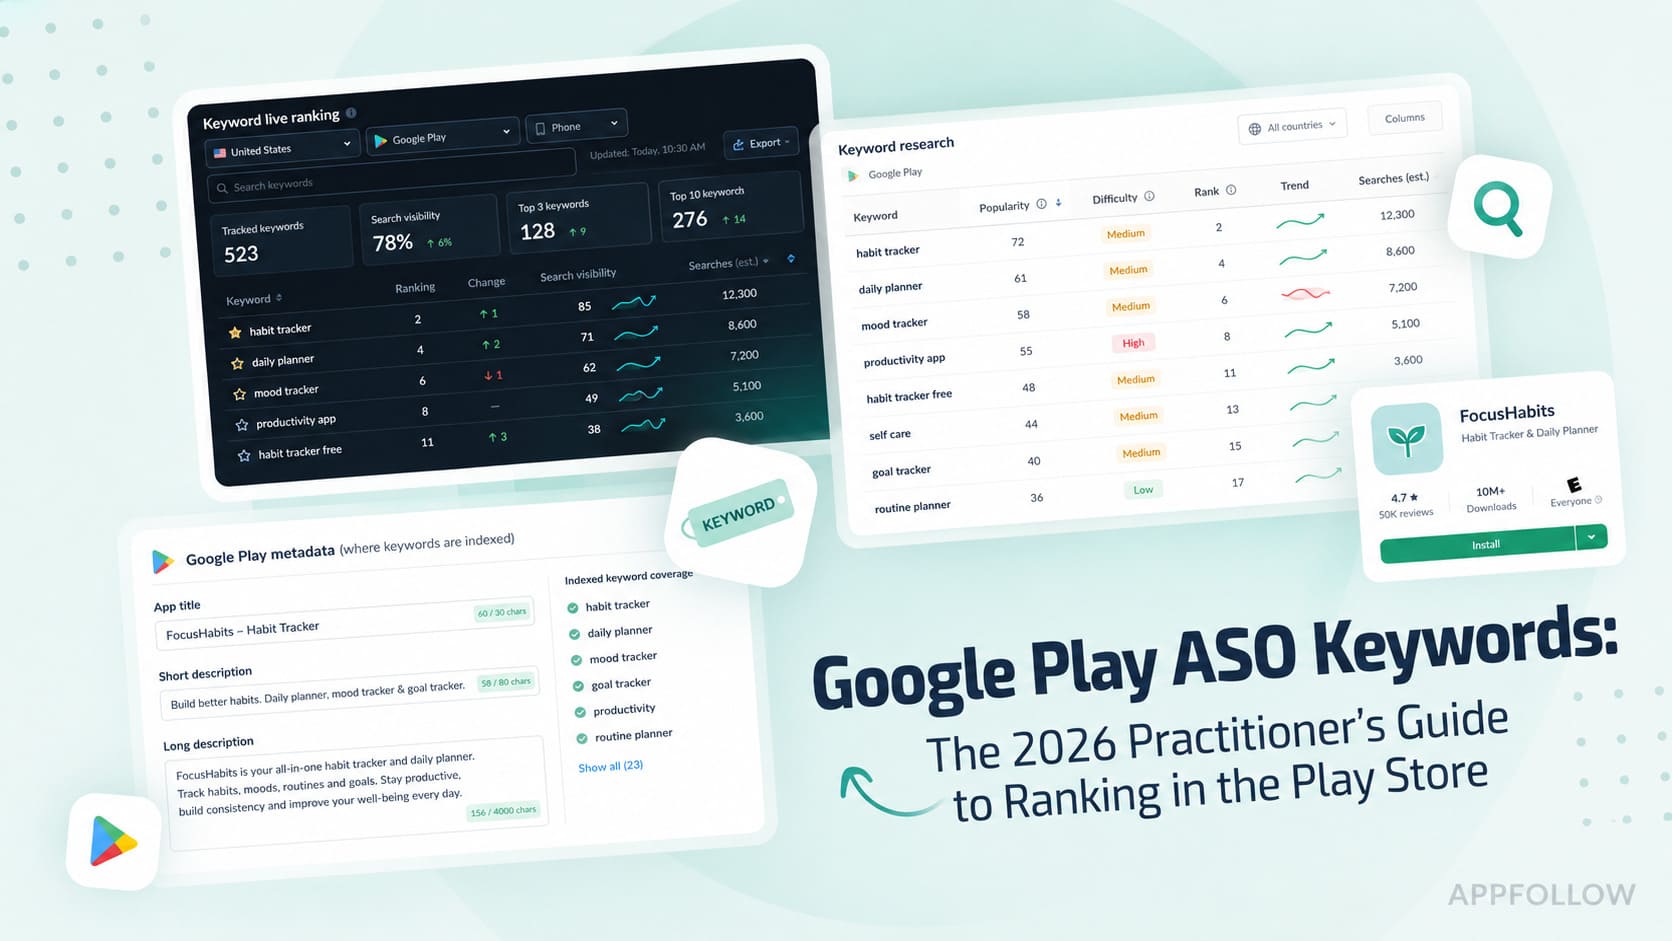
Mobile App Metrics: 30 Analytics KPIs to Track in 2026 (Part 1)

Table of Content:
Mobile app metrics are useful only when they tell a team what to do next.
Downloads show demand. Conversion rate shows whether the store page sells the promise. Retention shows whether users came back. Ratings and reviews show where the product is leaking trust. Revenue shows whether growth is worth paying for.
That is why this guide treats mobile app analytics metrics as an operating system, not a reporting list. For each metric, you need four things: the formula, the source, the check cadence, and the action trigger.
Use this page to choose the app metrics to track by stage: launch, ASO growth, retention, reputation, monetization, and release health.
For metrics that scale visibility over time, guide crisis management & recovery, and quantify product update impact, jump to Part 2 and 3.
| Mobile app analytics metrics are measurable signals from app stores, product analytics, attribution tools, crash reporting, and review platforms. They help teams connect store visibility, user behavior, product quality, and revenue into one operating view. |
TL;DR
Mobile app metrics are the KPIs that show how users discover, install, use, review, and pay for an app. The core set includes downloads, store conversion rate, keyword visibility, retention, active users, rating distribution, review volume, crashes, and revenue metrics. Track them by lifecycle stage, not as one noisy dashboard.
Mobile app metrics at a glance: 30 KPIs by growth stage
A useful metrics page should not make a team guess where to start. Use this directory as the working map. Pick the stage that matches your app right now, then build the dashboard around the signals that change a decision.
The formula matters. The source matters. But the real test is simpler: when this number moves, does someone know what to check next?
| Metric | Formula/source | Check cadence | Red flag |
|---|---|---|---|
| Downloads / installs | Total downloads, first-time downloads, or install events by country/category | Daily during launch; weekly after | Installs rise but quality drops |
| Store listing visitors | App Store product page views or Play Console store listing visitors | Daily during ASO tests | Visitors rise, installs do not |
| Acquisition source split | Installs by channel, campaign, country, and source | Weekly | One source drives volume but weak retention |
| Cost per install | Ad spend / installs | Daily during paid campaigns | CPI rises while conversion stays flat |
| Store conversion rate | Installs or downloads / product page views × 100 | 24–72h after metadata or creative updates | Traffic grows but installs stall |
| Impression-to-install rate | Installs / store impressions × 100 | Weekly | Impressions rise without install lift |
| Product page conversion by country | Installs / product page views by country | Weekly | One locale underperforms after translation |
| DAU | Users active in one day | Daily / weekly | DAU drops after release |
| MAU | Users active in rolling 28 or 30 days | Weekly | MAU grows but DAU stays flat |
| DAU/MAU stickiness | DAU / MAU × 100 | Weekly | Lots of users, weak repeat use |
| Sessions per user | Total sessions / active users | Weekly | Sessions fall after UX change |
| Feature adoption | Users using feature / eligible users × 100 | Weekly after launch | Feature shipped, nobody uses it |
| D1 retention | Users active day 1 / new users × 100 | Weekly by source/version | New users disappear after first session |
| D7 retention | Users active day 7 / new users × 100 | Weekly by source/version | Paid traffic grows, D7 drops |
| D30 retention | Users active day 30 / new users × 100 | Monthly | Strong launch, weak long-term habit |
| Churn rate | Lost users / starting users × 100 | Weekly or monthly | Churn rises after pricing/release change |
| Uninstalls / user loss | Store or product analytics loss signals | Weekly | Spike after version update |
| Average rating | Store rating over selected period | Daily after releases; weekly after | Average drops after release |
| Rating distribution | Share of 1-star to 5-star ratings | Daily after releases | 1-star share jumps before average moves |
| Review volume | Incoming review count by app, country, version, and topic | Daily after releases/campaigns | Review spike with negative sentiment |
| Review sentiment | Sentiment by topic, version, country, and language | Weekly | Topic turns negative after release |
| Reply rate | Reviews replied to / reviews received × 100 | Weekly | Low reply coverage on critical reviews |
| Keyword rank | Position for tracked keywords | Daily during metadata tests | Top 10 term drops to top 20 |
| Search visibility | Weighted visibility across tracked keywords | Daily during ASO tests; weekly after | Visibility drops while installs lag later |
| Category rank | Store category/chart position | Daily during launch | Rank rises but installs stay flat |
| Featured placements | When and where the app was featured | Daily during launch windows | Feature ends and installs fall sharply |
| Crash rate | Crashes / sessions or users | First 72h after release | Crash spike by version/device |
| ANR rate | ANRs / sessions or users | First 72h after Android release | ANRs rise on one OS/device group |
| ARPU | Revenue / active users | Weekly | Revenue flat while users grow |
| ARPDAU | Daily revenue / DAU | Daily during pricing tests; weekly after | Engagement holds, revenue per user drops |
| Purchase conversion | Paying users / active users × 100 | Weekly | More traffic, fewer buyers |
The core mobile app analytics metrics to track from day one
I’ve seen too many teams chase flashy metrics while ignoring the stuff that moves growth. So in this section, I’m walking you through the exact metrics AppFollow clients lean on when they want to catch momentum early, fix problems fast, and prove what’s working without the guesswork.
Downloads & Installs Trends (by Country & Category)
This is the app metric I go to when teams tell me their numbers “feel off” but can’t say why. It tracks how many installs your mobile app gets, estimated daily, across every country and every category you’re listed in. What makes it so useful isn’t the total number. It’s the patterns. Spikes, dips, flatlines. Where they happen. When. What they coincide with.
The Appfollow engine factors in how ranking translates to real install activity for similar apps, in that category, in that region, and projects your app’s share based on current position.
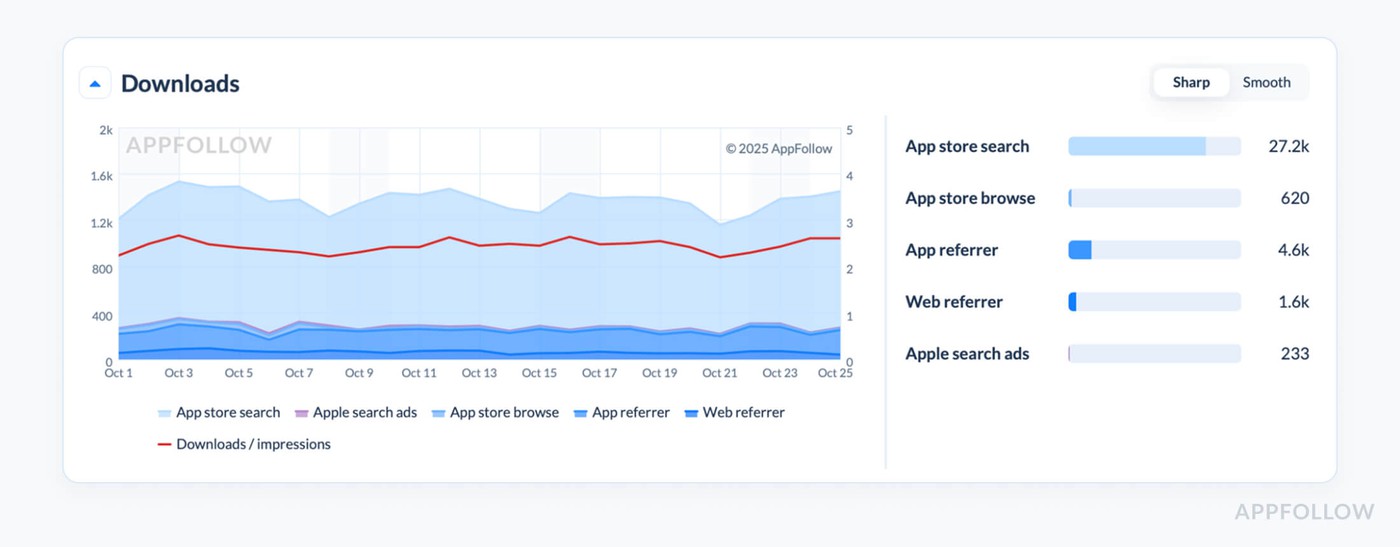
Downloads info in AppFollow. Test it live with a 10-days trial.
One AppFollow client launched a new onboarding flow for their productivity app. They were tracking at #36 in “Business” (Germany), pulling ~1,200 installs/day. After the update, they jumped to #18. Within 48 hours, download estimates hit 2,900/day. Same region, same category, just sharper conversion meeting better visibility.
What mattered most? Their marketing team caught the lift early and paused paid traffic in Germany. Why pay for what’s working organically? That one shift saved them $11K in the campaign cycle and proved the onboarding tweak worked before retention data even came in.
This is one of the most important metrics when you need to move fast. It’s your signal layer, before your CRM, product analytics, or internal dashboards even have session data synced.
Average Rating & Distribution Over Time
In a consultation with our app store expert an Appfollow client said: “Our average rating’s still 4.6, so we’re good, right?”
We pulled up their Average Rating & Distribution Over Time in AppFollow, and yep, their badge looked fine.
But the distribution behind that average? Quiet disaster. Daily 1-star reviews had jumped from 8% to 38% in the last two weeks. Their incremental rating had slipped to 3.7, and no one noticed, because the average hadn’t moved yet.
That’s the trap. This metric shows your star average and how your ratings break down over time, how many 5s, how many 1s, and whether your customer sentiment is solid or slipping.
AppFollow tracks it like this:
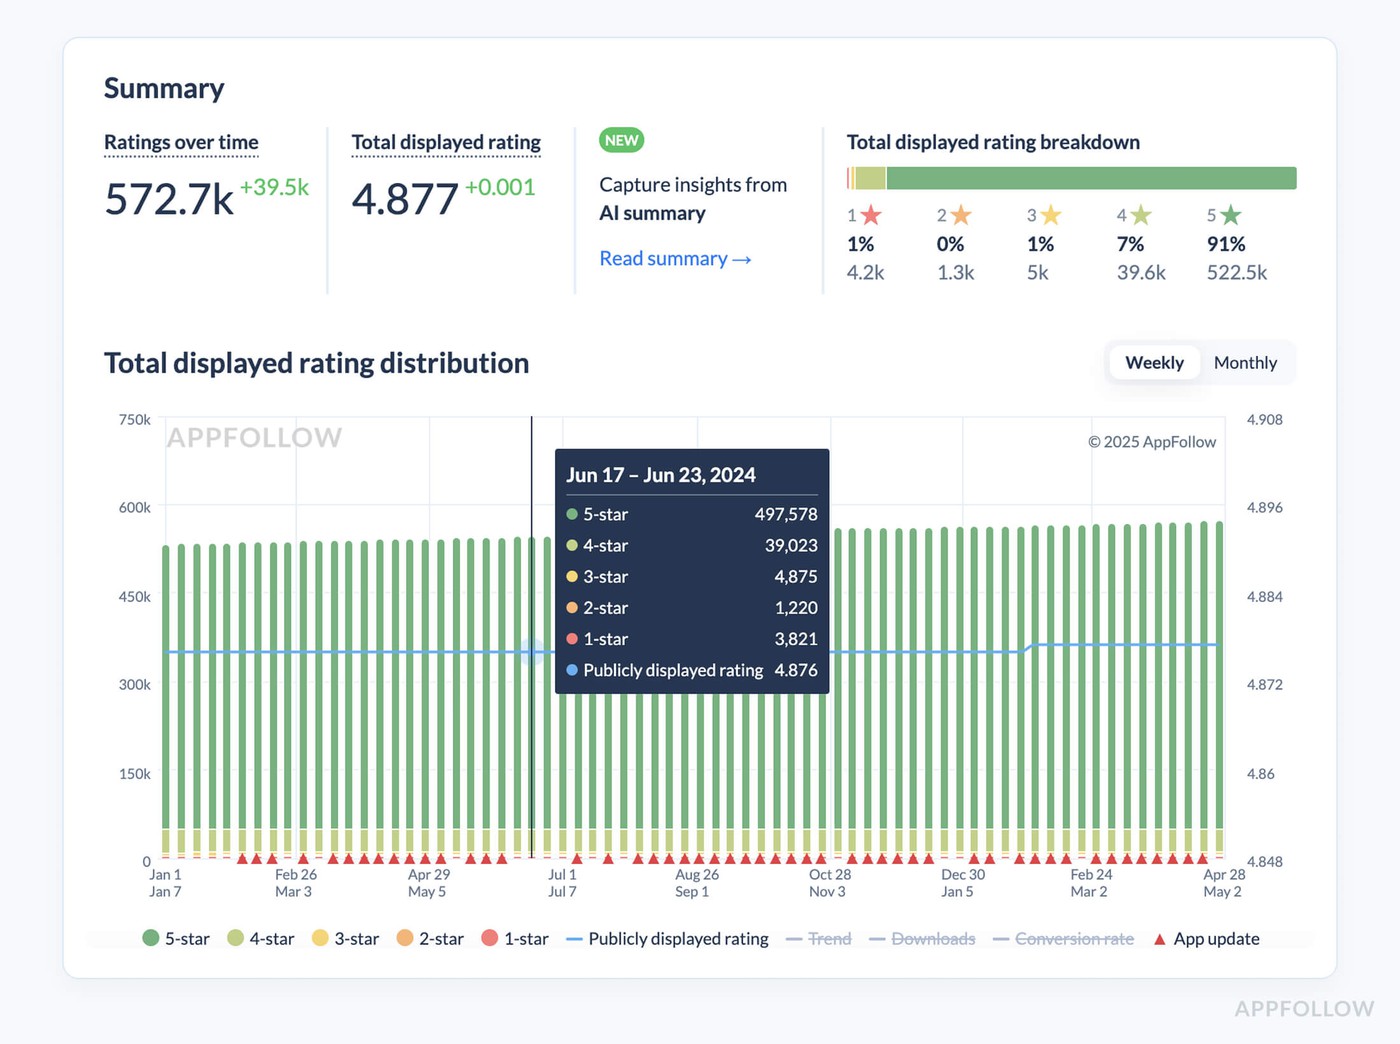
App rating dashboard in AppFollow. Test it live with a 10-days trial.
Simple, but deceptive if you don’t track the trendline and daily spread.
In this case, that team had pushed a new login flow. It was buggy for certain Android versions, but no one caught it. Within seven days, installs dropped 5.6K across the US and Brazil.
They spent an entire sprint guessing why their conversion dipped. Had they been watching the distribution, they would’ve caught it five days earlier, and saved $11K in paid UA that went straight into a leaky funnel.
Ilia Kukharev, Product Manager - all product-related:
“Don’t just look at the badge. Watch how it’s built. I’ve seen 0.3-point dips in incremental rating over 14 days lead to a 15% drop in conversion, especially in high-churn verticals like health or application KPIs tied to subscription funnels.”
Daily alerts are best. Appfollow can ping your team when rating changes, for example:
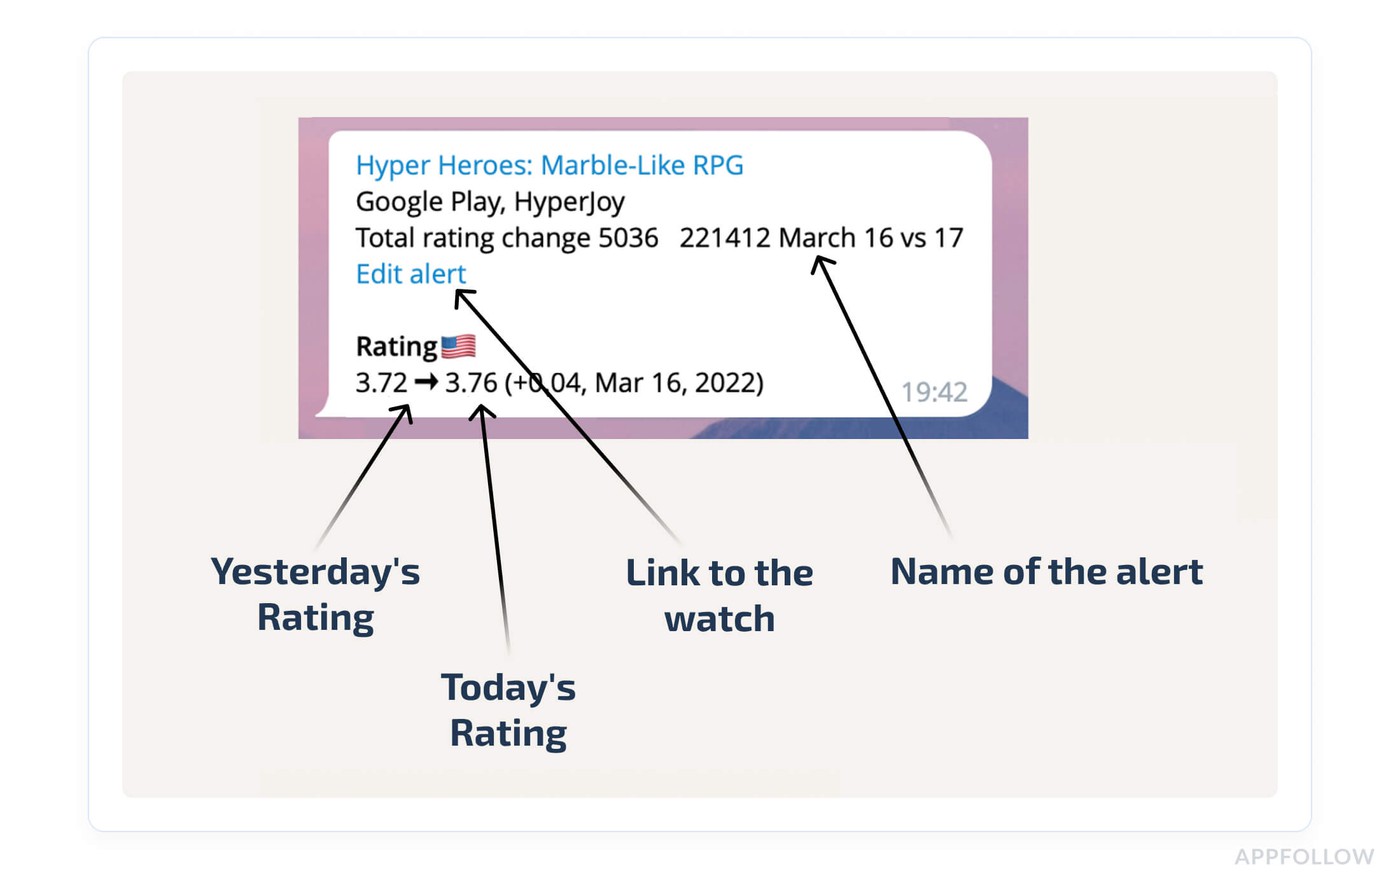
That alert? It’s the early-warning nudge to rework support flows before those reviews hit your bottom line.
Reviews Count & Incoming Volume
The first thing I look at after a feature release isn’t installed. It’s Reviews Count & Incoming Volume. If users love or hate something, they won’t wait for your survey, they’ll head straight to the store and say it loud.
This metric tracks how many new reviews your app receives each day, broken down by country, platform, and version. You see the total count building over time, and more importantly, the incoming volume, that live stream of feedback that shows whether people are engaged, annoyed, or totally lost.
AppFollow shows it like this:
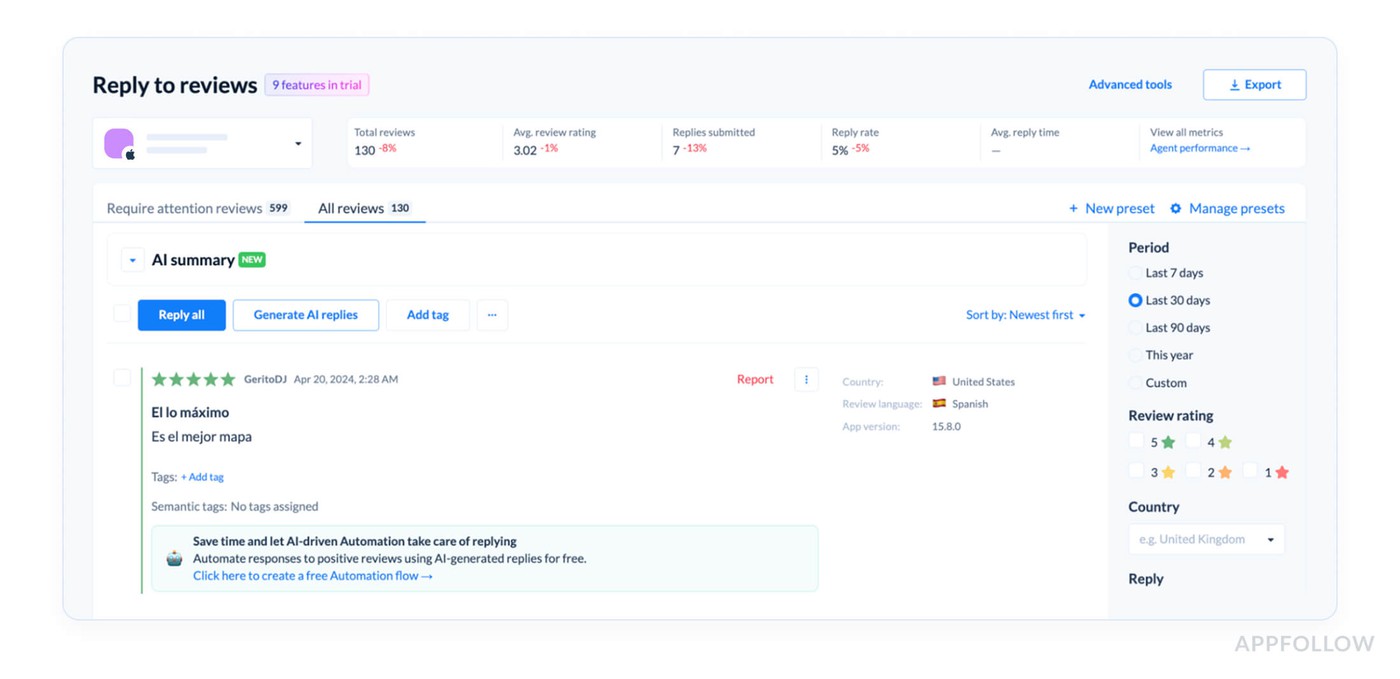
Reviews summary in AppFollow. Test it live with a 10-days trial.
It’s raw, timestamped, and fully filterable by star rating, sentiment, keyword, or tag.
Here is how it works in real life:
One AppFollow client rolled out a new onboarding flow on a Monday. Total review count looked fine, but incoming volume in the US dropped 42% in four days. No spike in negatives, just silence.
That drop told us users weren’t sticking around long enough to review. A survey confirmed the flow was too long. They rolled it back by Friday and avoided a visible rating dip.
Here’s what Appfollow experts advice to watch:
- Volume drops in key markets
- Spikes tied to new versions
- Flat review flow during peak UA spend
If review volume slows down, engagement is already fading. And if your product or CX teams aren’t hearing from users, they’re building in the dark.
Metrics to track when launching for discoverability
If you're about to launch, or relaunch, your app, this is where the real groundwork happens. Because discoverability isn’t luck. It’s timing, keywords, rankings, and making sure the right users see you. These are the mobile app analytics metrics that set you up for visibility from day one.
We’ve worked with teams that nailed their onboarding and design but forgot to monitor keyword rankings until week three… by then, the App Store had already buried them. So in this part, I’m breaking down the metrics to track right when you launch, so your app doesn’t just exist, it gets found.
Let’s get you seen.
Category & Chart Rankings
When your mobile app goes live and installs start trickling in, the first signal I look at isn’t revenue or retention. It’s Category & Chart Rankings. Because that’s where you find out how your launch is landing in the App Store ecosystem, whether the store sees you as something worth surfacing, or background noise.
This metric tracks your app’s position in the store’s top charts, sliced by category (like Health & Fitness, Finance, or Games) and by chart type, Free, Paid, Grossing, and Trending. It’s based on relative performance: how your install velocity stacks up against other apps in the same category and region.
For example, we had a client who launched a meditation app in Germany. Day one, they landed at #52 in “Health & Fitness.” By day three, after optimizing screenshots and swapping in localized subtitle keywords, they broke into the top 30.
That change drove a 22% spike in organic installs, purely from visibility boost. No extra ad spend.
Here’s what Appfollow experts always recommend:
- Check daily during launch week, then 2–3x/week post-launch to catch early movement.
- Watch for the top 50 in your primary category, breaking that usually correlates with a meaningful organic lift.
- If your rank is stuck >100 after day 3, revisit your metadata. One fix we’ve used: “If your KEI > 50 for 'photo editor,’ swap in ‘selfie editor’ and re-track for 48 hours.”
As Yaroslav Rudnitskiy, Senior Professional Services Manager - ASO guru - says:
“Set a chart rank alert in AppFollow when you hit top 50 in a target category, ideally on Day 1–3 of launch.
That’s your signal to stop scrolling dashboards and start documenting. Screenshot your store page, review your creative stack, and grab user quotes from early reviews. That moment of visibility is short, but it gives you proof of what’s resonating.
Lock in the messaging, push the winning creative to paid channels, and pause anything that’s underperforming. You don’t get clean momentum like that twice.”
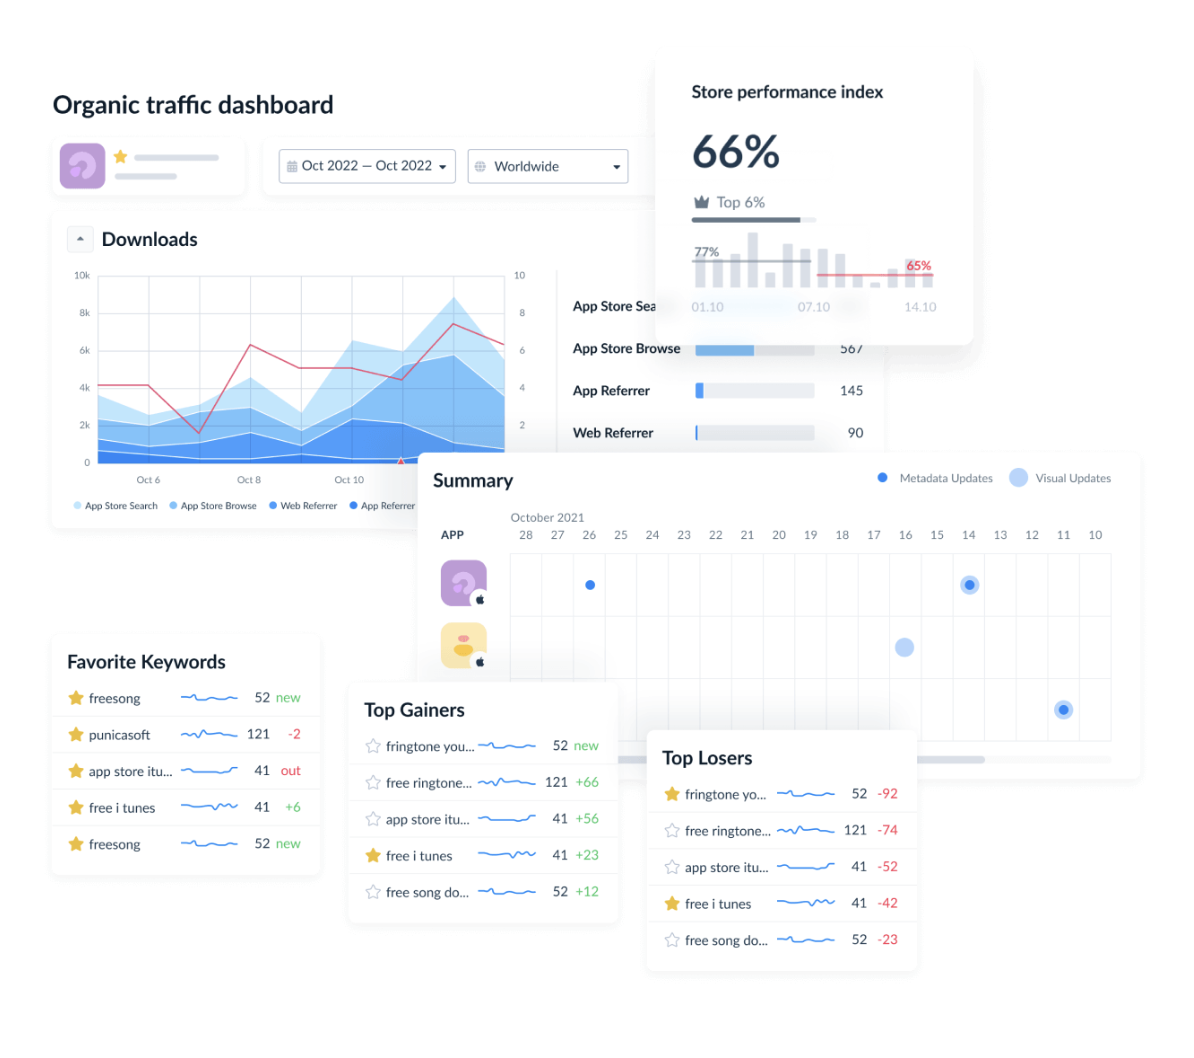
Featured Apps Timeline (when/where you appeared)
When a launch hits the App Store and installs start moving, I don’t just look at rankings. I check if Apple or Google noticed. That’s where the Featured Apps Timeline metrics comes in. It tracks exactly when, and where, your app was featured across App Store or Google Play collections: “Apps We Love,” “Editor’s Choice,” “This Week’s Picks,” and all the regional, seasonal, and category-based slots.
This metric logs every appearance in curated sections by date, country, device type, and collection title. You’ll find it in AppFollow under:
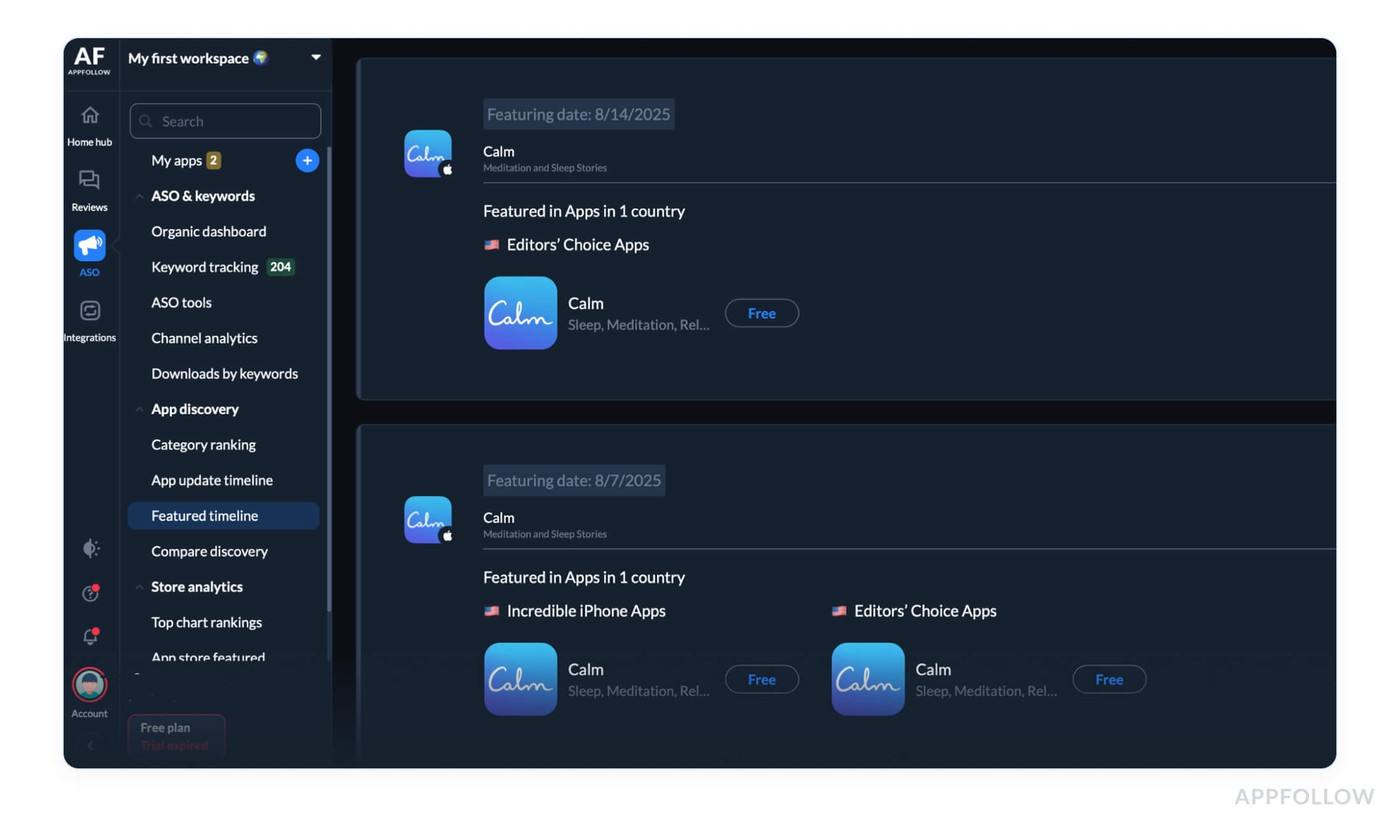
Featured timeline in AppFollow dashboard. Test it live with a 10-days trial.
There’s no formula; this one’s pulled directly from store scrapes and matched to your app ID in AppFollow’s data stream. But the value’s in what you do with it.
Real example from the field: Our client got featured in the Today tab in France without realizing it. They were too busy reviewing keyword ranks. Meanwhile, organic installs jumped by 63% in 48 hours, and UA kept spending at full throttle.
Once we surfaced the feature, they paused spend, saved $7.4K, and used the reviews from that period to update their store creatives.
What to watch for when tracking featured timeline:
- Spikes in category, Today tab, or geo-specific collections
- Short appearances (1–2 days) that don’t repeat, those are tests
- Repeated slots across regions, those are winners
Best practices on how to act on the data:
- Check daily during launch week; weekly after
- Use “Featured in 2+ countries in 3 days” as a benchmark to escalate creative analysis
- If featured, pause paid UA in that region for 24 hours and redirect spend to weaker markets
Ilya Kataev, Professional Services Team Lead:
“Set a real-time alert in AppFollow for featured placements, the second your app shows up in a curated slot, you want to know. That’s your proof-of-message moment. The store just picked your app out of hundreds to showcase.
Why? The visuals hit. The subtitle hit. The recent reviews hit. Whatever it was, it worked. Grab that data before it scrolls off the shelf.”
On a live session, Ilya usually walks app marketing teams through it like this:
- Save a screenshot of the store layout where your app appeared.
- Pull the exact version and metadata that was live during the feature.
- Export the reviews and ratings from those dates, what users saw is what they responded to.
- Hand that combo to your growth team, so they can use it as a baseline for future launches or paid UA creative.
And if you're getting featured in multiple countries over the same 72-hour window? That's your A/B test, but paid for by the App Store.
Because nothing says product-market resonance louder than a curated spotlight. And when you catch it in real time, you can react like a pro team, not like you're reading about it two weeks later in your App Store Connect stats.
Mobile analytics metrics for driving search growth
If you're trying to grow search traffic, you don’t need a miracle, you need the right mobile analytics metrics and a plan that works.
Not someday. Not next quarter. Right now.
Because search visibility doesn’t just depend on keywords. It’s your app’s reviews. Your star trend. Your metadata. It’s how the algorithm decides if you’re worth showing, or skipping.
In this part, I’m breaking down the KPIs that move your app up the results screen, the feature signals that trigger visibility boosts, and the best practices I’ve seen AppFollow clients use to climb faster, smarter, and with way less guesswork.
Let’s get into it.
Keyword Popularity Score (search volume proxy)
The first thing I check before recommending any keyword is the Keyword Popularity Score. Because if no one’s searching for it, ranking won’t move your needle. This score estimates how often users are typing a term into the App Store or Google Play. It’s a demand signal. And when you're building your visibility strategy, demand is the first lever.
In AppFollow, you’ll find it under ASO → Keyword Tracking:
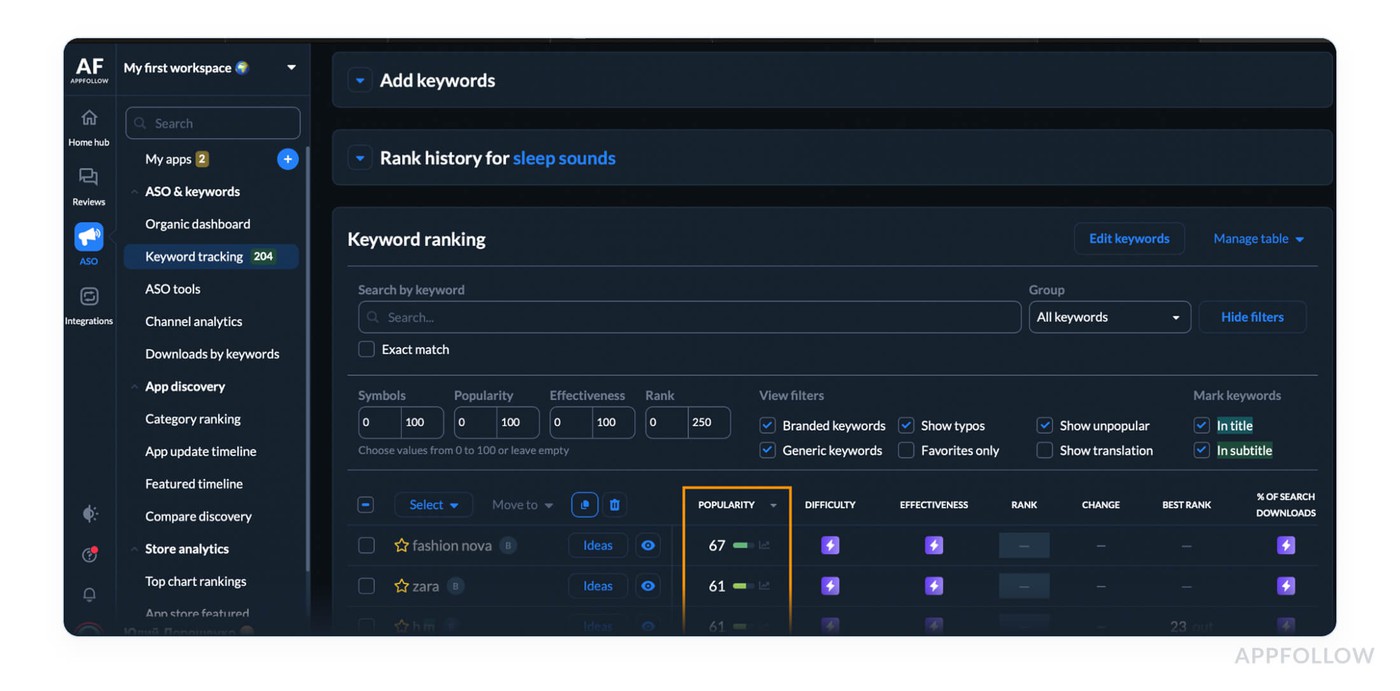
Keyword tracking in AppFollow dashboard. Test it live with a 10-days trial.
One client in the wellness space had “calming noise” in their title. It sounded perfect, but scored a 46. We replaced it with “sleep sounds” (score: 87), updated the metadata, and saw keyword-driven installs rise 38% in two weeks, with no change in budget or creative.
What does mobile app marketing experts pay attention to:
- Scores below 40 tend to underperform unless they’re highly relevant
- Anything above 70 has search volume worth chasing, if your app can rank
- Big drops in score often signal seasonal traffic shifts or a changing trend
Some insights on Keyword Popularity Score from Appfollow users:
- Check it weekly, non-negotiable. Every time you touch your metadata, check the score first. Don’t refresh your subtitle or long description blind. Open AppFollow, scan your top 10 tracked keywords. If any score has shifted ±10 points since your last update, you adjust. No “set it and forget it.”
- 60+ means it’s worth fighting for. If a keyword scores above 60 and matches your feature set, it stays. That’s your power lane. Anything below 50? That’s a maybe. Low-score keywords can work, but only if they’re high-converting or branded. Otherwise, they eat space. Trim them.
- 15-point drop? Swap, don’t wait. If a keyword loses 15+ points in one week, don’t “keep an eye on it.” Replace it with a higher-scoring synonym. Example:
→ “Sleep music” dropped in customer search from 73 to 58
→ “Sleep sounds” holds steady at 82
You swap, publish, and track impact for 72 hours. No loyalty to dead weight.
Keyword Difficulty Score (competition level)
Keyword Popularity tells you what users are looking for. Keyword Difficulty Score tells you where the landmines are. It measures how fiercely a keyword is being fought over, how many apps are targeting it, how strong their rankings are, and how long they’ve held their positions.
Inside AppFollow, you’ll find it in ASO → Keywords Tracking:
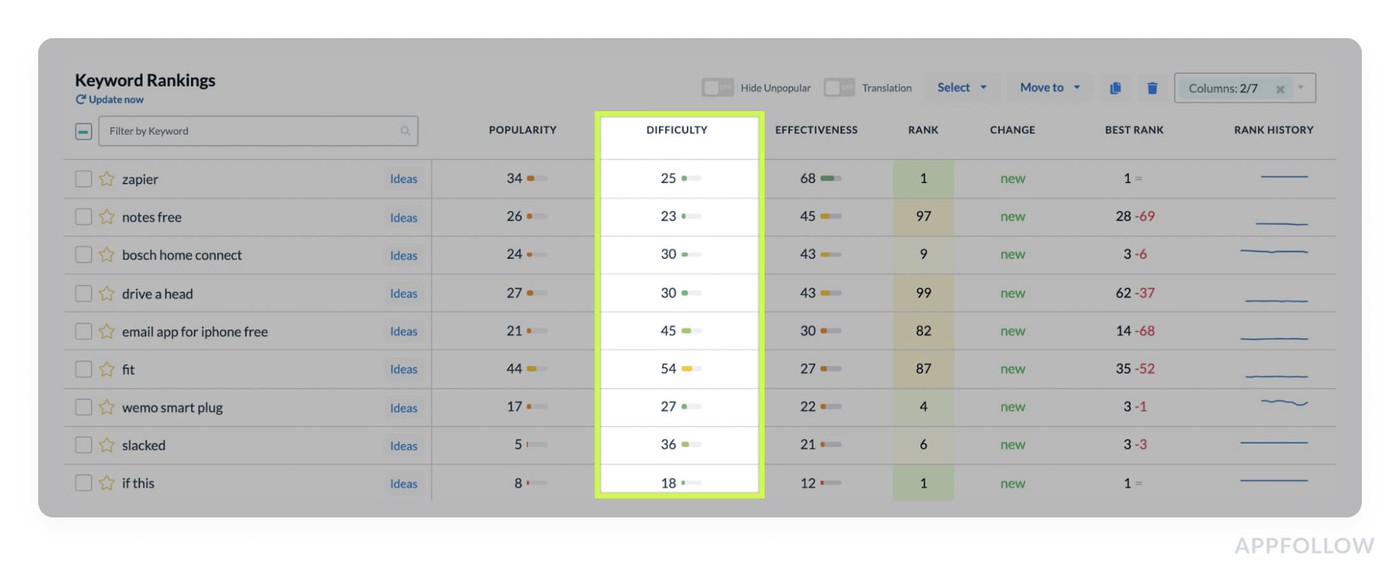
Keyword tracking in AppFollow dashboard. Test it live with a 10-days trial.
The formula accounts for who’s ranking and why they’re ranking, strong download momentum, consistent engagement signals (like session duration and retention), and deep review velocity.
So if you're targeting “fitness app” with a difficulty of 88, you're competing with giants who've locked their spot with years of velocity and tight onboarding flows.
Thus, we had a wellness startup user who pushed “fitness app” in their subtitle and couldn’t crack rank 90, despite a solid 4.6 rating and 6,000 installs/week. They swapped to “HIIT workouts” (difficulty: 63), updated screenshots to show fast results, and hit rank #18 in five days. No extra budget. Just less friction.
Here some advice from Appfollow experts:
- Check these iOS app metrics during every metadata update, every new market rollout, and every time you plan a keyword test. Difficulty is dynamic, rankings shift, trends fade, and competitors leave gaps.
- Avoid anything above 75 is a high-risk bet. You're entering a fight with apps that have:
- ≥4.5 star average
- >100K installs
- Feature-based metadata tuned to conversion
Unless you're already holding page-one terms, go for something mid-tier.
- Tactical move: Difficulty >80? Filter related terms with KEI >40 and Difficulty <70.
→ “Step tracker” = 84
→ “Daily steps app” = 62
→ Action: Swap, publish, remeasure after 72h.
Veronika Bocharova, Customer Success Manager:
"Most teams obsess over popularity, but growth happens in the difficulty gap. Track those mid-score keywords where your metadata can shine. And always set alerts for when your competitor drops out of a top position, those changes are your backdoor to visibility."
Search Visibility Score (share of search results)
Search Visibility Score is your north star when tracking discoverability across all keywords at once. It quantifies how visible your app is in the search results, not for one term, but your entire keyword cluster. It’s your total presence across everything you’re targeting, rolled into a single, watch-it-daily number.
In AppFollow, you’ll track it like this:
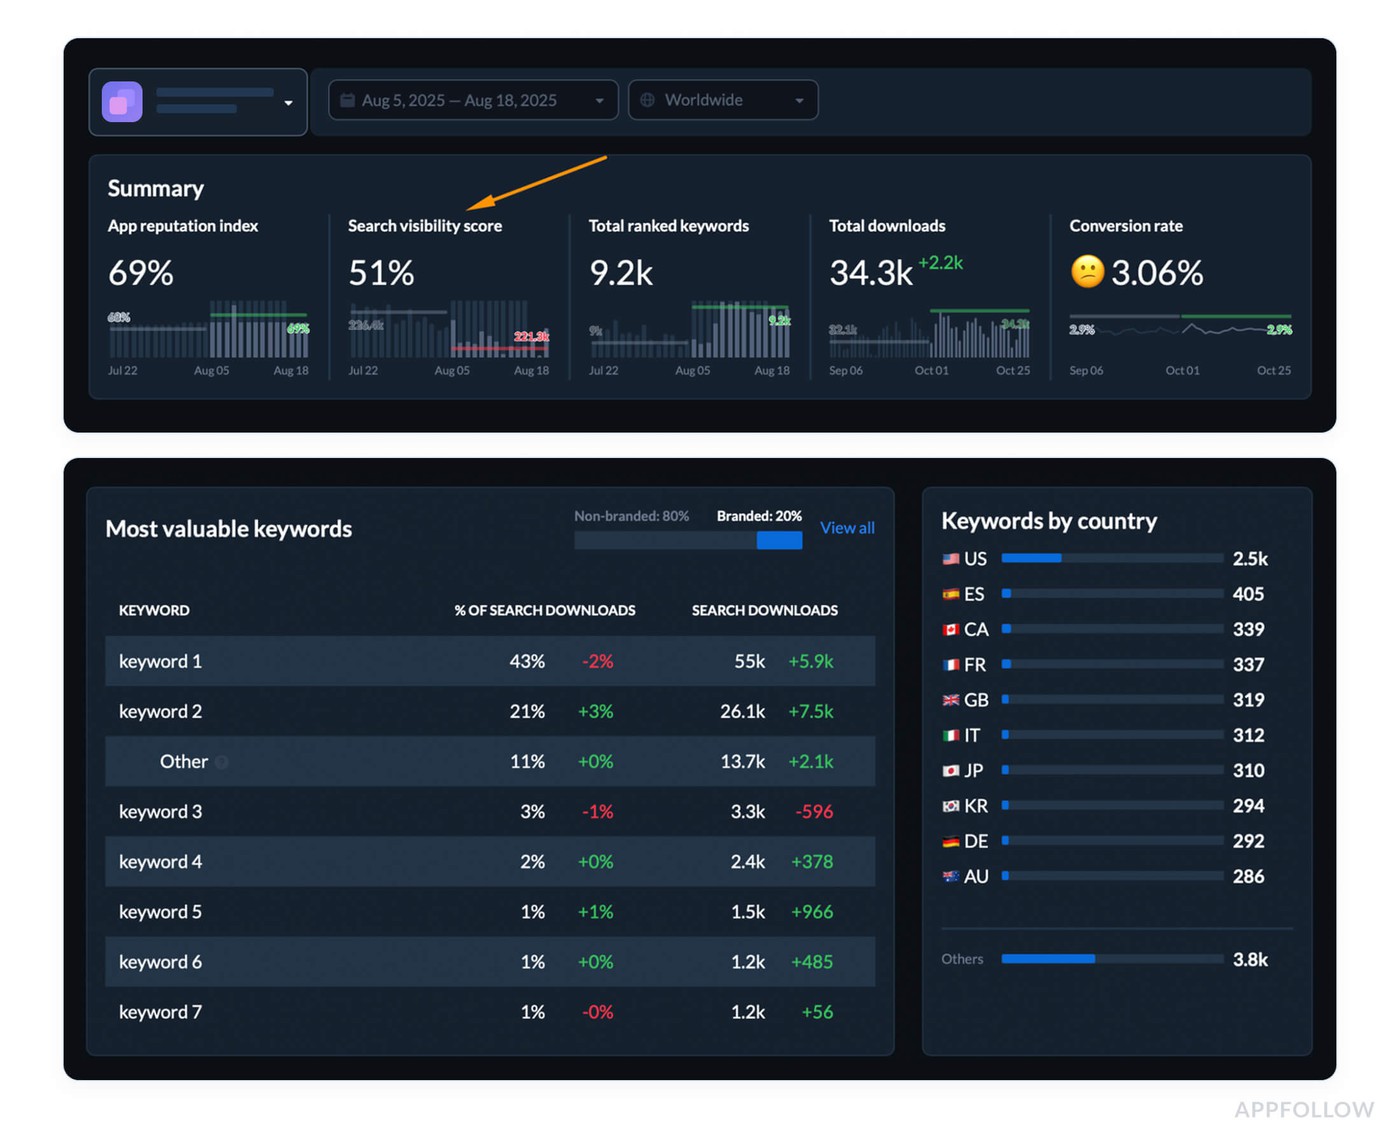
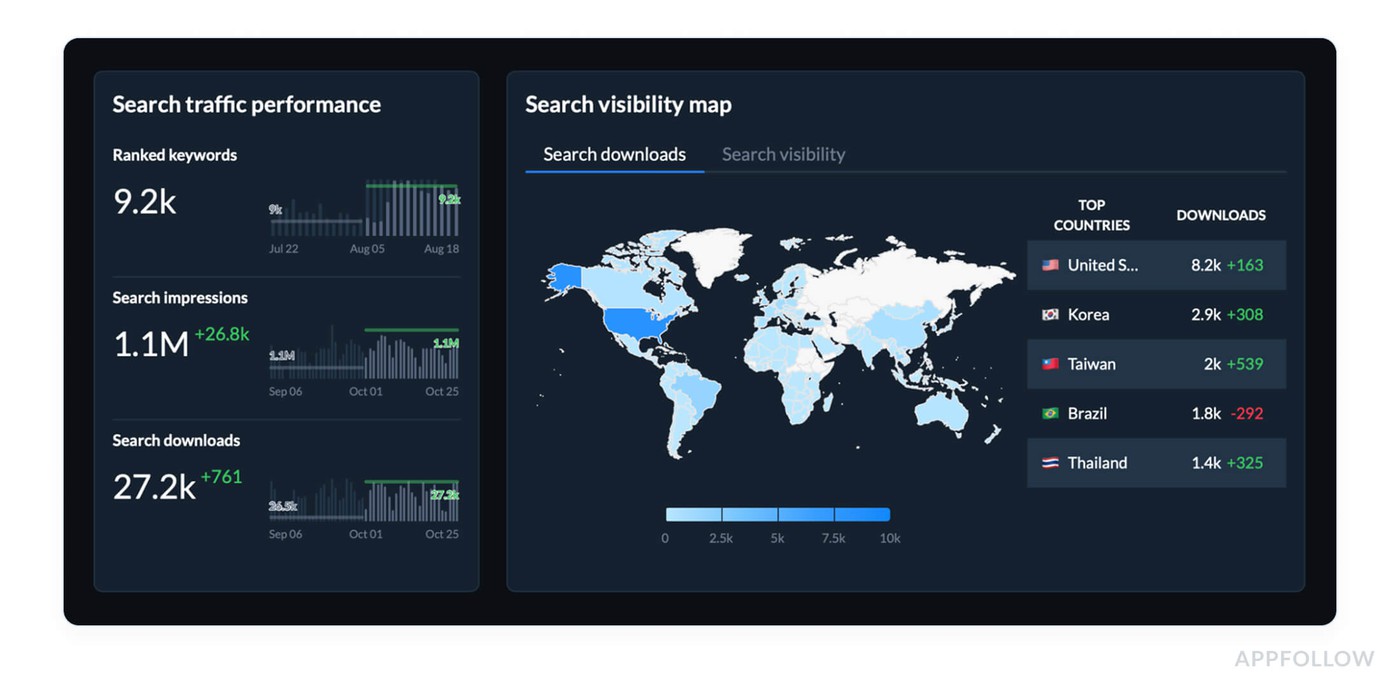
Search visibility analysis in AppFollow dashboard. Test it live with a 10-days trial.
Each keyword is weighted by its rank range:
- Top 1–3 = heavy value,
- 4–10 = medium,
- 11–20 = light,
- 20 = drag on score.
The more keywords you're ranking in top slots, the higher your score. The more you sink past #20, the faster your visibility leaks.
How often to track Search Visibility Score? Refresh it daily during launches and ASO updates. Weekly for stability periods.
Benchmarks:
- 70+ = top-tier visibility
- 50–69 = stable but improvable
- <50 = likely metadata or keyword match issues
If 70%+ of your keywords rank below #20, strip & refocus. Drop underperformers, cluster similar mid-difficulty terms, and re-track after 72h.
Lucija Knezic, Senior CSM & Product Strategy Manager:
"It’s better to set visibility alerts on tracked keyword groups. If your visibility score drops more than 5 points in 48h, flag the top fallers, tie them to recent updates, and dig. Usually, it’s a metadata conflict, a store algorithm shift, or you’re getting edged out by a competitor with fresher creative. Don’t wait till conversion tanks."
Automate your insights with AppFollow
AppFollow turns raw store data into decision-ready insight, syncing analytics with the cadence of your release train.
Every signal maps back to your mobile app lifecycle from submission to rollout. You see how real users discover, convert, and complain in near real time. Priority metrics are surfaced automatically, so you can act without digging.
At a glance, you’ll monitor category ranks, keyword visibility shifts, featured placements, country-level download estimates, conversion benchmarks, rating analysis, sentiment auto-tags, reply effect, and competitor discovery. When you need more depth, wire in ratings velocity, review volume trends, and alert rules so no spike slips past your observability radar.
Everything lands on the Dashboard; drill into granular review tracking, metadata compare grids, and live ASO keyword cohorts with historical context. Overlay updates with session curves to connect cause and effect. Tie store movement to downstream revenue with a couple of clicks. Share focused snapshots with marketing for fast creative and UA pivots.
What you get out of the box:
- Category & top-chart tracking
- Keyword ranks, search visibility, and feature alerts
- Download estimates by country/keyword
- Conversion benchmark and funnel drop-off views
- Average rating, incremental stars, sentiment + auto-tags
- Reply-effect and review-status workflows
- Deleted-review logs for stealth churn
- Compare Discovery & Compare Metadata grids
- Webhooks/exports to feed your APM or BI stack
- Custom alerts on any performance spike for 24/7 observability
Together, those pieces cover the core application performance monitoring metrics you need, ranking velocity, review pulse, and funnel health, without drowning your applications in busywork. The app analytics platform archives everything in real time, letting you slice cohorts by locale, version, or campaign and prove application performance gains on demand.
cta_get_started_yellow
FAQs
What are the core mobile app analytics metrics I should track?
Impressions → product page views → installs/CR → D1/D7/D30 → ratings/reviews → uninstalls → LTV/ARPU. Treat this as your mobile app metrics backbone. Start from the customer journey, then build your stack.
How do I calculate conversion rate from store traffic?
CR% = installs ÷ product page views × 100. Log it as a daily metrics heartbeat.
What’s the difference between visibility and conversion metrics?
Visibility = ranks/features/keywords; conversion = page turning views into installs. Align both with marketing intent.
What’s “reply effect”?
Fast, helpful review replies nudge people to update their stars upward. That creates measurable engagement lift.
Why do my store ratings look “off” day to day?
Time zones, batching, anti-fraud filters, and rounding. Read 7/14-day trend alongside session patterns.
How fast should I see movement after release?
Keyword/chart shifts in 3–5 days, CR in 24–72h, stabilization by 7–14 days. Treat every mobile app update like a mini launch.
Can I estimate downloads by country/keyword?
Yes, use modeled estimates from rank/visibility and validate with store dashboards.
Sanity-check against app store downloads statistics.
What should be in my weekly ASO report?
Top-30 keyword penetration, Search Visibility, CR by source, rating distribution shifts, action list.
Add a one-liner on revenue impact.
Call out cost efficiency wins or leaks.
Which ASO metrics matter most early on?
Keyword coverage, visibility trend, category trajectory, product page CR, first-asset tests. Focus on queries your users already use.
How do I pick keywords that move installs?
Prioritize KEI winners (popularity² ÷ difficulty), local phrasing, and page-message match. Let mobile app metrics analytics guide which terms to defend and scale.
How often should I review app store metrics?
Daily during launches/paid pushes; weekly for BAU; monthly/quarterly for strategy. Anchor goals to retention signals before you scale.
Read also
21 Mobile App Performance Metrics Behind App Store Success
Guide to App Store Analytics: Find the Data, Follow the Clues, Grow
5 Secrets of Reputation Automation in 2025: Best Tools & Tactics
Online Review Management Reputation Software: 15 Tools Review
Reputation Management Tactics & Tools to Protect Your App Brand