21 Mobile App Performance Metrics Behind App Store Success

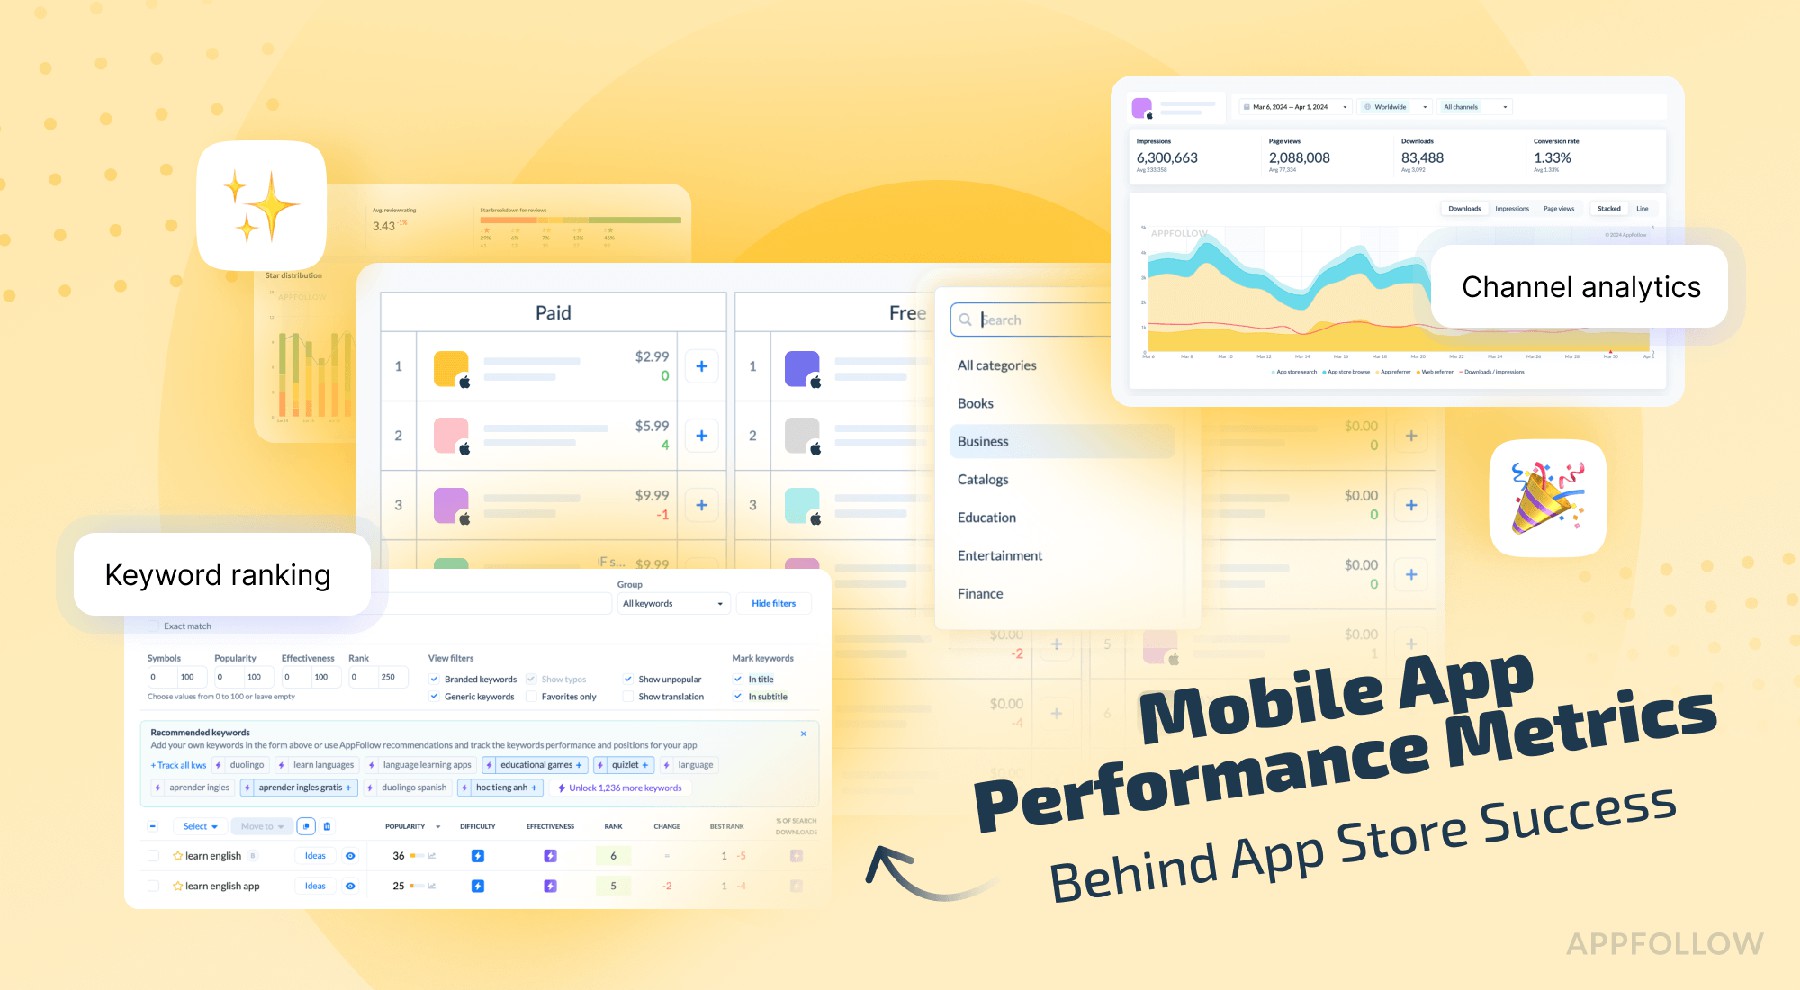
Table of Content:
Ever watch a team dive into application performance metrics for the first time? Like smashing open a dashboard piñata, data flies everywhere, but somehow no one grabs the candy that matters.
I’ve sat next to app folks glued to DAUs and crash-free rates, clueless that their installs are quietly bleeding out. Meanwhile, mobile app revenue analytics spike and drop with zero breadcrumbs to follow.
So I pulled my work bestie (queen of spotting ASO disasters before they blow up) and we cracked open the treasure chest of lessons from AppFollow’s team and clients.
What’s truly essential? What’s just dashboard stuff? Stick around, I’ll show you the must-haves vs nice-to-haves that separate apps coasting on luck from those engineering unstoppable growth.
By the end, you’ll know exactly which signals predict your next download boom (or bust).
Let’s start with metrics reflecting your app success in the app store search.
Application acquisition & visibility metrics
Visibility is oxygen in the App Store ecosystem, and acquisition metrics are the lungs that pull it in. Every growth win I’ve watched inside AppFollow, whether Vizor doubling organic installs or James Delivery outranking giants overnight, started with a laser-focus on this handful of numbers.
Category rank, keyword lift, feature flags: each one flashes a signal about how discoverable your application is right now and how fast it can accelerate tomorrow.
In the next pages, we’ll break down the exact visibility metrics our clients track daily, why timing matters, and the simple tweaks that turn quiet app rankings into download surges for growth.
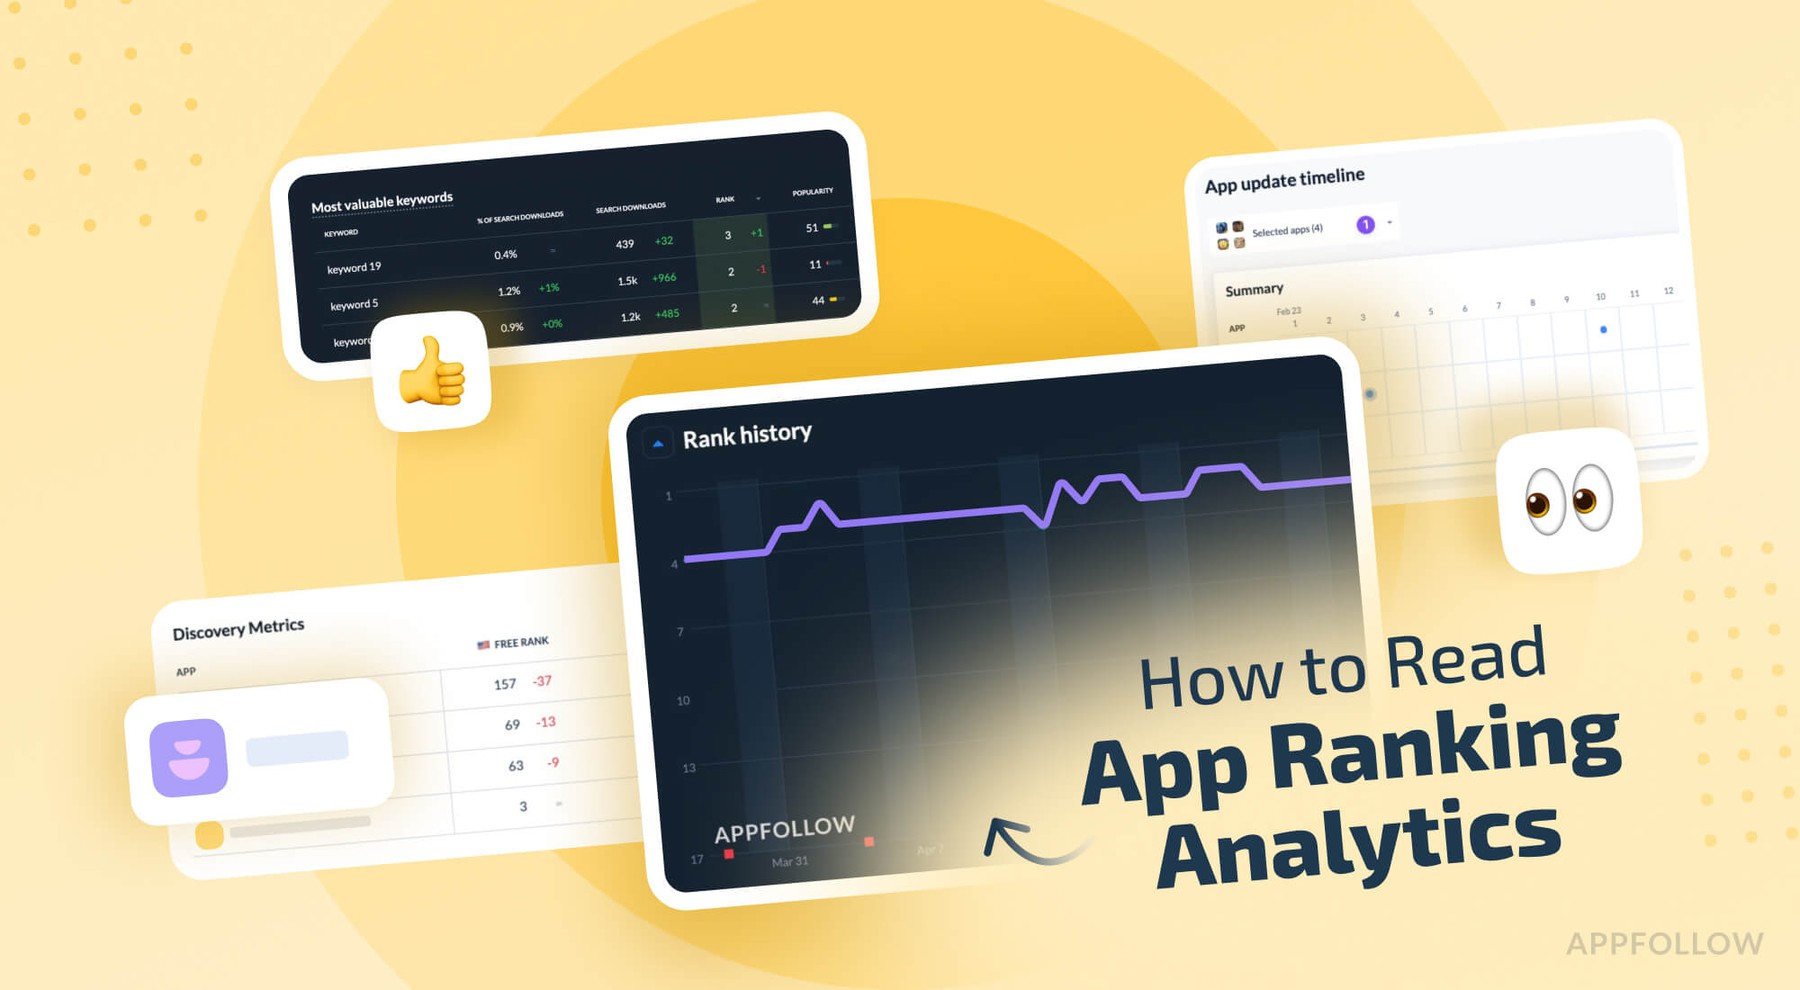
Read also: How to Read App Ranking Analytics and Find Growth Gaps
Top chart rankings (free, paid, grossing, trending)
Top-chart rankings are leaderboards every exec fixates on the minute your ad dollars land. But behind the vanity lights sits a metric worth its weight in sprint tickets.
Apple and Google Play Store crunch installs, velocity, and a dash of engagement to decide where your app lands on the Free, Paid, Grossing, and Trending lists, sliced by country and category.
No public formula, but the outcome is pure social proof: users follow the crowd.
I’ve watched an AppFollow client leap from #180 to #30 in “Free Games US”, just 300 extra installs tipped the scale, yet organic uplift tripled their paid UA for the week. That’s the compounding power of chart visibility.
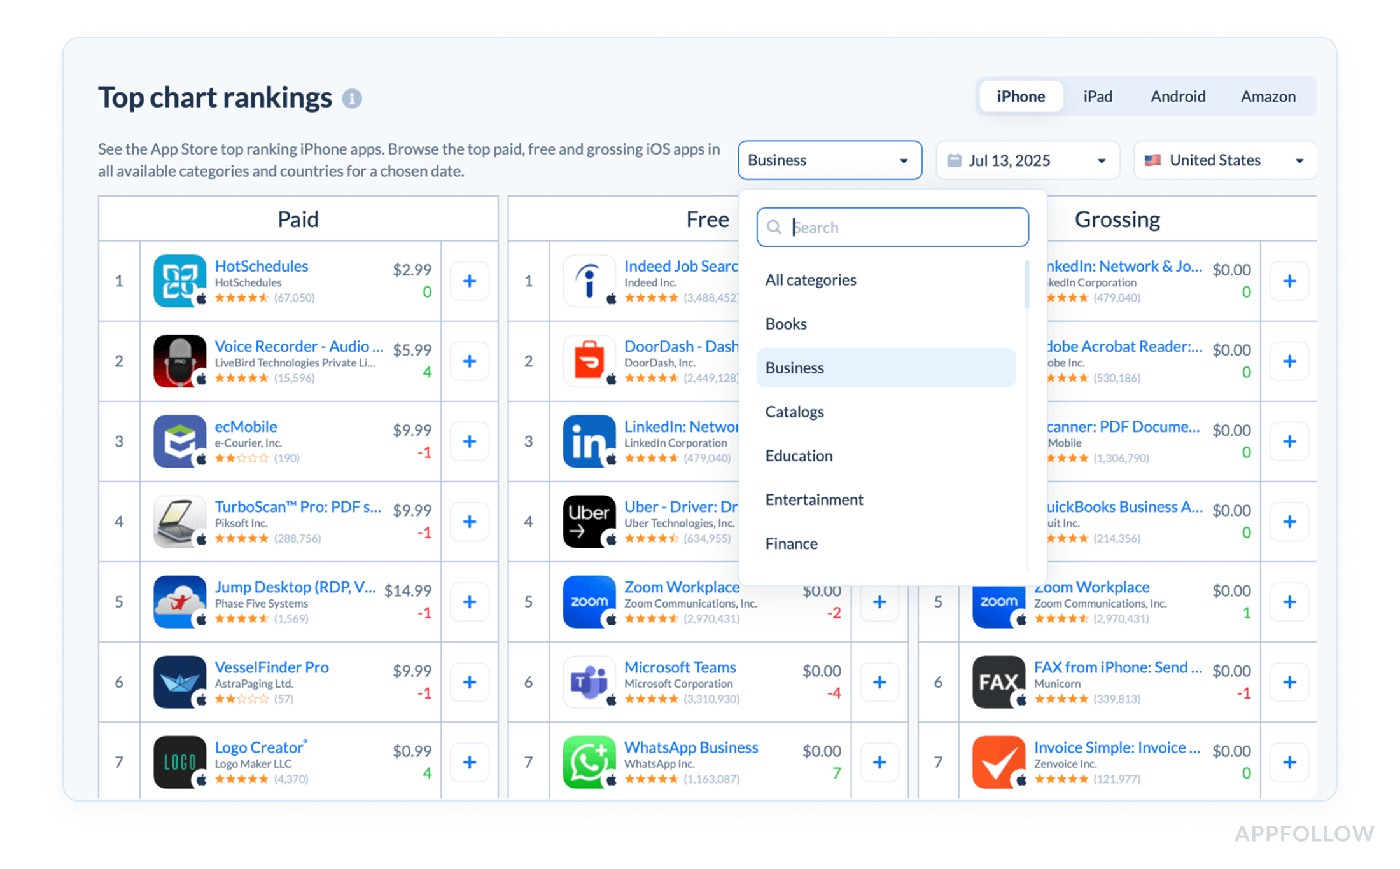
Top chart rankings in AppFollow. Test it live with a 10-days trial.
How to work it
- Track daily. A single-day slip often hints at review bombs or UA fatigue.
- Log micro-movements. Even a +5 bump can spike impressions 10–15 % in niche categories.
- Pair with download deltas. If rank rises while installs stall, you’re in a soft cohort, time to juice retention, not bids.
- Set alert thresholds. In AppFollow, push a Slack ping when rank shifts ±10; your ASO squad can react before Monday’s stand-up.
Quick benchmark: For mid-tier games, reaching top 50 in a primary locale should yield a 7–12 % lift in organic installs day-over-day. Miss that, and your creativity or ratings aren’t sealing the deal.
Featured apps timeline (tracks if and when your app is featured)
Picture this: your team rolls into Monday standup, caffeine still kicking in, and sees daily downloads shot from 2,000 to nearly 20,000. Slack’s exploding, someone’s claiming it was the new paywall test, another says it’s that TikTok collab.
You pull up your featured apps timeline and point to the real MVP: a three-day spotlight in “Mindfulness Musts” on the UK App Store.
This is why I live and breathe this metric. Featured apps timeline logs exactly when and where Apple or Google decided to shine their flashlight on you, down to the category, the curated collection, and the country.
No formula, no fancy ratio. A clear yes or no on any given day, telling you if the App Store itself gave you that surge.
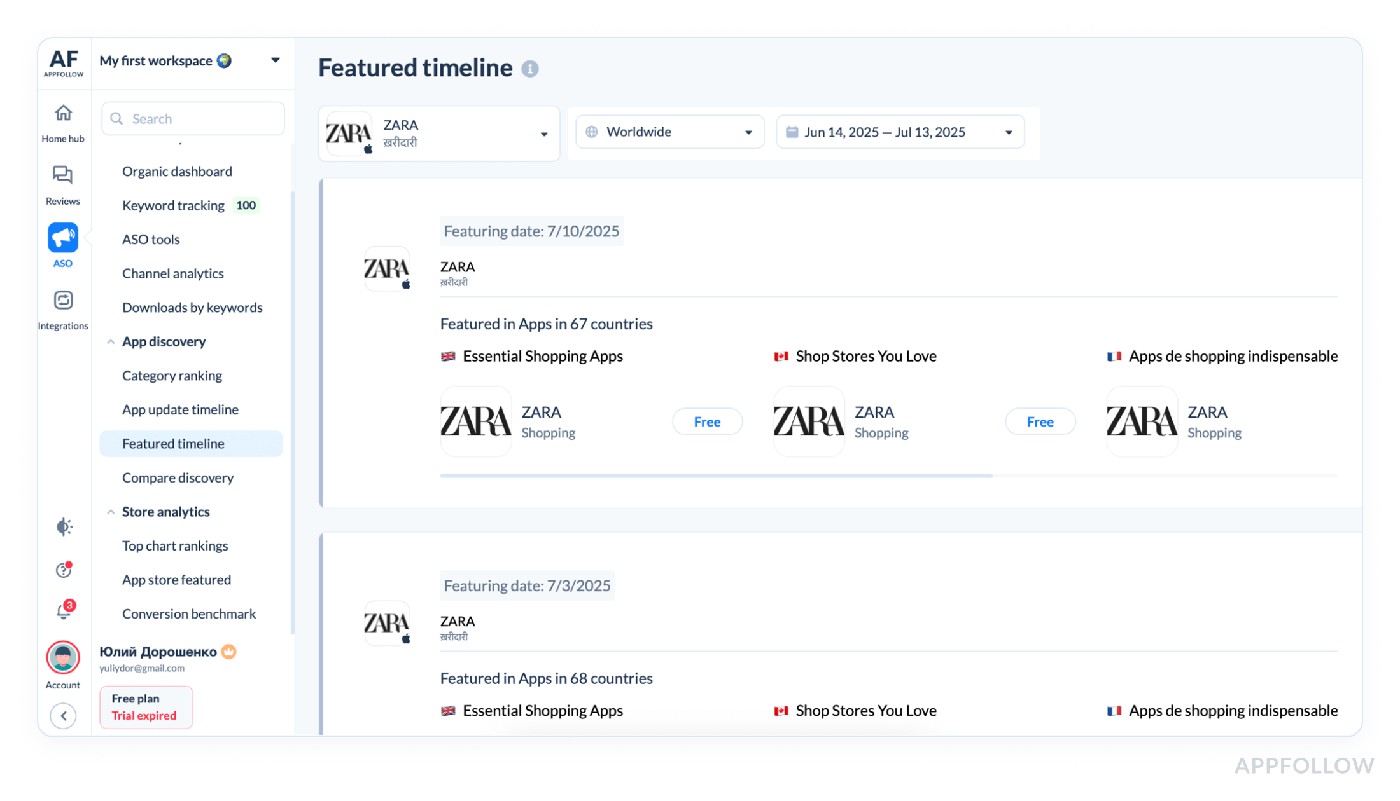
Featured timeline in AppFollow dashboard. Test it live with a 10-days trial.
From my years working with AppFollow clients, I can tell you: this timeline saves budgets. Without it, your paid team might ramp spend thinking they cracked some magic combo. Meanwhile, the truth sits in a little timestamp from Cupertino or Mountain View.
If your app’s localized, this becomes your growth map. You’ll know precisely which language markets triggered organic waves, so your next update or promo can double down there. It’s hands down one of the cleanest ways to separate hype from hard-earned organic gold.
Within mobile application performance metrics, that timestamp delivers instant observability without drowning dashboards in raw data or slow-moving spreadsheets.
Keyword popularity score (search demand for a keyword)
You ever get that itch to overhaul your app’s metadata because installs are flat, only to realize later you were chasing ghosts? That’s usually where the keyword popularity score strolls in, quietly holding the truth about what users are searching for.
A client I worked with was sweating over keywords like “mindful sleep” that sounded poetic in their ASO brainstorm. Their keyword popularity score only a measly 12 out of 100. Meanwhile, “sleep sounds” clocked in at 83. This metric captures the relative search demand for a keyword across the App Store or Google Play, distilled into a scale where higher means more users typing it in.
No hidden formula here: tools like AppFollow crunch raw search data (direct or modeled) to spit out that 0–100 score. It doesn’t get more straightforward.
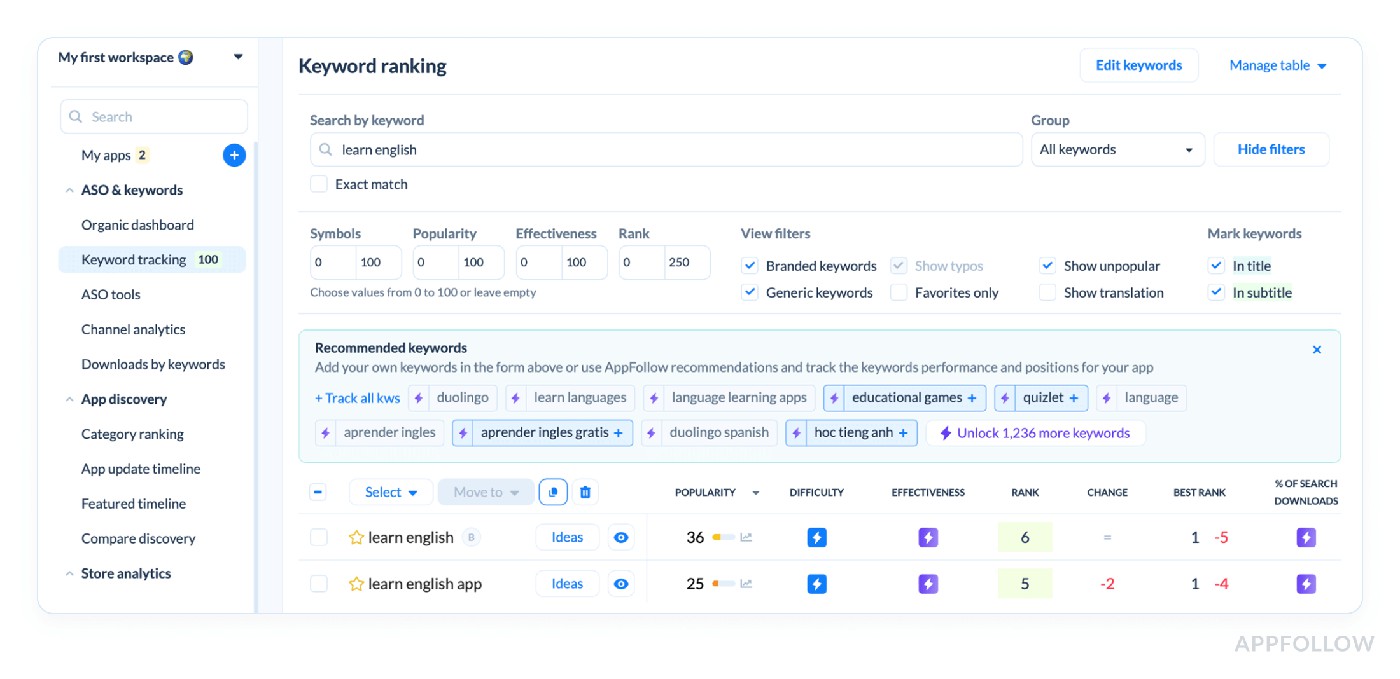
Keyword ranking, tracking & research in AppFollow. Test it live with a 10-days trial.
And it matters more than most teams admit. I’ve seen entire sprint budgets torched chasing low-popularity keywords because someone insisted they’d be easier to rank for. Sure, low difficulty’s cute, until you realize nobody’s searching for them.
One app we guided swapped their primary keyword from “guided calm” (popularity score: 27) to “meditation music” (popularity score: 76). Within two weeks, organic installs rose by 43%.
That’s the kind of quiet metric that either quietly makes you a hero or keeps your app hidden six pages deep in the store. Always worth pulling up in your next ASO meeting, trust me, your roadmap will thank you.
Think of it as the ASO counterpart to performance metrics for web application dashboards, quick to measure, easy to action, and perfect for keeping your keyword infrastructure aligned with market demand.
Ready to watch your App Store metrics talk back? Fire up a 10-day free trial of AppFollow and turn every rating, keyword, and chart jump into a growth move. No credit card, just pure data-driven wins. Grab your spot & start tracking in 60 seconds → | 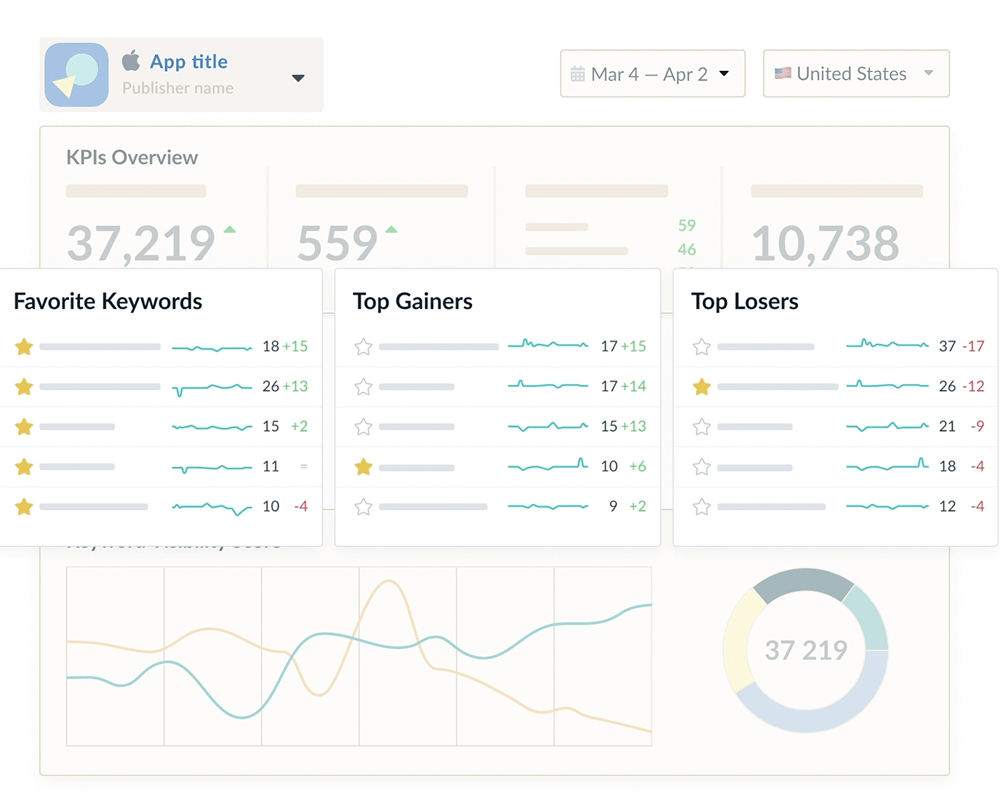 |
Keyword effectiveness index (KEI) (balance of popularity vs competition)
It's the metric that’s saved more app campaigns than any catchy tagline ever could.
I’ll never forget that late-night Zoom with a client’s product team, everyone drowning in pivot tables. They were thrilled to rank #5 for “calm sounds,” yet their revenue curve was flatter than a week-old soda. One quick KEI scan in AppFollow: a miserable 8. Loads of demand, sure, but buried under heavyweight competitors.
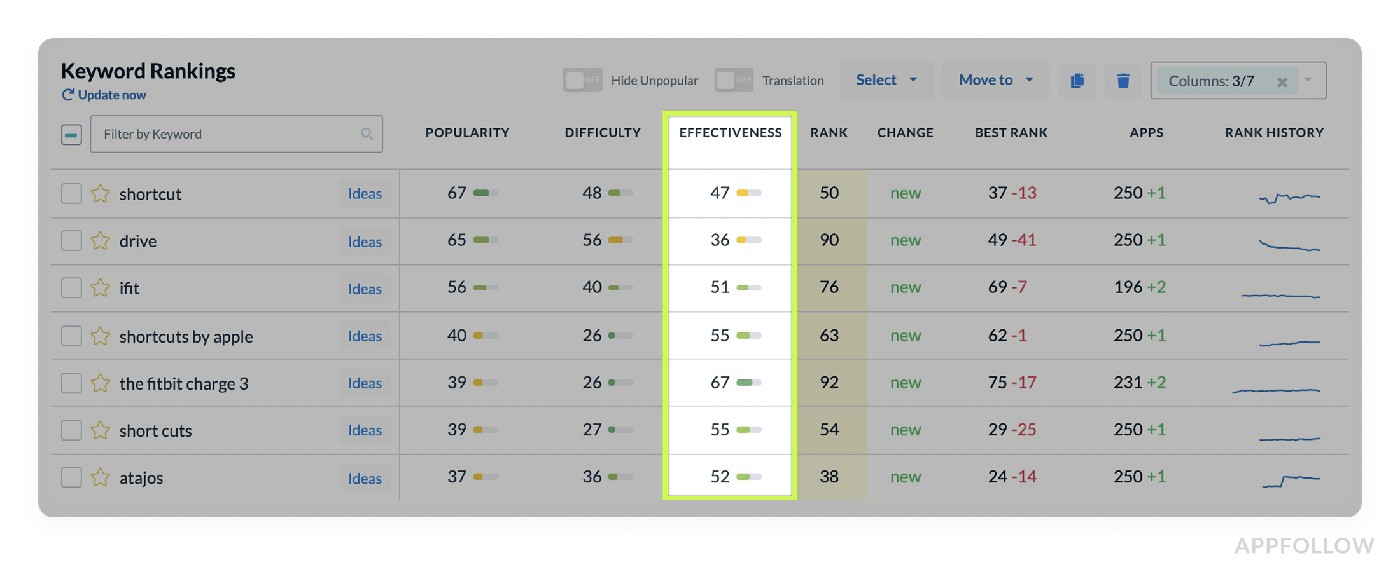
Keyword effectiveness in AppFollow. Test it live with a 10-days trial.
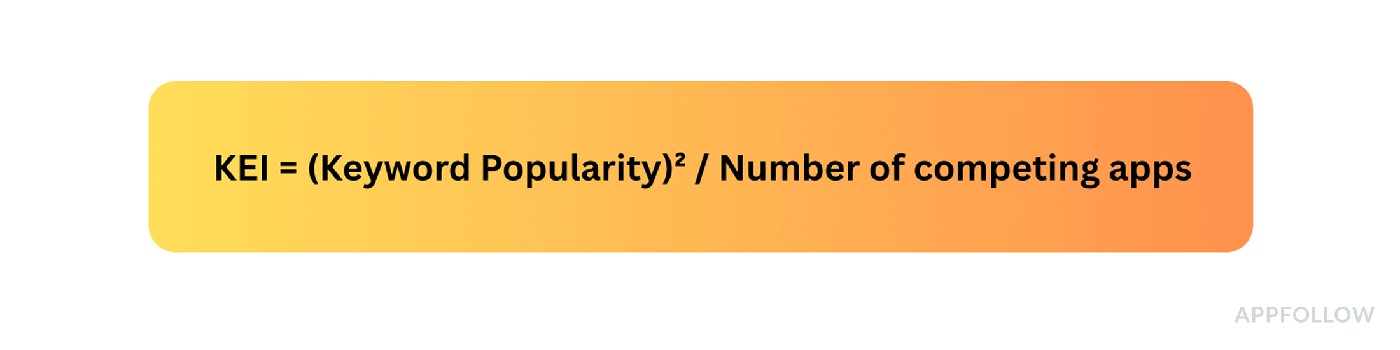
KEI slices through the hype by blending search popularity with the level of competition, calculated roughly like:
So “meditation music” with a popularity of 80 and 150 competitors? KEI = (80²)/150 ≈ 42, solid ground.
Here’s where this pays off: swap low-KEI darlings for smarter targets. A client moved from “sleep sounds” (KEI 9) to “guided sleep meditation” (KEI 58) and clocked a 38% organic install bump in four weeks.
Pro tip: Always pair KEI with relevance checks. It’s tempting to chase any high score, but if it doesn’t align with your app’s core, your conversion rate tanks, and you lose store velocity.
Use this every time you refresh metadata, tools like AppFollow track it automatically, so there’s zero excuse to fly blind. Your future cohorts (and budget forecasts) will thank you.
Keyword difficulty score (how hard it is to rank for a keyword)
Teams love chasing high-volume keywords without checking the keyword difficulty score, which is exactly how they burn through budgets with nothing to show.
I was trading war stories with my buddy Veronika the other day, she’s led more ASO revamps than most have run metadata pushes. Her favorite line? “Nothing torches your sprint budget faster than chasing keywords your app has no hope of cracking.”
Here’s what we’re tracking: difficulty scores spotlight how fiercely a keyword is defended by existing top apps. Scores run 0 to 100; anything pushing past 80 usually means entrenched giants with deep install velocity, stellar ratings, and broad localization coverage. Tools wrap this into formulas blending competitor volume, star averages, and rank momentum.
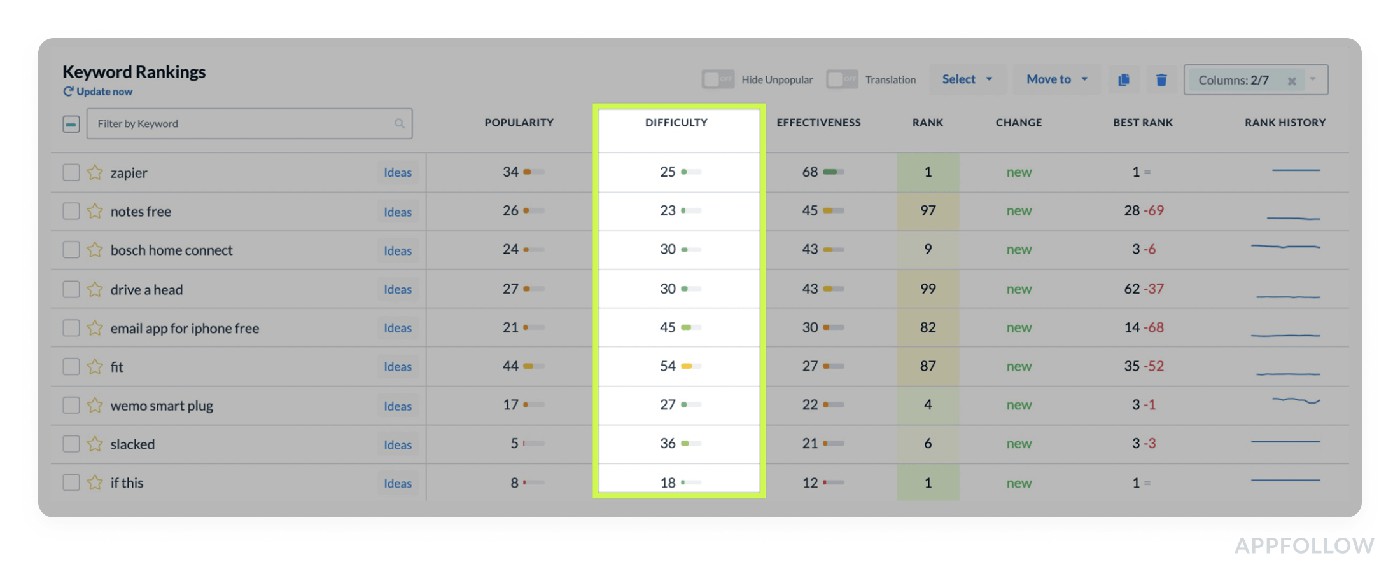
Keyword Difficulty is available on the Keyword Tracking page in AppFollow. Test it live.
One client was stuck on “fitness tracker” (difficulty 92), baffled that their fully localized, crash-free gem hovered at #47. We pivoted to “step counter goals” (difficulty 47), and in two weeks their visibility doubled, bumping organic installs by 25%.
Tip - always pair difficulty with popularity. Chasing low-difficulty duds leaves you ranking first for words nobody types. Your future self, and your next cohort report, will be way easier to explain.
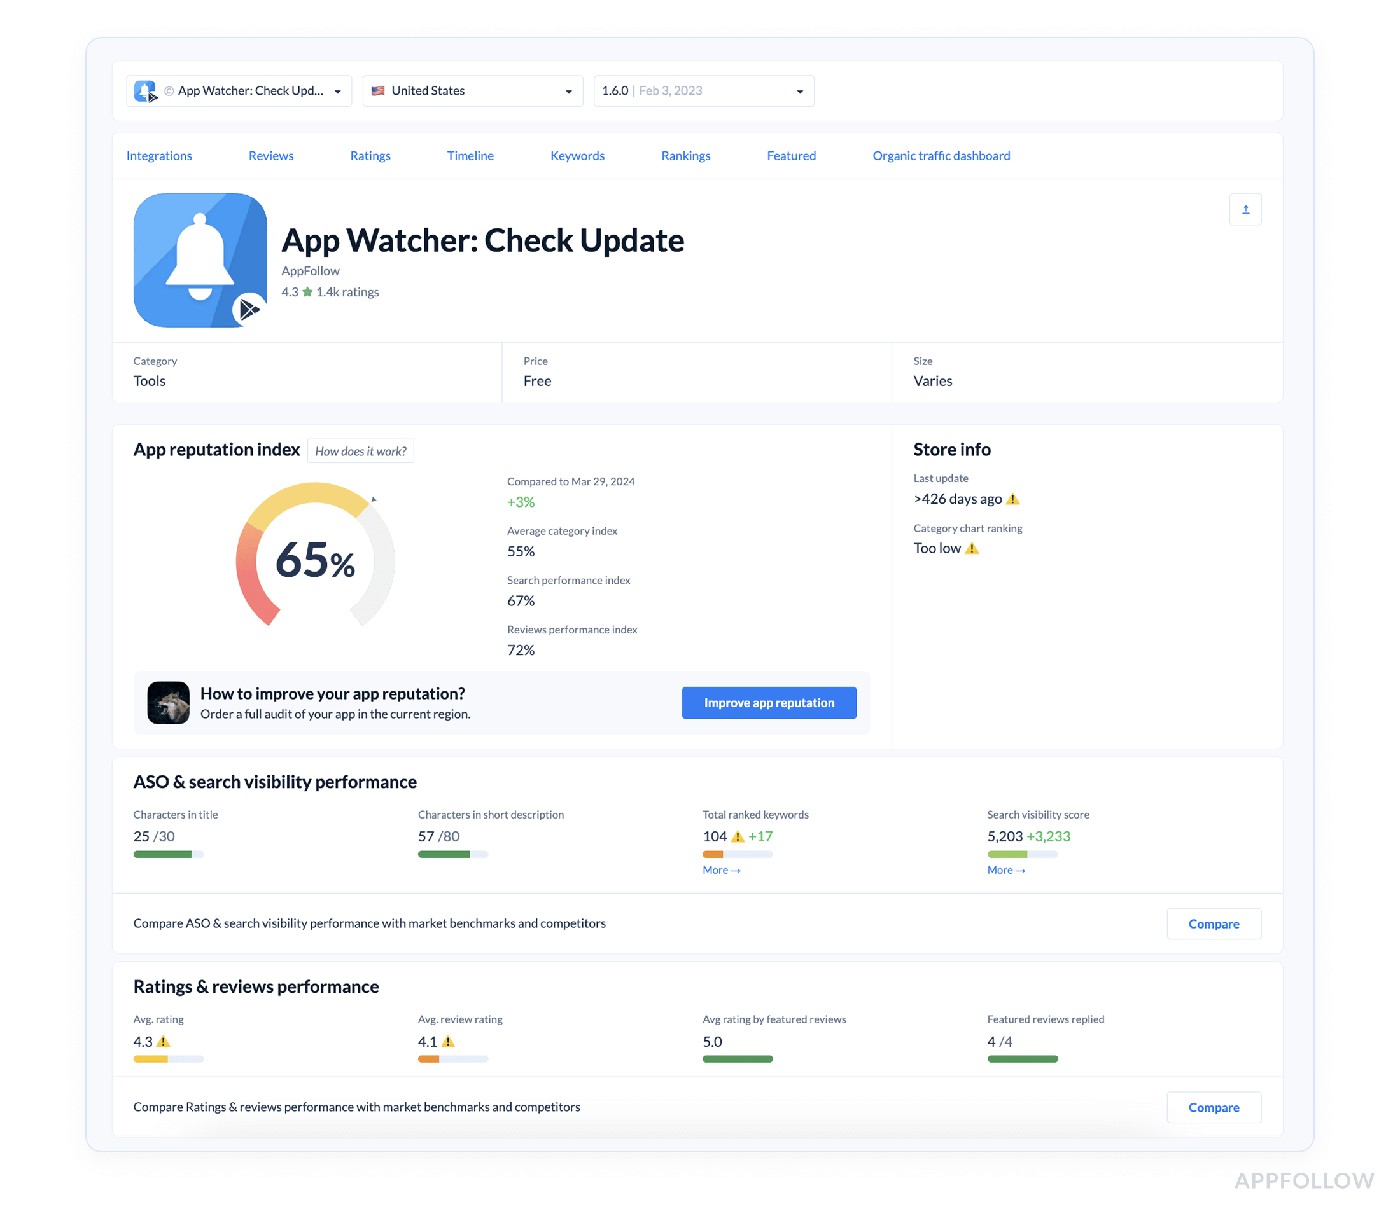
App reputation index (composite index of app health & perception)
The App Reputation Index is your lie-detector test: one composite score (0–100) built from ratings, velocity, sentiment, and reply impact:

Weights vary by tool, but the shape holds.
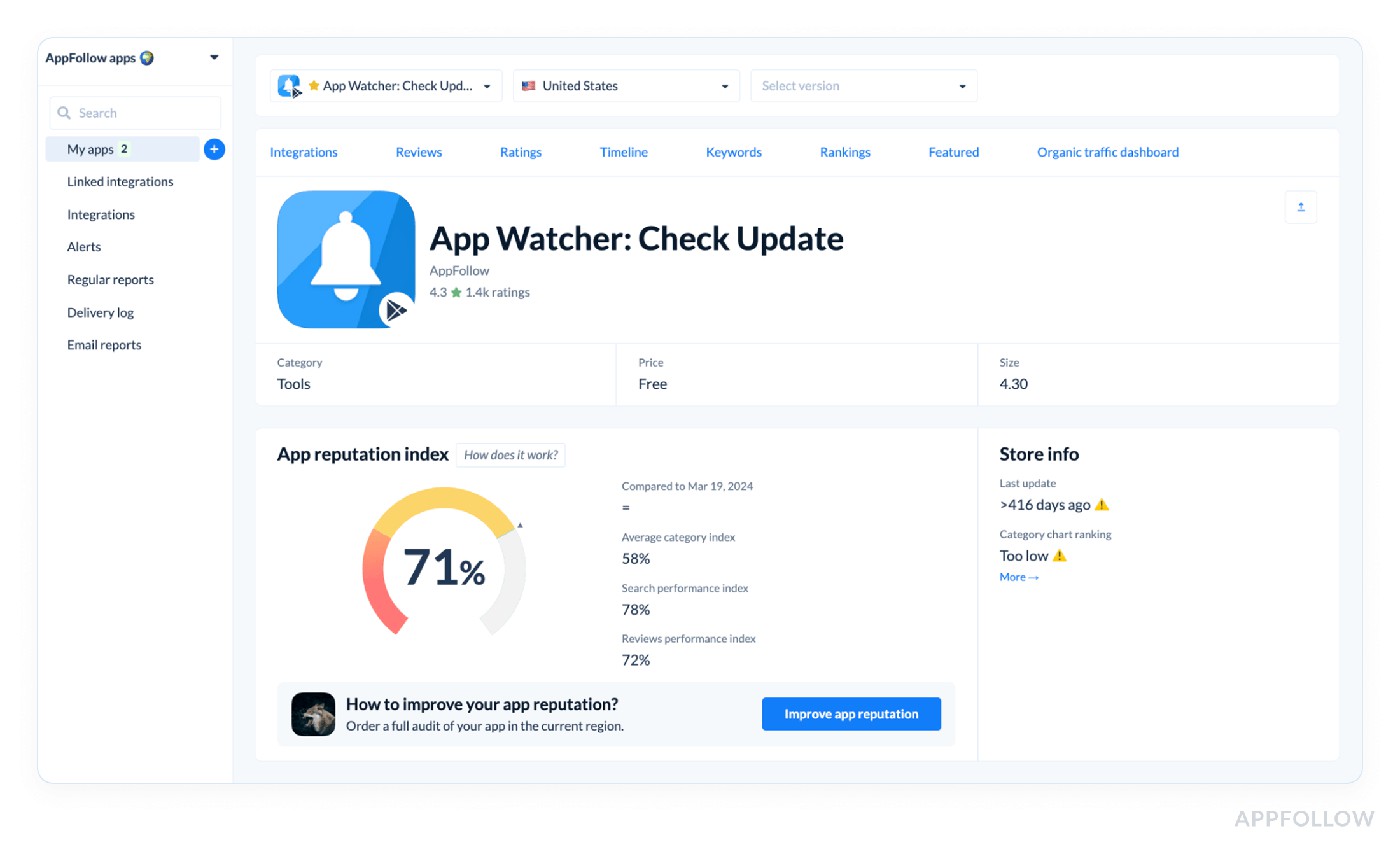
You can find an overview and a breakdown of each category on the App Page in AppFollow.
How to put the index to work
Score Band | Read-out | Immediate Playbook |
85–100 | Brand halo | Double-down on store creatives; showcase trust badges in UA ads. |
70–84 | Stable, monitor | Set auto-alert if ↓ > 3 pts in 7 days; drill tags for brewing bugs. |
55–69 | Fragile | Prioritise CX SLA; run sentiment hotfix sprint, push update in <14 days. |
<55 | Reputation crisis | Freeze paid UA, launch crash patch, escalate C-level war-room. |
Cadence & tooling:
- Daily Slack ping when index shifts ±1.
- Weekly retro: cross-check with install curve, drops >5 pts often pre-date a 10–20 % conversion slide.
- Monthly export to BI; slice by version, locale, or campaign to pinpoint root causes.
Benchmarks to quote in exec decks:
- Finance & Health: 80+ is table stakes.
- Casual Games: 75+ keeps churn below 4 % MoM.
- Subscription Utilities: Falling below 70 usually predicts a spike in refund tickets.
I watched one client slip from 86 → 64 in eight weeks, reply lag crept past 72 h and sentiment flipped negative. Installs sank 18 %. A standing 5-point alert could have saved two sprints and a boat-load of paid traffic.
Pin the index dead-center on your dashboard. When the board asks how this quarter’s work lifts user happiness, you’ll have a single, defensible number, and the action log that proves it.
Get a single 0–100 health score updated daily Start your trial to know exactly when to celebrate, or triage | 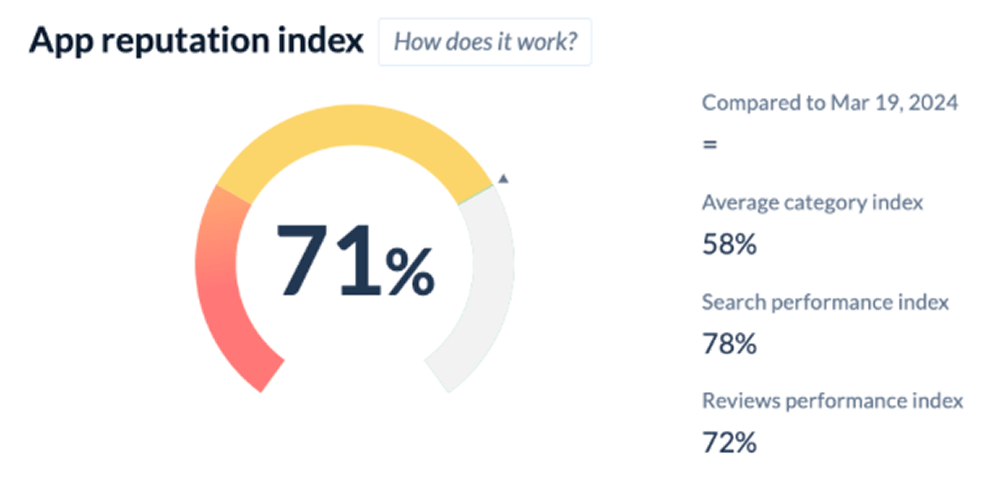 |
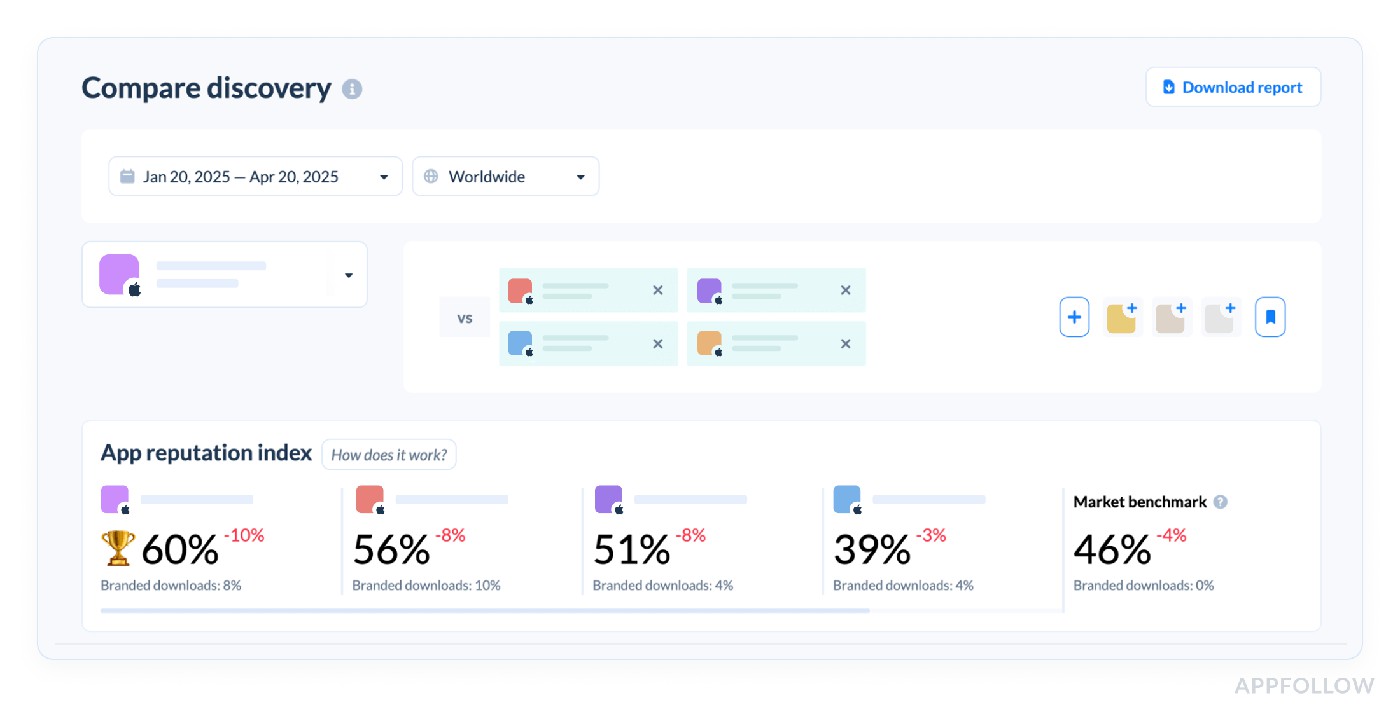
Compare discovery (your visibility vs competitors)
“You know, the fastest way to figure out why your installs plateaued? Stack your discovery metrics right against your top three competitors. Nine times out of ten, the gaps tell the whole story.”
That’s exactly what the Compare Discovery feature does. It lines up your app’s visibility stats, keyword rankings, category placements, featured appearances, right beside the folks you’re battling for the same eyeballs.
Here is how it looks like in AppFollow:
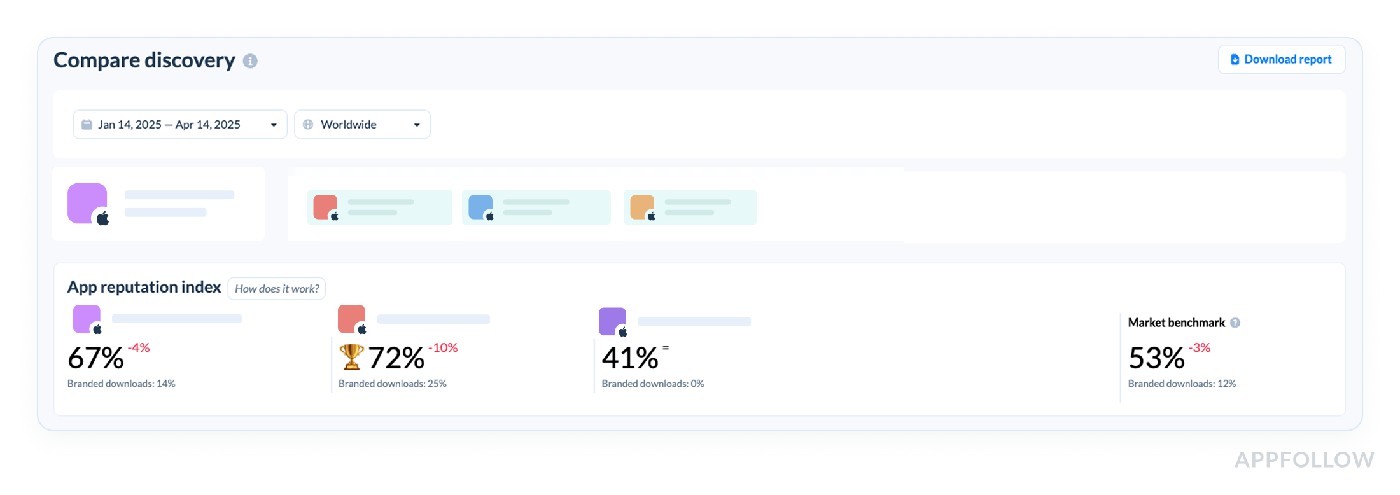
On the right side of this section, you’ll see the App Reputation Index and Brand Power benchmark for the industry. Use this benchmark to understand how the selected apps compare to the industry standards.
We pulled this up for a fitness app last month. Their discovery curve for “HIIT workouts” was solid, ranked #7, while their main rival hovered at #5. Not disastrous, right? Until we saw that same rival dominating related keywords like “quick cardio” and “fat burn timer,” plus holding three different category ranks above them. Their download delta, 22% lower, suddenly made perfect sense.
Benchmark-wise, if your top keyword ranks are only trailing by two or three positions on core searches, and your app’s still pulling 80% of the competitor’s installs, you’re in decent shape. But drop eight or nine slots back across five key phrases? Time to prioritize new ASO experiments.
Truth is, I’ve watched teams sink quarters into metadata updates blind. Without this side-by-side map, you’re tweaking colors on your store icon while your rival eats your organic lunch. Your Compare Discovery data is telling you where to steer next sprint, ignore it, and watch your growth ship drift off course.
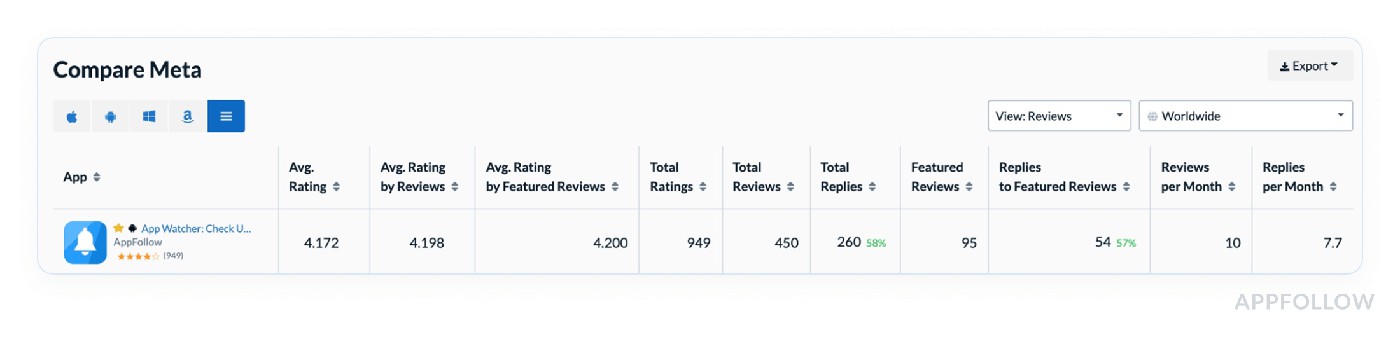
Compare Meta (track app page metadata vs competitors)
Lucija fired up the Spanish App Store pages for our client’s language app, then brought up their top competitor. Her first words? “Spot the difference in these subtitles. Six localized keywords vs your three. And their first two lines? Packed with feature promises.” By the time she scrolled to the preview video section, we didn’t need more slides, everyone on the call was scribbling action items.
That’s the power of Compare Meta. It doesn’t rely on a fancy formula, no index or weighted equation. Instead, it stacks your app’s metadata against competitors in a structured audit: titles, subtitles, descriptions, icon updates, screenshots, preview videos, even which regions are localized. It’s all laid out in a single grid so you can’t hide from gaps.
Here is how it looks like in AppFollow:
Test it live with a 10-days trial.
Why obsess over it? Because those elements are your final handshake before a user hits “Get.” I’ve watched apps with nearly identical search ranks lose 20% on conversions purely because their metadata whispered while the rivals roared in native language hooks and sharp benefit bullets.
Lucija swears by running this every time a client preps new markets. Her rule is if your subtitles, feature highlights, or visuals lag competitors by more than two high-intent keywords or a full row of localized assets, expect your conversion to trail industry averages by 15–25%.
Downloads & conversion metrics
Downloads are vanity until they funnel into real adoption, and conversion metrics are where that truth hits the ledger. Inside AppFollow, I’ve seen freemium fitness apps climb 40 % in installs, then stall because their product-page hit rate lagged the industry by ten points. Flip that one metric and revenue spikes follow.
These next pages dissect the download-and-conversion stack our clients lean on every day: country-level install estimates, keyword-driven downloads, channel splits, and the conversion benchmark that flags leaking storefronts before finance feels the pain.
Download estimates & trends (by countries & categories)
It’s a window into whether your app’s pulling organic weight in Italy, coasting on paid boosts in Brazil, or quietly dropping off radar in Health & Fitness while soaring in Lifestyle, a view that mirrors the rigor teams put into mobile application performance metrics on the server side.
Tools like AppFollow stitch together store ranks, historical velocity, and peer benchmarks to model your daily installs. They’ll roll it into neat charts, giving growth squads sharper observability without extra instrumentation.
Behind the scenes, the simplified formula is usually:
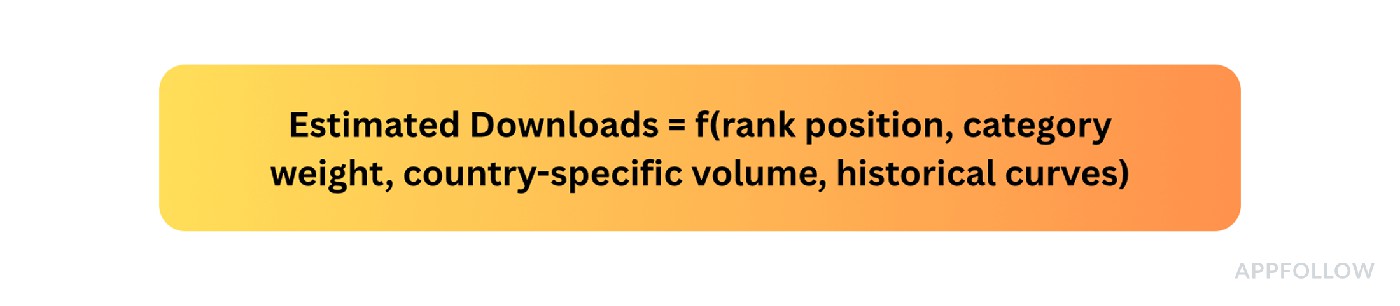
Each vendor tweaks it, of course.
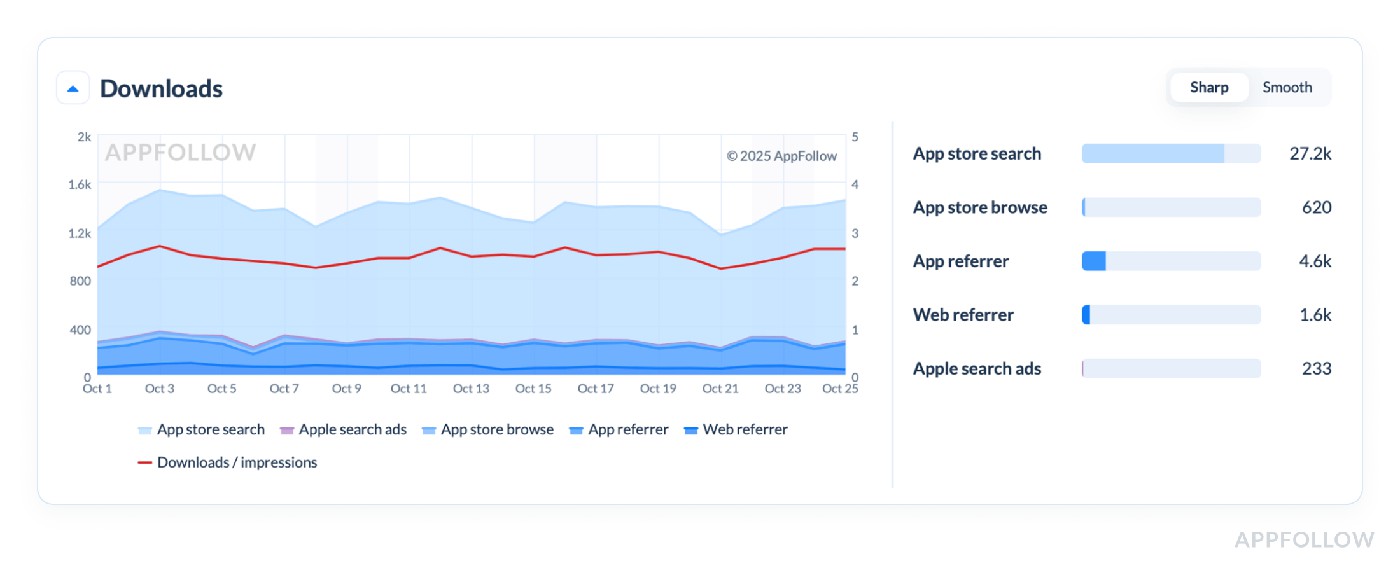
Downloads info in AppFollow. Test it live with a 10-days trial.
One client in mobile wellness saw a comfy 3,200 downloads/day globally. Totally fine… until we broke it down. Italy, their new target, contributed a mere 40 installs/day, far under regional ASO benchmarks for a top-30 app (150-200).
Meanwhile, their biggest chunk still came from Mexico, where they weren’t running any local campaigns or even had Spanish screenshots baked into the software.
That sort of breakdown is why I never let a team pitch growth targets off global totals alone. Tracking by country and category uncovers your real levers, whether it’s improving local creative, fixing keyword misfires, or deciding if your next ad push should even bother with “Health & Fitness” in Spain.
Downloads by keyword (shows what keywords bring installs)
Downloads by keyword is hands down one of my favorite performance metrics because it slices through vanity totals and zeroes in on exactly which search terms are paying your bills. It maps out how many installs each keyword drives, so you’re not left guessing whether “guided breathing” is a tiny trickle or a hidden firehose.
You’ll find it neatly laid out in AppFollow under ASO → Downloads by Keyword, breakdowns by country, trends over time, even CSVs ready for your next Monday dashboard meeting.
Behind the scenes, tools typically swirl together your rank position for that keyword, its search volume, average store conversion rates, and historical patterns:
So it’s a tasty blend of your data and the market’s appetite.

Here is an example of what this report looks like in AppFollow:
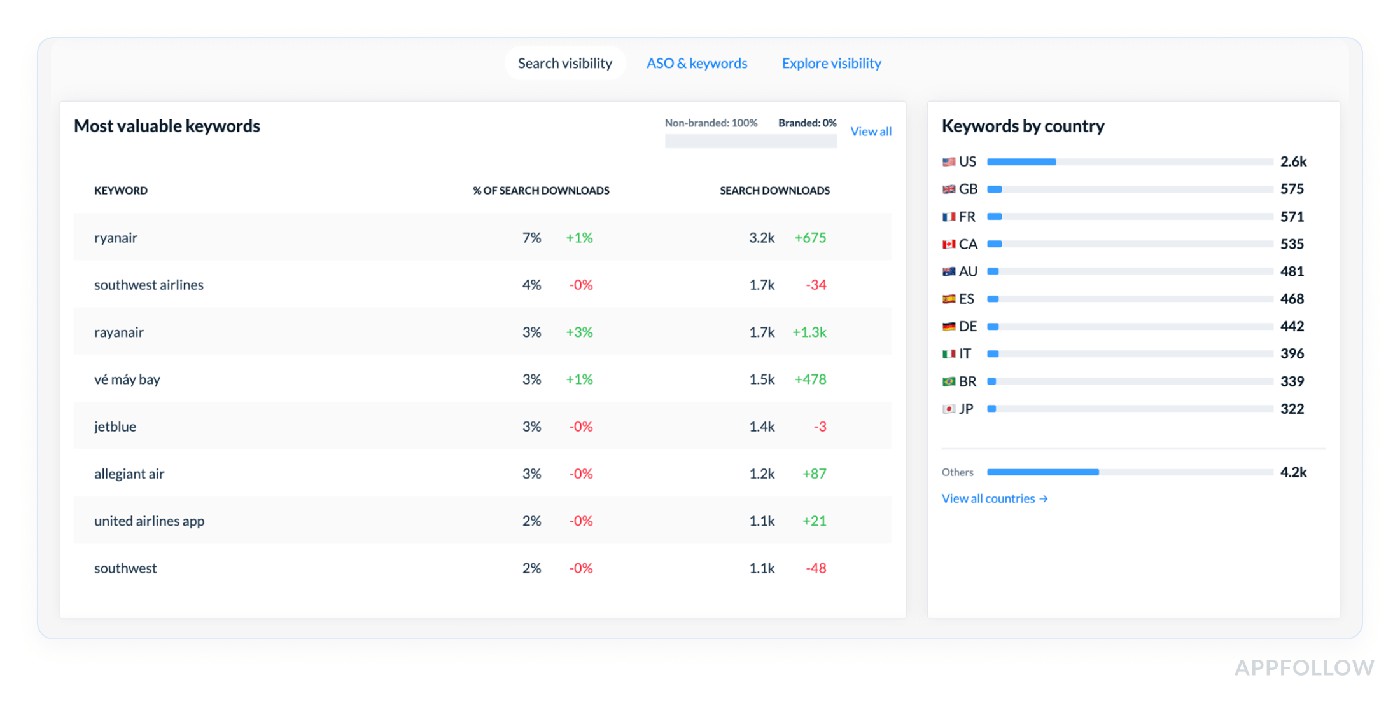
Test it live with a 10-days trial.
Why do I hammer on this so much? Ilya once said well it during a casual retro: “Teams love to brag about total installs, but ask them which keywords moved the needle, and half go quiet.”
We had a health app swearing by “anxiety relief.” Reality - it pulled 12 installs/day. Meanwhile, “calm music”, barely highlighted, drove nearly 50, right in line with top-15 norms. Knowing this reshuffled their entire sprint: no wasted metadata experiments, no chasing ghost keywords.
See which phrases deliver users Activate your 10-day pass and track installs per keyword today | 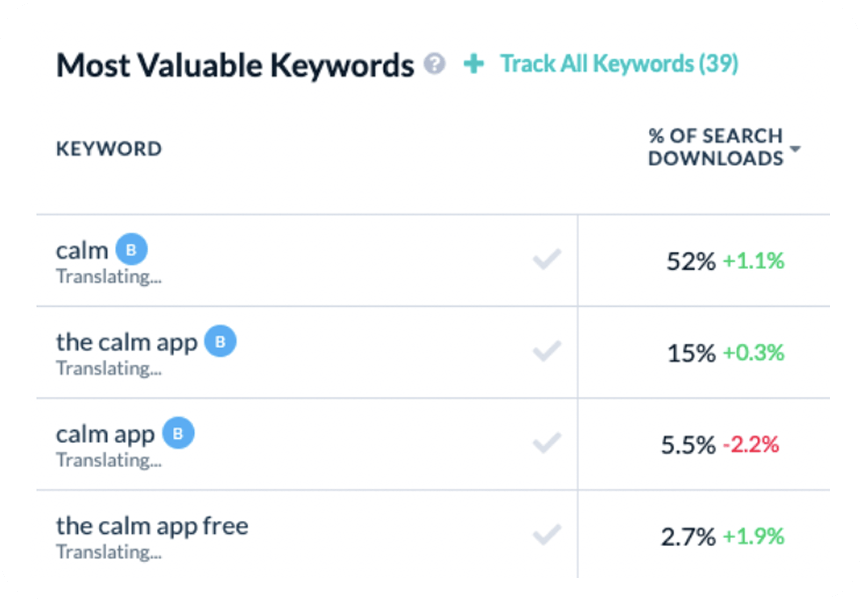 |
Conversion benchmark (industry-level or your app’s benchmark to spot if your conversion is under/over average)
Conversion benchmark measures how well your store page turns visitors into installs, stacked against your past performance or the category average. Use it to see if you’re meeting performance benchmarks or falling short.
At its core, the math stays simple:
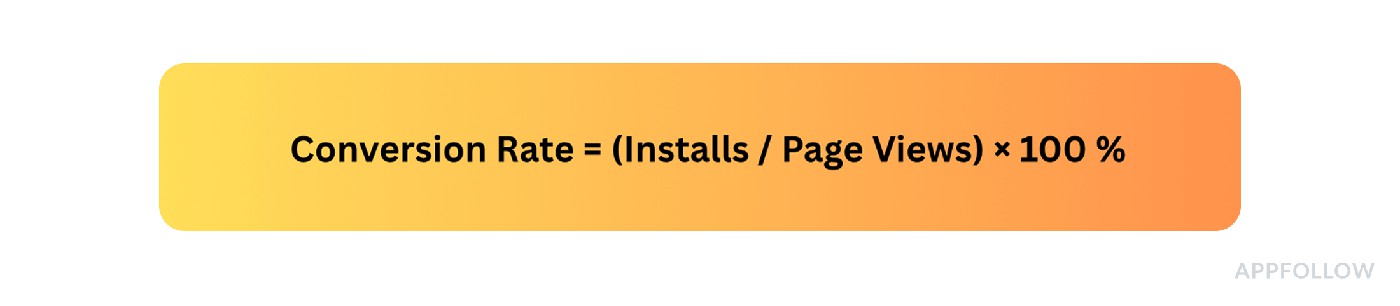
AppFollow then flags your rate against known ranges, health apps typically sit at 32-38 %, casual lifestyle apps are higher.
Find it inside Conversion Benchmark in your dashboard; slice by country and category so you’re not comparing a mindful-breathing page to a hyper-monetized puzzle giant.
Here is what it looks like in AppFollow:
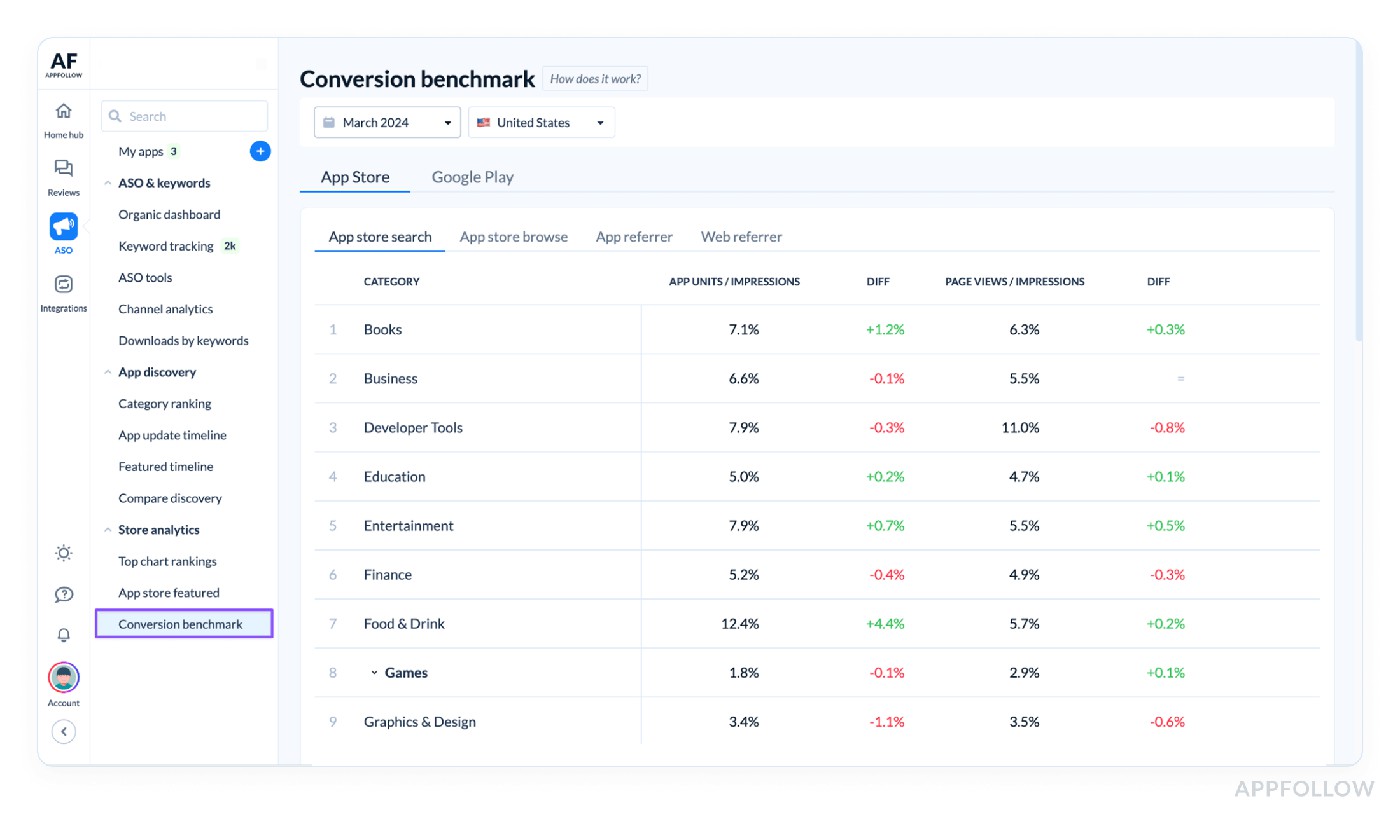
Example of the conversion benchmark in AppFollow. Test it live with a 10-days trial.
A meditation brand sat at 24 %. AppFollow flashed a red 35 % industry mark. Spanish listings still flaunted English screenshots; a localized refresh popped them to 33 % inside four weeks. Dzianis loves to say, “Blind optimization burns more budgets than bad design ever will.”
Channel analytics (analyze user acquisition by channel if linked)
Channel Analytics in AppFollow shows exactly where installs come from, paid, organic, social, broken down by region and campaign window via your MMP hooks.
Here is what it looks like in Appfollow:
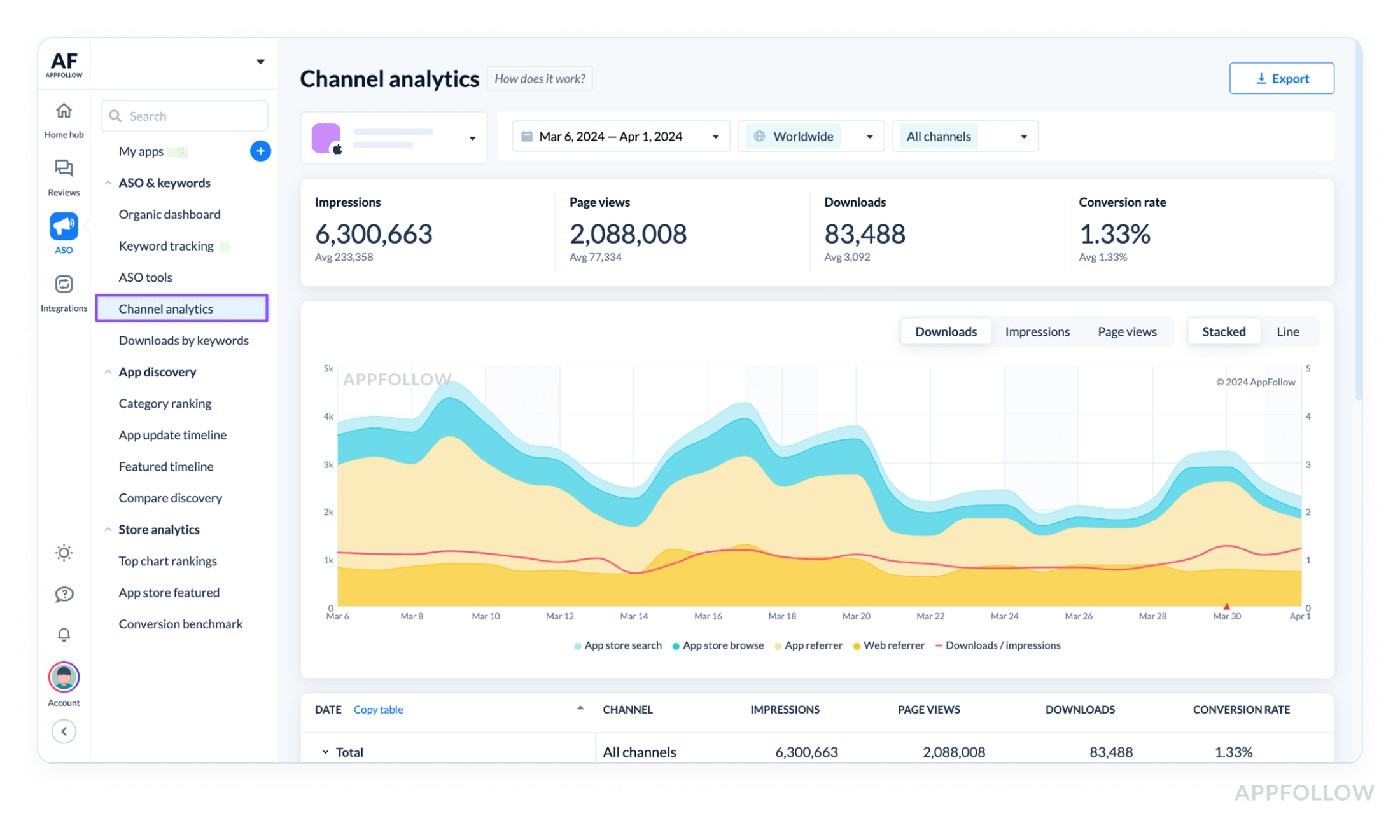
Test it live with a 10-days trial.
A fintech client celebrated 19k installs in one day. Channel Analytics revealed 82 % came from a paid burst in Spain; organic, there were only 900 installs, well below the +20 % organic tail finance teams aim for.
Reviews & ratings metrics
Ratings and reviews are the raw gossip of the App Store. Your growth curve eavesdrops on every word. I’ve watched AppFollow clients soar on a 4.8 badge, then nosedive when incremental ratings dipped, and no one caught the early rumble. Ratings, sentiment, and reply effect are predictive signals that your retention and paid UA are already betting on.
In this section, we’ll analyze the review and rating metrics we stare at daily. Average vs. incremental stars, volume trends, sentiment tags, reply wins, and even deleted review ghosts.
Average star ratings (both incremental & total)
Average star ratings keep your app’s reputation honest and sit right at the core of mobile app performance metrics. They break down into two slices: the total average, which tells the world your lifetime score, and the incremental average, which reveals how recent users feel, over the past 7, 30, or 90 days.
Crunching it is dead simple, and the formula is perfect for quick tracking:
When split by time frames, it’s your early-warning system that levels up observability. You’ll see this neatly charted in AppFollow under Reviews → Rating Analysis (Stars). Handy filters show your last 30 days side by side with all-time history.
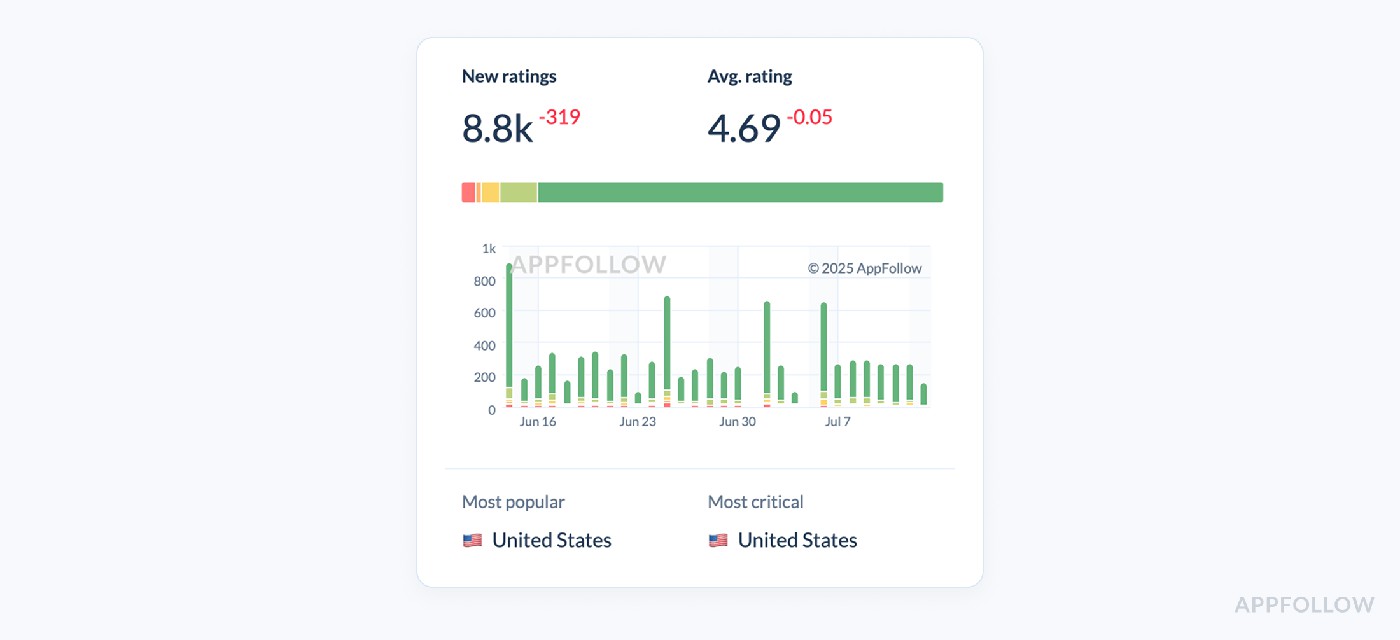
App rating dashboard in AppFollow. Test it live with a 10-days trial.
Now, drop into a call with a fintech client last month. They beamed at their global 4.2, feeling safe. But digging into their 30-day incremental…it dipped to 3.6 thanks to a bug they thought was minor in their software. In fintech, where industry averages hover around 4.0 – 4.3, that slip could tank conversion in weeks.
Rating analysis (breakdown by stars, trend over time)
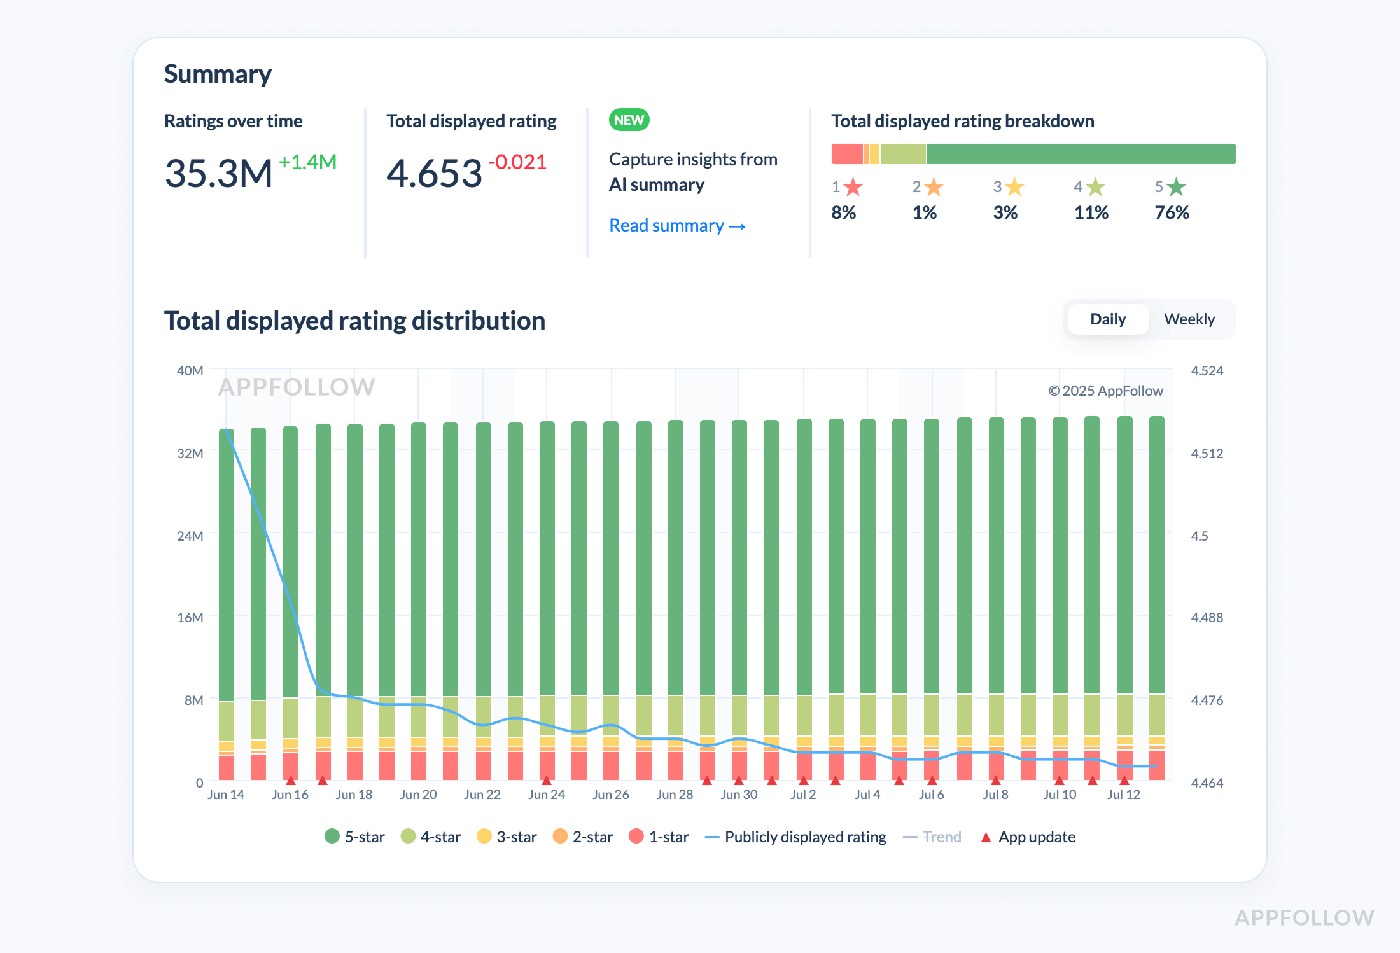
Funny how a shiny 4.2 average star rating can lull a product squad into thinking they’re bullet-proof. That’s why we cracked open App Ratings Analysis in AppFollow for that fintech client, to see the scaffolding beneath the headline number. The average shows the storefront; the star-level breakdown tells you what’s creaking behind it.
What we looked at
Navigate to Reviews → Rating Analysis (Stars) and switch the date range to “Last 90 days.” The chart stacks weekly counts of 5-, 4-, 3-, 2-, and 1-star reviews.
App rating dashboard in AppFollow. Test it live with a 10-days trial.
No fancy math, just # of ratings at each star level per time slice
Why it mattered: Their 1-stars blew up 47 % in four weeks after a login bug. Fintech benchmarks keep 1-stars under ~12 % of total; they were flirting with 20 %. That uptick quietly shaved two points off product-page conversion before anyone noticed.
Action checklist
- Set an alert: trigger when 1-stars exceed 15 % of weekly volume.
- Pull sentiment tags for those 1-stars (e.g., “KYC fail,” “crash on open”).
- Patch & reply within 48 h; re-run incremental rating after the hotfix.
- Cross-check review volume, if it’s dropping while 1-stars spike, brace for churn.
Do that, and the next time your dashboard flashes a “healthy” 4.2, you’ll know whether it’s solid steel or paper-thin plaster.
Read also: What Is Review Management: App Store Review Management In 2025
Review volume & trends
Review volume is exactly what it sounds like: the raw count of new reviews rolling in, sliced by days, weeks, or months. But what’s more telling is the trend line, whether that volume’s climbing, holding, or tapering off. Because steady feedback flow is fuel for ASO (reviews feed recency signals) and your first line of defense against hidden bugs.
Check your Review Volume & Trends metric:
- After an app update or bug fix release
- When running a new paid or organic UA campaign
- Following a feature launch or UI overhaul
- If your incremental star ratings start slipping
- During competitor app analysis
- Ahead of your next sprint planning or QBR
- Before scaling ad spend in new geos
There’s no fancy formula. It’s pure # of new reviews over selected period
Simple, but devastatingly revealing when plotted over time. In AppFollow you’ll catch this under Reviews → Review Analysis with a dashboard that’ll make any growth lead’s stomach flip if they’re heading the wrong way.
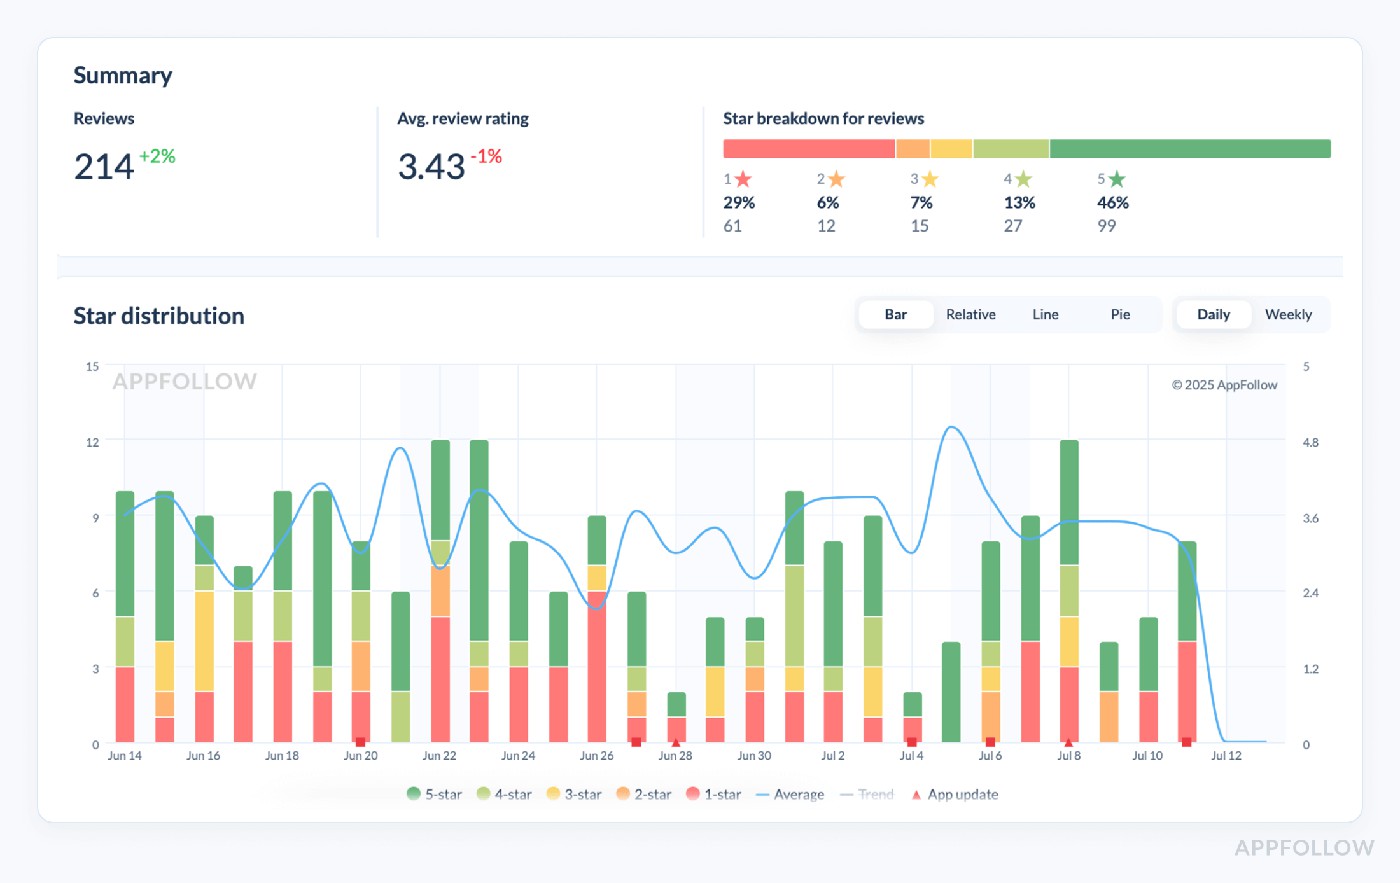
App review analysis dashboard in AppFollow. Test it live with a 10-days trial.
Thus, a year ago, Standard Bank’s app team was drowning in a flood of two-star rants about slow transfers. AppFollow’s Review Volume chart lit up like a siren, three-day surge, +540 reviews, sentiment deep red.
The fix is simple: flip on AI auto-replies, auto-tag “transfer delay,” and pipe those tags straight to the payments squad. Within a week, the surge cooled, 80 % of reviews were answered within seconds, and positive thumbs-ups jumped +646 %.
Their average stayed 4.4, protecting conversion during the busiest quarter.
Read also: How to spot and report fake reviews on Google & App Store: step-by-step guide
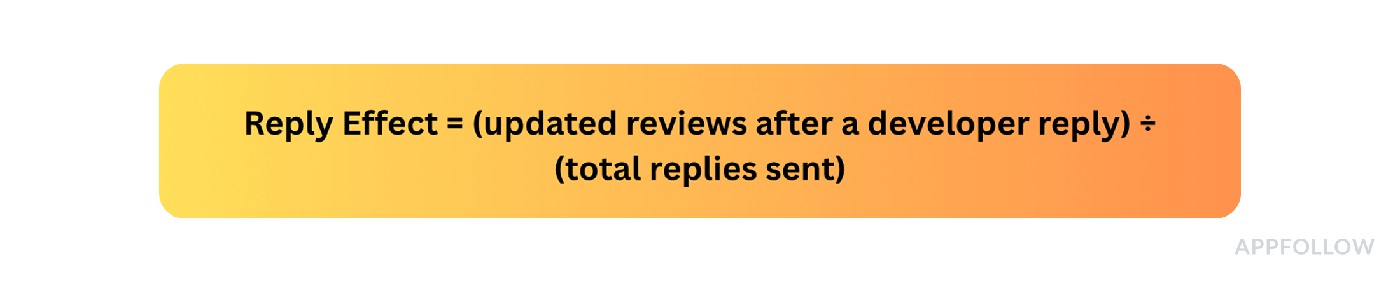
Reply effect tracking (e.g. how many users change their rating after you reply)
This metric zeroes in on one of the most overlooked levers of app reputation: how many users change their rating after you reply.
When to check reply-effect tracking
- Spike in low-star reviews or complaints
- Sudden drop in review volume
- Right after a major release or hotfix
- While auditing support impact
- Ahead of quarterly or board reviews
Those checkpoints keep cross-functional teams proactive and aligned.
The mechanic is simple: a user leaves a review (often salty), your support jumps in with a thoughtful reply, and ideally that 1-star morphs into a 4-star. At scale, that micro-moment moves retention across mature applications.
Treat it like critical APM metrics, straightforward signal, outsized impact.
In AppFollow, head to Reviews → Agent Performance. You’ll see a clean percentage and trend line, turning reputation into a first-class slice of your user-facing infrastructure dashboard.
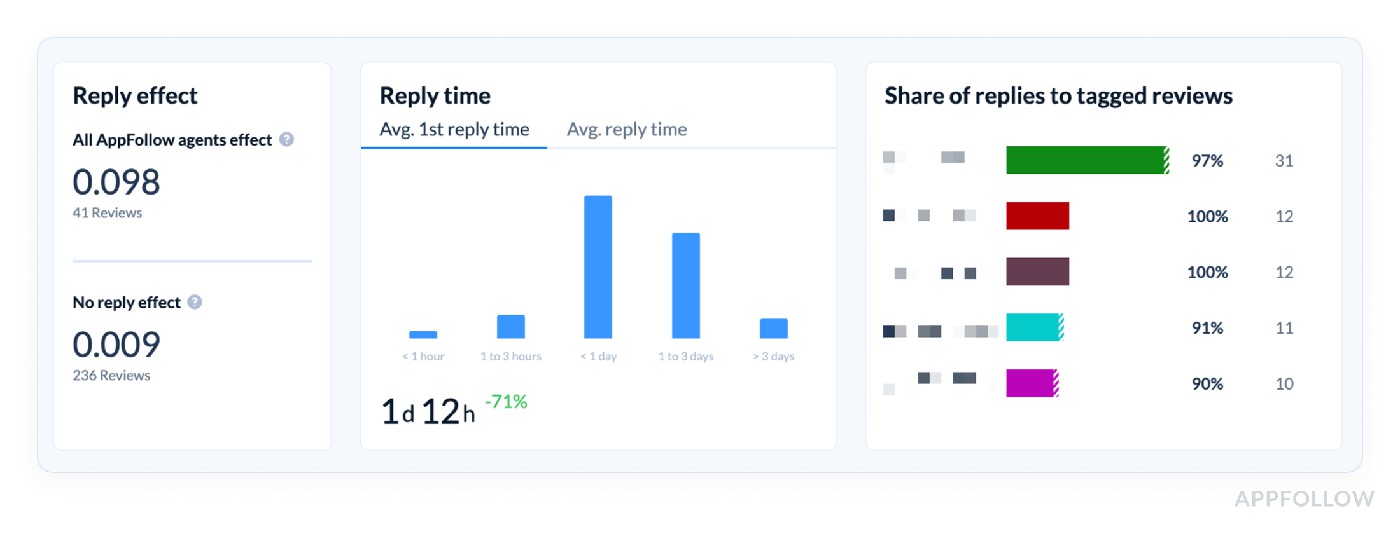
App review analysis dashboard in AppFollow. Test it live with a 10-days trial.
We opened it for a finance client: reply effect was 7 %. Healthy peers land 15-20 %, because money talk demands fast, clear fixes. A 7 % readout should flash the same color as a spike in mobile application performance metrics.
Sentiment analysis & auto-tags on reviews
This is one of those metrics we lean on right after reply effect tracking looks shaky, after any major release, or when review volume starts swinging wildly. Because while raw ratings tell you how users feel, sentiment and tags show why.
Technically, sentiment analysis parses reviews using NLP, auto-classifying them as positive, neutral, or negative. Auto-tags kick it up by clustering common words and issues into groups like “login issues,” “ads annoying,” or “love the new dark mode.”
No complex math to run, AppFollow does the heavy NLP lifting, serving it under Reviews → Semantic Analysis with clear % splits and top recurring phrases.
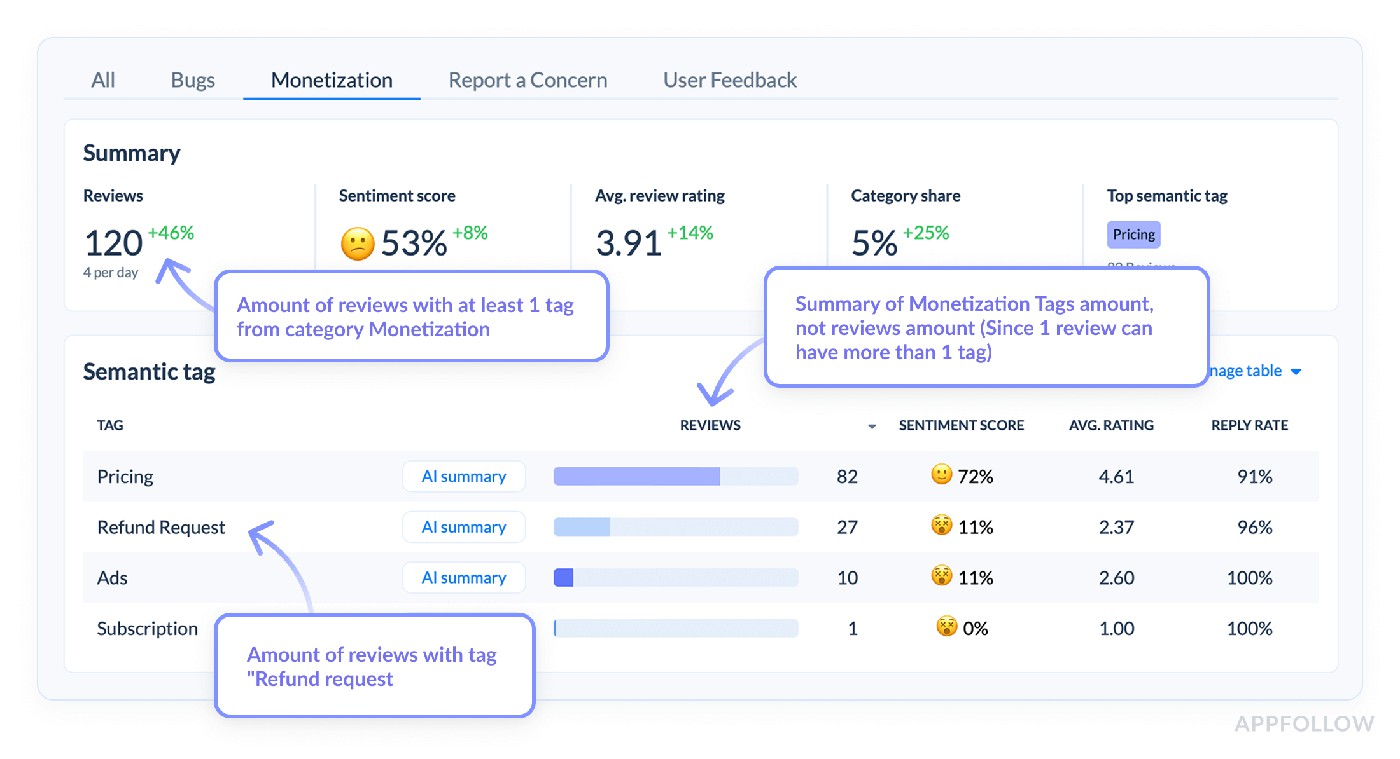
Semantic review analysis dashboard in AppFollow. Test it live with a 10-days trial.
We found their 1-star cluster for the past month was 68% tied to “cannot verify ID,” flagged by auto-tags. For fintech, that’s a hair-raising stat, since KYC pain directly tanks retention, benchmarks typically hold ID-related complaints under 20% of total negatives.
Turn review noise into sprint-ready tags Fire up AppFollow and tag sentiment automatically during your 10-days free trial | 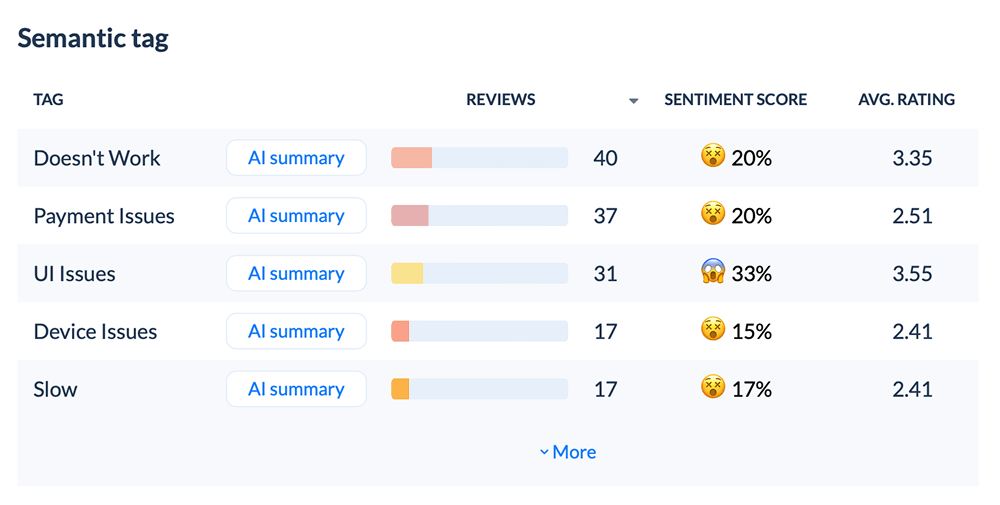 |
Review statuses & bulk actions (like tagging, closing, replying)
Review statuses & bulk actions are the ultimate operational gut check. They show you exactly how your team’s working through reviews, what’s new, what’s in progress, what’s resolved, plus let you tag issues, close them out, or fire off templated replies en masse.
Operational clarity of reviews by status (new, in progress, resolved, closed) tags by topic (login bug, payment fail, UI love, etc.), and the ability to batch-tag or bulk reply come straight from that view.
We usually lean on this after seeing sentiment clusters spike. Because once you know “ID verification” is crushing user mood, your next step is making sure your team’s on it. For that fintech crew, it turned out 61% of reviews tagged “KYC issues” were still stuck in “new.” In finance, where benchmarks often demand SLA responses within 48 hours, that was a glaring risk.
Ops folks will appreciate that the workflow syncs neatly with your APM dashboards, surfacing review hot spots alongside latency alerts.
Because every status change is logged, you can funnel the raw data straight into BI or Slack for real-time visibility.
Treat it as part of your broader application performance toolkit: if users are shouting about crashes, it’s as urgent as any spike in error rates. Plus, leadership finally gets performance metrics that tie customer voice to engineering output. It’s the same discipline you’d apply when tracking performance metrics for web application health.
Deleted reviews tracking
Deleted Reviews Tracking is the backstage pass to user frustration you’ll never catch by eyeing averages or sentiment curves alone. In AppFollow (Reviews → Reviews Feed) you get a timestamped ledger of every vanished review, complete with original star, country, and any surviving text snippet.
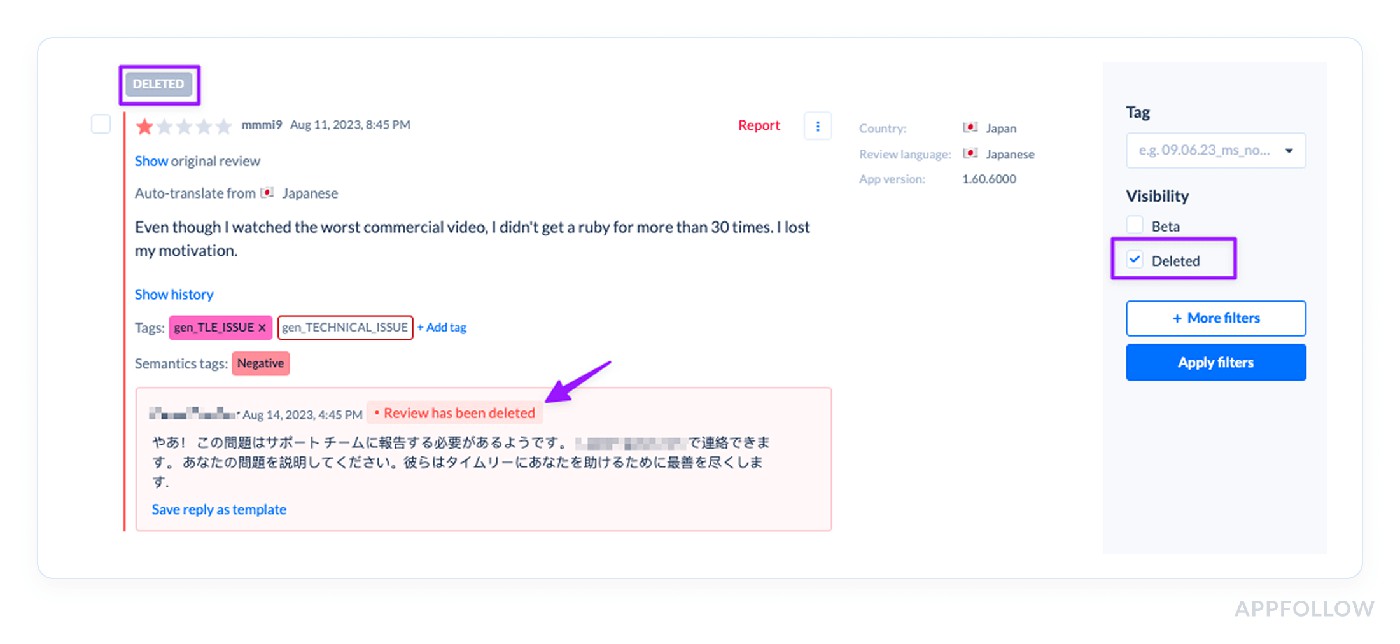
Test it live with a 10-days trial.
What to watch:
Red-Flag Signal | Why It Matters | First Response |
>5 % of total 1-stars disappear in a single week | Often means users rage-deleted instead of updating, or Apple’s spam filter blitzed a keyword group | Pull those review IDs, check matching crash logs or policy triggers, then label an RCA ticket in Jira |
Sudden purge of 4- and 5-stars | Store may be re-weighting inorganic reviews (promo codes, reward campaigns) | Audit UA sources and re-verify incentivized review flows |
Country-specific wipe-out | Localized bug or compliance strike | Align with geo crash analytics, confirm store-compliance changes |
When to check:
- Right after an update rolls out (especially if crash-rate spikes).
- The morning after a big promo or influencer push.
- Anytime you notice an unexplained swing in incremental star rating.
How to automate:
- Set a daily webhook from Deleted Reviews to Slack or PagerDuty if count > X.
- Pair each deleted review ID with its last known tag (“login fail,” “pricing gripe”) so CX can close the loop on open tickets.
- Feed the delta into your weekly retention report; a purge followed by rising uninstall rate often correlates at T+7 days.
If stars vanish without a matching ratings rebound, something’s festering under the hood, long before the average rating drops on your store page.
Read also: Proven Tips for Improving iOS App Store & Google Play Ratings to 5 Stars
Competitive intelligence performance metrics
Knowing your numbers is cute. Knowing your competitor’s next move is what protects your roadmap. And here are application performance monitoring metrics AppFollow clients track.
Competitor app tracking
Competitor app tracking is your scoreboard of what’s happening beyond your own data. It watches your rivals’ category ranks, top chart positions, featured placements, keyword climbs, review surges, ratings trends, and even metadata or update patterns. Basically, every lever they might be pulling to outpace you.
Inside AppFollow, it is easy to add your competitor for tracking, so you can quickly see if your biggest threat just jumped five ranks ahead in “Finance” in Spain, snagged a new App Store feature, or quietly started outranking you for your top keyword cluster.
Example of the competitor tracking dashboard:
Track your competitors live in AppFollow with a 10-days trial.
We had that same fintech client who’d been knee-deep fixing deleted reviews and reply lag, only to discover their main competitor rolled out a slick onboarding that halved their 1-star volume and vaulted them into the top 20. And while our client was congratulating themselves on stabilizing at #37, their rival was busy setting up the next phase of market capture.
Compare discovery & compare metadata pages (head-to-head with competitors on visibility & page content)
When rankings flatten, conversion wobbles, or a sprint roadmap is on the table, Compare Discovery + Compare Metadata is the first tab I open.
What you’ll see in seconds
- Compare Discovery – side-by-side keyword ranks, category positions, featured badges.
- Compare Metadata – titles, subtitles, descriptions, icons, screenshots, even local-language hooks lined up row-for-row.
How to read the evidence
Red Flag | Immediate Fix | Industry Guard-rail |
Rival outranks you by ≥10 positions on a core keyword | Re-balance subtitle keywords, run a creative A/B | Top-10 apps sit within 3–5 rank slots of each other |
Competitor packs ≥7 localized keywords in subtitle; you have ≤3 | Localize copy, mirror high-intent phrases | Benchmarks: 5–6 local keywords in health, 8+ in finance |
Their screenshots highlight streaks / social proof; yours are static | Add motion frames, numerical proof (“30-day streak”) | Visuals with benefit text lift CVR 10–15 % |
Real-world hit
Brazilian grocery-delivery start-up James Delivery thought its core keywords were “good enough.” After plugging the app and three direct rivals into AppFollow’s Compare tabs, the team realised competitors were outranking them on long-tail Spanish and Portuguese phrases they hadn’t even tried.
Actions they took inside AppFollow
- Compare Discovery → saw two rivals sitting in the upper-right “Visibility Leader” quadrant, while James lagged lower-left.
- Compare Metadata → spotted that competitors averaged 7–9 local keywords in subtitles; James had three. Screenshots also lacked any “delivery-in-minutes” promise.
- Added high-intent Portuguese phrases (“entrega rápida”, “supermercado em casa”), refreshed screenshots with 15-min delivery badge, and shipped the metadata update.
Results
- Search Visibility Score up 5.6 % on iOS and 5.3 % on Android within 45 days.
- Organic downloads from search rose in parallel, giving the UA team proof the changes, not paid campaigns, drove the lift.
Crack your rivals’ ASO playbook, free for 10 days Compare Discovery → live keyword & category rank head-to-head across every locale Compare Metadata → titles, subtitles, icons, screenshots lined up row-for-row, spot missing local hooks in seconds Auto-alerts when a competitor tweaks copy or jumps five positions Export-ready charts to brief execs and blitz sprints with proof Tap start a free trial and outmaneuver competitors before they refresh their store listings. | 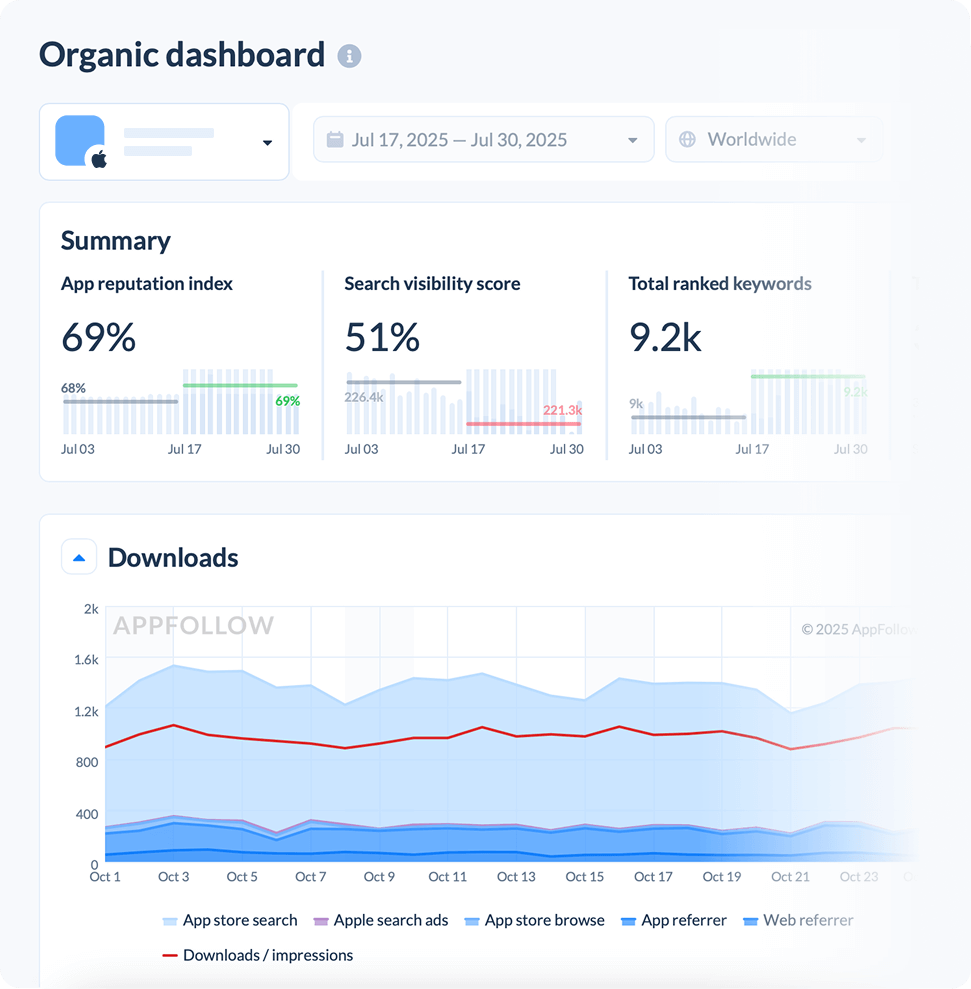 |
Which of these mobile app performance metrics are must have?
Most teams don’t track every metric we geek out on. They’ll skip half the application performance monitoring stack, ignore reply impact, or forget that continuous optimization means more than a monthly rank check.
You don’t need to chase every data point or crank out weekly reports on obscure exceptions or request rate if it doesn’t tie back to installs or lifetime value.
What you do need is a baseline cluster of must-haves, the non-negotiables. When we audit clients’ dashboards, we start with these anchors:
- Category rankings & top charts
- Search visibility & keyword ranks
- Download estimates & downloads by keyword
- Conversion benchmark
- Average star ratings & rating analysis
- Review volume & trends
- Sentiment analysis & auto-tags
- Reply effect tracking
- Compare discovery & compare metadata
These are the raw performance metrics that show if your app’s discoverable, converting, delighting (or quietly annoying) users, and stacking up against your top rivals. You’d be shocked how many applications pump money into new creative sets without ever pulling their time series data to see how average response or conversion evolved, or measure how fast ratings slipped after that new onboarding flow.
So yeah, before diving into response times, obscure APM charts, or infra exceptions, make sure you’re at least tracking these essentials.
Read also: AI Reputation Management: How to Secure Your Brand’s Reputation with Ease
How to start measuring app performance analytics with AppFollow
The platform turns raw store data into decision-ready insight, bridging app performance analytics with the daily grind of release cycles.
At a glance, you’ll track category ranks, keyword visibility shifts, featured placements, download estimates by country, conversion benchmark, rating analysis, sentiment auto-tags, reply effect, and competitor discovery. Need deeper application performance monitoring metrics? Tie in ratings velocity, review volume trends, and alert rules so no spike slips past your observability radar.
Mobile app performance analytics live on the Dashboard tab; drill further to surface granular review tracking, metadata compare grids, and ASO keyword cohorts in real time. Every metric stores historical data for accurate cohort cuts.
What you get out of the box
- Category & top-chart tracking
- Keyword ranks, search visibility, and feature alerts
- Download estimates by country / keyword
- Conversion benchmark and funnel drop-off views
- Average rating, incremental stars, sentiment + auto-tags
- Reply-effect and review-status workflows
- Deleted-review logs for stealth churn
- Compare Discovery & Compare Metadata grids
- Webhooks / exports to feed your existing APM or BI stack
- Custom alerts on any performance metrics spike for round-the-clock observability
Together, those pieces cover the core application performance monitoring metrics you need, ranking velocity, review pulse, funnel health, without drowning your applications in busywork. The app analytics platform archives everything in real time, letting you slice cohorts by locale, version, or campaign and prove application performance gains on demand.
cta_demo_request_yellow
FAQs
Which keyword metrics (popularity, KEI, difficulty) should top my ASO dashboard, and how often should I refresh them?
Lead with popularity (search demand), layer in difficulty (how hard it is to crack page 1), then use KEI to find the sweet-spot crossroads. Refresh weekly for your core 50 terms; refresh daily if you’re running a live UA burst so your teams can pivot before spend is wasted. Treat it the same way back-end engineers watch web application performance metrics, high-frequency polling keeps tiny blips from becoming trendlines.
How do I translate my category rank jumps into a real install forecast?
Pull yesterday’s performance data: installs, rank, country. For each +1 rank shift, apply a 3-7 % uplift curve (varies by category; Fitness leans closer to 3 %, Games to 7 %). Multiply that factor across the whole ladder you climbed. Yes, it’s a quick-and-dirty model, but it’s battle-tested and fast enough for sprint planning time boxes.
Can featured-placement spikes be separated from paid boosts inside AppFollow, or do I need a separate BI layer?
AppFollow logs every feature flag by locale and dates it. Overlay that with your UA spend window; the delta shows pure organic uplift. Unless you need multi-touch attribution, no extra BI sheet required. Think of it as the ASO cousin to apm, one console, multiple signals.
What’s a healthy conversion benchmark for a freemium fitness app in the US right now?
We’re seeing application pages convert at 32 – 38 % from product-page view to install. If you’re below 30 %, your screenshots or social proof need triage; above 40 %, ping me for a case study.
How accurate are AppFollow’s download estimates vs. App Store Connect, and how do I explain any gaps to my CFO?
Expect ±10 % variance on high-volume days, tighter on long-tail geo installs. Estimates use rank-to-install modeling, whereas Connect shows raw data post-attribution. Pitch it as a directional compass for app revenue analytics; Connect remains the ledger.
Which downloads-by-keyword report helps me spot cannibalization between similar phrases?
Jump into ASO → Downloads by Keyword, sort by “share %.” When “guided breathing” and “breathing guide” split the same pie, kill the weaker one and re-allocate bids. It’s your keyword version of pruning slow SQL queries in web application performance metrics.
At what point does an incremental star rating dip become a red flag for churn?
A 0.3-point drop over any 30-day window is my siren. In mobile app performance analytics terms, that’s like a 500 ms spike in average latency, bad things follow fast.
How do I structure auto-tags so sentiment analysis feeds directly into sprint planning?
Create three parent buckets: UX friction, feature love, billing pain. Child tags get granular (“login fail,” “audio lag”). Push those tags to Slack with Zapier so dev squads grab live tickets while the application memory is fresh.
What reply-effect percentage should I target to prove our support SLA is working?
Aim for 15 – 20 %. That means one in five reviewers bumps their rating after your team steps in. Anything lower and you’re firing blanks; anything higher means you deserve a raise, or better tools to scale the workflow.