Gaming Reply Rate Benchmarks 2026: What 51.5 Million Reviews Reveal About the Studios Winning the Reputation Game

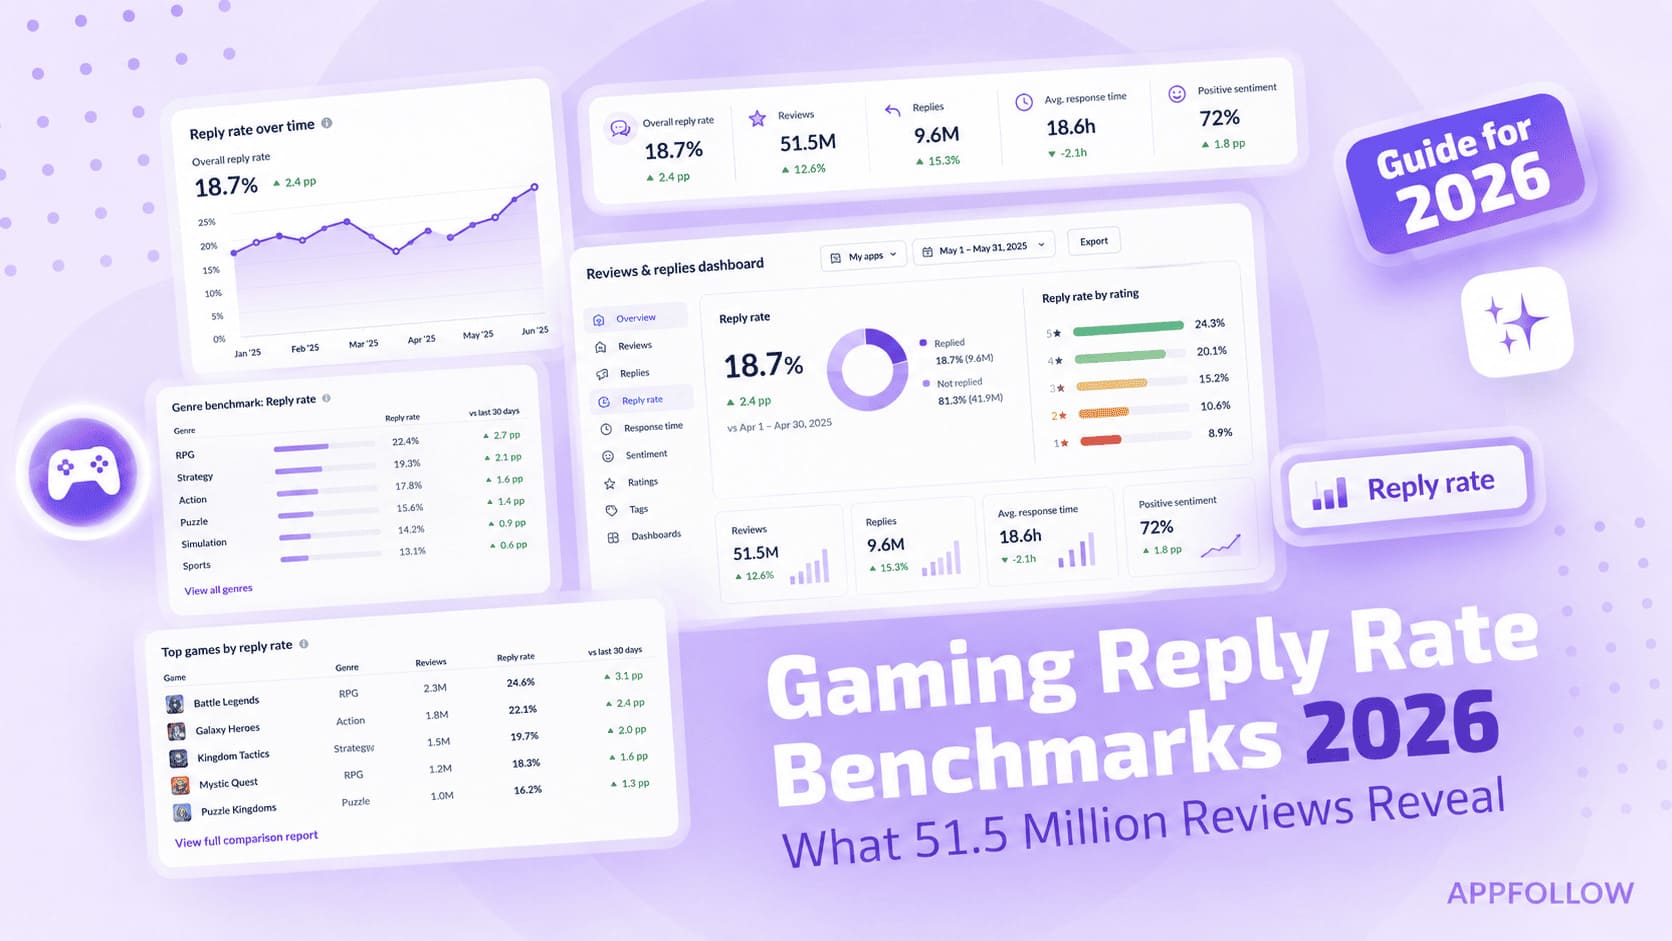
Table of Content:
- Key insights at a glance
- How we collected this data
- 2026 reply rate benchmark snapshot: global vs. featured vs. AppFollow
- Why reply rate matters in 2026
- What is reply rate in mobile gaming?
- The most important chart in the 2026 report
- The headline numbers — and the silence problem
- Google Play vs. App Store — same game, two different operational realities
- Reply rate by star rating — where AppFollow clients put their effort
- The AI speed advantage — 12x faster, same coverage
- Reply rate by genre — the operator’s tell
- What rating recovery actually looks like — Toca Boca and Fingersoft
- How reply rate influences your role specifically
- The featured-games cautionary tale
The average mobile game replies to 24.8% of its reviews in 2026.
AppFollow clients reply to 52.4% — more than double. The mechanism behind that gap matters more than the headline: apps that reply to 30–50% of reviews carry a 3.77 average store rating, compared to 3.25 for apps replying to less than 1%. Half a star, documented across 51.5 million reviews.
AI-powered replies arrive in 24.8 hours on average, against 299.3 hours for manual replies. Twelve times faster, same coverage. And 29% of gaming apps still don’t reply to a single review.
Key insights at a glance
- Global average reply rate: 24.8% (24.5% Google Play, 23.9% App Store).
- AppFollow client reply rate: 52.4% (51.1% Google Play, 55.1% App Store).
- Featured games (the top 100 platform-promoted apps): 17.4% reply rate. Lower than global.
- Share of apps replying to any reviews: 92–94% AppFollow clients, 78% featured GP / 41% featured AS, 72% global GP / 66% global AS.
- 29% of gaming apps never reply to a single review.
- Reply effect: apps that reply at all average 3.61 stars. Apps that never reply: 3.18. A +0.42 lift, before any optimization.
- Peak rating bucket: 30–50% reply rate → 3.77 average store rating.
- AI reply speed: 24.8 hours average. Manual: 299.3 hours. 12x faster.
- Reply rate by star rating (AppFollow clients): 1-star 69.4%, 2-star 73.8%, 3-star 70.9%, 4-star 67.8%, 5-star 63.7%.
- Highest-reply genre on Google Play: Board (47%). Lowest: Sports (4.7%).
- Highest-reply genre on App Store: Casino (47.1%). Lowest: Trivia (2.2%).
- Customer cases: Toca Boca 3.1 → 4.1 stars; Fingersoft reply rate 36.77% → 71.76%, reply effect flipped from -0.3 to +0.15.
How we collected this data
AppFollow Research · Data range: January 1, 2025 to January 1, 2026
Sample. 51.5 million reviews and 561,000+ developer replies across 22,800+ gaming apps on Apple App Store and Google Play. Includes a non-aggregated dataset of 2,115 individual apps (1,797 on Google Play, 318 on App Store) for app-level distribution analysis, plus the top 100 featured games chosen by the platforms in 2025.
Sources. First-party AppFollow telemetry across 1,000+ managed client apps (64% Google Play, 36% App Store), plus public store data ingested through the AppFollow Reviews API across 15 gaming genres.
Benchmarks. Three tiers compared head-to-head: global (the whole market), featured (the top 100 apps each platform chose to promote during 2025), and AppFollow clients (managed apps using our review-management and AI reply tooling).
Caveats. Sentiment is scored at review level via AppFollow’s in-house classifier and requires a minimum review volume. About 400+ apps in the non-aggregated set carry a store rating of zero due to insufficient ratings. Top 10% and bottom 10% segments are based on store rating percentiles, not revenue or volume.
2026 reply rate benchmark snapshot: global vs. featured vs. AppFollow
Metric | Global market | Featured games | AppFollow clients |
|---|---|---|---|
Avg reply rate (blended) | 24.8% | 17.4% | 52.4% |
Google Play reply rate | 24.5% | 25.0% | 51.1% |
App Store reply rate | 23.9% | 38.0% | 55.1% |
Share of apps replying at all (GP / AS) | 72% / 66% | 78% / 41% | 92% / 94% |
Avg store rating | 3.48 | 4.34 | 4.30 |
AI reply time | — | — | 24.8 hours |
Manual reply time | 299.3 hours | — | — |
Reply effect (vs. silent apps) | +0.42 stars | — | — |
Key takeaway: AppFollow clients reply at roughly 3x the global rate — and out-cover even the platform-curated featured games on both stores. The half-star rating gap underneath those numbers is the rest of this article.
Why reply rate matters in 2026
Open your store page right now. Scroll past the screenshots. Look at the review section.
That tiny conversation is the most public-facing performance review your game gets. Players read it before they install. Apple and Google read it in their featuring algorithms. Your competitors read it when they’re looking for openings.
And the data is clear about what happens when a studio shows up versus when it stays silent. The 2026 benchmark covers 51.5 million reviews and 561,000 developer replies across 22,800 gaming apps. The shape of the relationship between reply rate and store rating is consistent. Across genres, platforms, and review volumes, the studios talking back are the studios pulling ahead.
Anatoly Sharifulin, CEO and co-founder at AppFollow, puts it plainly: "A timed response to a review is often the thing that keeps a player from uninstalling, and a bad reputation compounds faster than most studios realize."
What is reply rate in mobile gaming?
Reply rate is the share of player reviews receiving a developer response, measured at review level and reported per genre, per store, and per team. AppFollow calculates reply rate excluding store-moderated and shadow-banned responses, and separates AI-generated replies from agent-written replies for benchmarking.
Where does your team actually sit?
Quick diagnostic before the deep dive. Match your current reply rate to one of the bands below.
- 0% — You are in the silent third. 29% of gaming apps never reply to a single review. Avg store rating: 3.18.
- 1–10% — Reactive coverage. Avg store rating in this band: 3.55.
- 10–30% — Operational coverage. Avg store rating: 3.50 (the curve flattens here before the jump).
- 30–50% — Sweet spot. Avg store rating: 3.77. This is where the curve peaks.
- 50%+ — AppFollow client territory. Avg store rating: 3.73 (slightly lower than the 30–50% band, but more durable to drift).
Key takeaway: If you move your reply rate from below 1% into the 30–50% sweet spot, the historical data predicts a +0.52 star uplift on average. That is the lever.
The most important chart in the 2026 report
Half a star sounds small until you remember what half a star does inside the store algorithms. Visibility shifts. Featured eligibility shifts. Organic install velocity shifts. CPI on paid acquisition shifts because store-page conversion shifts.
Veronika Bocharova, Customer Success Manager at Appfollow:
"Silence is costing Gaming apps growth. While almost a third don’t reply to reviews, those that engage smartly, focusing on negative feedback first, see measurable rating increases (up to +0.42). Better ratings drive more downloads, and ultimately, more revenue."
The +0.42 number is the baseline reply effect — what every gaming app earns just by replying to anything at all, versus replying to nothing. The 30–50% sweet spot stacks more on top.
The headline numbers — and the silence problem
24.8% blended global average. That means roughly one in four reviews gets a developer reply. The other three sit on the public page indefinitely, unanswered, working as either neutral background noise or active deterrent depending on what they say.
The silence problem shows up worse when you look at the binary version: does this app reply to any reviews at all, ever?
- AppFollow clients: 92% on Google Play, 94% on App Store reply to at least some reviews.
- Featured games: 78% on Google Play, 41% on App Store. Six out of ten featured iOS games never reply.
- Global market: 72% on Google Play, 66% on App Store.
Six out of ten featured iOS games never reply. The apps Apple chose to promote — many of them with hundreds of thousands of reviews — sitting in total silence. Some of that is structural (App Store moderation delays make manual replies feel pointless to skeptics). Most of it is missed opportunity.
Google Play vs. App Store — same game, two different operational realities
Reply rates land within a single percentage point on the two stores globally — 24.5% Google Play, 23.9% App Store. The story underneath is different.
Google Play surfaces a developer reply in minutes. The App Store puts replies through a moderation cycle that historically adds a multi-day delay. The result is two completely different reply economies. Studios investing in App Store replies see slower visible payoff, which feeds back into lower coverage at the global level (except among AppFollow clients, where the App Store actually edges Google Play at 55.1% vs. 51.1%).
The sentiment data tells the same story from another angle. Google Play averages a sentiment score of 65.5. The App Store sits at 46.4. A 19-point platform gap that holds across nearly every genre. App Store users write more critical text relative to their star ratings — and they reward replies more meaningfully when those replies actually land.
Key takeaway: Stop benchmarking your App Store reply operations against your Google Play numbers. The platforms run on different feedback loops. Build separate KPIs and separate response-time SLAs.
Reply rate by star rating — where AppFollow clients put their effort
Most studios reply to 1-star reviews (damage control) and 5-star reviews (the easy thank-yous). The 2, 3, and 4-star reviews get neglected. This is the most fixable mistake in the 2026 dataset.
How AppFollow clients distribute their replies by star rating
- 1-star: 69.4% reply rate
- 2-star: 73.8% — the highest of any tier
- 3-star: 70.9%
- 4-star: 67.8%
- 5-star: 63.7%
Notice the shape. 2-star gets the highest coverage. Why? Because 2-star reviewers are unhappy but not furious. They wrote a complaint specific enough to act on. Reply to a 2-star with a real answer and a meaningful share will update their rating upward inside the engagement window.
How the bottom 10% of apps spend their reply budget
- 5-star: 48.4% of replies go here
- 1-star: 28.1%
- 2-star: 8.7%
- 3-star: 7.1%
- 4-star: 7.6%
Half the reply budget goes to people who already love the game. A quarter goes to firefighting. The middle tier — the most convertible cohort — gets almost nothing. The pattern is reactive, not strategic.
Key takeaway: Shift reply prioritization toward the 2–4 star middle band. AppFollow clients cover 67–74% of those reviews. The global average covers 7–9%. The gap is the opportunity.
The AI speed advantage — 12x faster, same coverage
Manual replies in the 2026 dataset average 299.3 hours. Twelve and a half days. By the time a manual reply lands, the player has uninstalled, moved on, or forgotten the issue. The reply becomes archival material for future readers rather than recovery for the actual reviewer.
AI-powered replies through AppFollow average 24.8 hours. Roughly one day. Inside the window where the player might still update their rating.
Veronica Cherenkova, Lead Support Manager at Easybrain:
"In 2026, using AI in review management won’t be a differentiator — everyone will be doing it. The advantage will be keeping the experience personal at scale. Automation should handle the routine, but humans must still own empathy, accountability, and product expertise. Players don’t mind AI — what they mind is the feeling of being processed."
That framing matters. The 12x speed advantage compounds the +0.42 reply effect into something larger across a year of operations. AppFollow clients running this pattern average a 4.30 store rating against the global 3.48.
Reply rate by genre — the operator’s tell
Reply discipline varies wildly across genres. Some categories operate reviews like a product channel. Others run on autopilot.
Google Play global reply rates by genre Board — 47.0% Casino — 44.8% Trivia — 37.6% Word — 30.1% Puzzle — 26.1% Casual — 25.0% Adventure — 23.2% Action — 22.2% Card — 20.3% Simulation — 19.3% Role Playing — 17.7% Arcade — 16.8% Strategy — 16.4% Racing — 15.8% Sports — 4.7% | App Store global reply rates by genre Casino — 47.1% Board — 40.0% Word — 32.0% Adventure — 28.3% Card — 26.6% Casual — 22.1% Puzzle — 21.0% Strategy — 15.0% Arcade — 12.1% Action — 11.6% Simulation — 8.5% Role Playing — 8.0% Sports — 7.9% Racing — 3.5% Trivia — 2.2% |
Board and Casino lead on both platforms. Sports trails badly on both. Trivia inverts hard — strong on Google Play (37.6%), almost absent on the App Store (2.2%). Some of that is genre demographics. Some is studio culture. Most of it is operational.
Key takeaway: If your game is in a low-reply genre (Sports, Racing, Trivia on App Store), the competitive set is leaving the review channel wide open. A studio that lifts coverage to even 30% becomes structurally the most attentive developer in the category.
Where AppFollow clients land — genre by genre
Across nearly every gaming genre, AppFollow clients beat the global reply rate by a wide margin. The Google Play averages run about 2.5x the global rate. On the App Store, the spread is even larger — sometimes 10x or more.
- Google Play AppFollow client average: 45.8% (vs. 24.5% global).
- Board games on Google Play: 65.5% (vs. 47.0% global).
- Word games on Google Play: 55.8% (vs. 30.1% global).
- Simulation on App Store: 49.3% (vs. 2.2% global).
- Casino on App Store: 74.3% (vs. 47.1% global).
Automation explains a chunk of that. The Arcade genre on AppFollow runs at 96% automation rate — almost every reply handled by AI. Simulation 83.9%. Racing 68.7%. Board, by contrast, runs at 20.1% automation, because Board game players write more multiplayer and rules questions that benefit from human judgment.
What rating recovery actually looks like — Toca Boca and Fingersoft
Two AppFollow clients published their numbers in the 2026 benchmark. Concrete trajectories beat category averages every time.
Toca Boca: 3.1 → 4.1 stars
Jonny Hair, Senior Customer Experience Manager at Toca Boca: "We managed to get the total review score from 3.1 stars to 4.1 using AppFollow. The road that we’re taking is the right one."
A full star of rating recovery is the kind of move that shows up everywhere downstream — search ranking, store-page conversion, paid acquisition CPI, organic install velocity. Toca Boca shipped it on the back of structured review management.
Fingersoft: reply rate doubled, reply effect flipped
Antti Pennanen at Fingersoft: "In 2025, granular data allowed us to track what responses help the most, doubling our efficiency and flipping our impact. Reply Rate: increased from 36.77% to 71.76%. Reply Effect: shifted from -0.3 to +0.15."
The reply-effect flip from negative to positive is the more telling shift. Their replies stopped accidentally dragging ratings down and started actively pulling them up. That trajectory compounds over a year.
How reply rate influences your role specifically
Same dataset, four different operational lenses. Here’s what the data means depending on which seat you’re in.
For game developers
Reply rate is the cheapest performance lever in your stack. It demands no engine work, no QA cycles, no live ops campaign. Move from <10% coverage to the 30–50% sweet spot and the historical data predicts roughly +0.5 stars.
That delta compounds into rank position and featuring eligibility.
Watch the 2–4 star band especially — those reviews almost always name a specific bug, balance issue, or UX friction worth a sprint. Sentiment-by-feature-tag in AppFollow surfaces the categories that are dragging your sentiment down, two to three weeks before the headline rating actually moves.
For game publishers
Reply rate as a portfolio KPI does two things.
- It predicts which titles are about to lose ranking before the rating shows it.
- It’s the cheapest cross-portfolio lift you can run. Set a portfolio-wide reply-rate floor (30%+ is the recommended baseline given the 3.77 rating peak at this band) and centralize the AI tooling.
The Toca Boca case (3.1 → 4.1) and Fingersoft case (reply rate 36% → 72%, reply effect flipped) are the precedents. Both are AppFollow-supported trajectories.
For marketers and ASO leads
Reply rate feeds two of your most important conversion variables.
- Store-page conversion. The featured-review section is the first thing a non-installer reads. If half those featured reviews carry visible developer replies, perceived quality rises and so does install conversion.
- Paid acquisition CPI. Higher store rating equals higher store-page conversion equals lower effective CPI on the same creative.
The economics of reply rate are downstream of rating, but they’re real. A studio sitting at 3.5 stars and lifting to 4.0 will see paid CPI drop in the same quarter.
For support and player-experience leads
Public-facing reviews are the highest-leverage support channel you have. A response to a 2-star review on the App Store reaches the original reviewer plus every shopper reading the store page for the next twelve months.
Dmitry Gerastenok at G5 Entertainment:
"Every response to a player review is both a support action and a public statement. Sometimes, calming a wave of negative reviews is more important than solving a single case."
The 2-star band (73.8% reply rate in the AppFollow cohort) is where your team gets the highest return on response hours.
The featured-games cautionary tale
Featured games — the top 100 apps each platform chose to promote during 2025 — average a 17.4% reply rate. Lower than the global average.
Six out of ten featured App Store games never reply. The store-vs-review rating gap among featured games on the App Store is +1.48 stars, meaning current reviews are running a star and a half below the cumulative number. That gap is gravity. Recent reviews drag historical averages down over time, and the featuring window closes before the rating catches up.
Featuring without review operations is borrowed time. The studios that hold featured slots over multiple cycles are the ones running reply discipline alongside the featured slot.