Average Mobile Game Rating 2026: What 51.5 Million Reviews Tell Us (And Why a Half-Star Gap Is Costing You Downloads)

Table of Content:
- Key insights at a glance
- How we collected this data
- 2026 benchmark snapshot: where the market stands, and where AppFollow clients stand
- Where does your game actually sit?
- The most important chart in the 2026 report
- What is a “good” average rating for a mobile game in 2026?
- What a real rating-recovery looks like — Toca Boca and Fingersoft
- Google Play vs. App Store — same game, two different scoreboards
- The AI reply speed advantage — 12x faster, same coverage
- The featured-games cautionary tale — high ratings, declining reviews
- Where the rating uplift actually comes from — middle-of-distribution reviews
- Negative 5-stars and positive 3-stars — the texture under the star count
The average mobile game store rating across 22,800+ apps in 2026 is 3.48. AppFollow clients average 4.30 — a +0.82 differential over the global market. The mechanism behind that gap is documented in the data: apps replying to 30–50% of reviews carry a 3.77 average store rating versus 3.25 for apps replying to less than 1% of reviews.
Half a star. Same store algorithms. Different downloads. One AppFollow client (Toca Boca) moved from 3.1 to 4.1 stars using the same playbook.
Key insights at a glance
- Dataset: 51.5 million reviews across 22,800+ gaming apps, 561,000+ developer replies, Jan 2025 – Jan 2026.
- Global average store rating: 3.48 across the entire gaming market.
- AppFollow client average: 4.30 (+0.82 vs. global).
- Featured games (top 100 promoted by the platforms): 4.34 average store rating.
- Apps that never reply to a single review: 3.18 average rating. 29% of gaming apps fall into this bucket.
- Apps that reply to any reviews: 3.61 average — a +0.42 reply effect.
- Peak performance: apps replying to 30–50% of reviews carry a 3.77 average store rating.
- Platform gap: Google Play global avg 3.44 vs. App Store global avg 3.75. App Store featured games top at 4.43.
- AI reply speed advantage: 24.8 hours average vs. 299.3 hours for manual replies. 12x faster.
- Sentiment gap by platform: Google Play 65.5 vs. App Store 46.4 (19-point structural difference).
- Real-world case: Toca Boca moved review score from 3.1 to 4.1 stars using AppFollow review management.
- Fingersoft: reply rate 36.77% → 71.76%, reply effect shifted from -0.3 to +0.15.
How we collected this data
AppFollow Research · Data range: January 1, 2025 to January 1, 2026
- Sample. 51.5 million reviews and 561,000+ developer replies across 22,800+ gaming apps on Apple App Store and Google Play. Includes a non-aggregated dataset of 2,115 individual apps (1,797 on Google Play, 318 on App Store) for app-level distribution analysis, plus the top 100 featured games chosen by the platforms in 2025.
- Sources. First-party AppFollow telemetry across 1,000+ managed client apps (64% Google Play, 36% App Store), plus public store data ingested through the AppFollow Reviews API across 15 gaming genres.
- Benchmarks. Three tiers compared head-to-head: global (the whole market), featured (the top 100 apps each platform chose to promote during 2025), and AppFollow clients (managed apps using our review-management and AI reply tooling).
- Caveats. Sentiment is scored at review level via AppFollow’s in-house classifier and requires a minimum review volume. About 400+ apps in the non-aggregated set carry a store rating of zero due to insufficient ratings. Top 10% and bottom 10% segments are based on store rating percentiles, not revenue or volume.
2026 benchmark snapshot: where the market stands, and where AppFollow clients stand
Metric | Global market | Featured games (platform-curated) | AppFollow clients |
|---|---|---|---|
Avg store rating | 3.48 | 4.34 | 4.30 |
Google Play store rating | 3.44 | 4.29 | 4.36 |
App Store rating | 3.75 | 4.43 | 3.99 |
Avg reply rate | 24.8% | 17.4% | 52.4% |
Reply rate (Google Play) | 24.5% | 25.0% | 51.1% |
Reply rate (App Store) | 23.9% | 38.0% | 55.1% |
Share of apps that reply at all | 71% | 66% | 92–94% |
Avg sentiment score | 55.95 (blended) | — | 65+ |
Key takeaway: AppFollow clients beat the global average by +0.82 stars on store rating — and out-perform even the platform-curated featured games on reply rate by roughly 3x. The story underneath those numbers is the rest of this article.
Where does your game actually sit?
Before the analysis, a quick gut check. Find your store rating below.
- 4.30+ — You are in the AppFollow client neighborhood. Your job is to defend the position.
- 3.77 — You are in the sweet spot of the global market: replying to 30–50% of reviews.
- 3.61 — You are in the “replies to some reviews” cohort. The reply effect is working for you.
- 3.48 — You are at the global average. Median territory across the entire gaming market.
- 3.25 — You are in the “replies to under 1% of reviews” bucket. This is the structural floor.
- 3.18 — You are with the 29% of games that never reply. The data says this position is a leaky boat.
Key takeaway: Every 0.4–0.5 star difference on this list maps to a documented behavior. Where you sit is mostly a function of what your team does with the review channel.
The most important chart in the 2026 report
Half a star may not sound like much. In app store algorithms, half a star changes what gets surfaced, featured, and recommended.
The 2026 dataset of 2,115 individual apps shows the relationship cleanly.
- Apps replying to 0–1% of reviews: 3.25 average store rating.
- Apps replying to 1–10%: 3.55.
- Apps replying to 10–30%: 3.50.
- Apps replying to 30–50%: 3.77 (peak).
- Apps replying to 50–100%: 3.73.
The curve flattens above 50%. The slope from 0% to 30–50% is where the actual rating uplift lives.
"Silence is costing gaming apps growth. While almost a third don’t reply to reviews, those that engage smartly, focusing on negative feedback first, see measurable rating increases (up to +0.42). Better ratings drive more downloads, and ultimately, more revenue."
What is a “good” average rating for a mobile game in 2026?
The honest answer depends on which tier you are benchmarking against.
- 4.30+ — AppFollow client average. The bar set by teams running structured review operations.
- 4.34 — Average for featured games (the top 100 apps the platforms chose to promote in 2025).
- 3.48 — Global market average across 22,800+ apps. Anything above this puts you in the upper half.
- 3.18 — Average for the 29% of apps that don’t reply at all. Below this number is the warning zone.
The implication: "good" in 2026 starts at 4.0. The market average is closer to 3.5, but the algorithms reward apps that hit the upper bands. Half-star differences compound into ranking position, featuring eligibility, and organic install velocity.
What a real rating-recovery looks like — Toca Boca and Fingersoft
Two AppFollow clients published their numbers in the 2026 benchmark report. The trajectories are useful as concrete proof, not just averages.
Toca Boca: from 3.1 to 4.1 stars
Jonny Hair, Senior Customer Experience Manager at Toca Boca:
"We managed to get the total review score from 3.1 stars to 4.1 using AppFollow. The road that we’re taking is the right one."
A full star of rating recovery is the kind of move that changes everything downstream — store ranking, conversion, paid acquisition CPI, the lot. Toca Boca shipped it on the back of structured review management.
Fingersoft: reply rate doubled, reply effect flipped
Antti Pennanen at Fingersoft:
"In 2025, granular data allowed us to track what responses help the most, doubling our efficiency and flipping our impact. Reply Rate: increased from 36.77% to 71.76%. Reply Effect: shifted from -0.3 to +0.15."
The reply effect going from negative to positive is the more telling number. It means the team’s replies stopped accidentally dragging ratings down and started actively pulling them up. That’s the shift that compounds over a year.
Key takeaway: Rating recovery at scale is documented, repeatable, and tooling-supported. Toca Boca, Fingersoft, and the broader AppFollow client base are running the same playbook the data points toward.
Google Play vs. App Store — same game, two different scoreboards
Store ratings split by platform reveal a structural difference any cross-platform studio needs to model separately.
Tier | Google Play store rating | App Store store rating |
|---|---|---|
Global average | 3.44 | 3.75 |
Featured games | 4.29 | 4.43 |
AppFollow clients | 4.36 | 3.99 |
Two things to notice. First, the App Store global average is actually higher than Google Play (3.75 vs. 3.44). Second, AppFollow clients run higher on Google Play than the App Store — 4.36 vs. 3.99 — because the App Store is structurally a harder environment.
The harder-environment story shows up in three signals. App Store review-to-store-rating gaps are wider (+0.64 vs. +0.52 on Google Play, meaning recent reviews skew more critical relative to cumulative score).
App Store sentiment scores run dramatically lower (46.4 vs. 65.5 — a 19-point platform gap). And App Store featured games sit at 4.43 store rating but only 2.95 review rating, meaning recent users are writing reviews 1.48 stars below the cumulative number.
Key takeaway: Stop comparing your App Store and Google Play ratings against each other. The platforms are measuring different audiences with different review-writing cultures. Build separate baselines and separate dashboards.
The AI reply speed advantage — 12x faster, same coverage
Manual replies in the 2026 dataset average 299.3 hours. That’s 12.5 days. By the time a manual reply lands, the user who left the review has uninstalled, moved on, or forgotten the issue.
AI-powered replies through AppFollow average 24.8 hours. Roughly one day. The user is still inside the engagement window where they might update their review.
Twelve times faster. Same coverage. The difference between a reply that lands while the player still cares and a reply that lands as an archival note for future readers.
Definition: Reply effect
The change in a review’s star rating measured after a developer response, attributable to the response itself. AppFollow measures it at review level and reports a +0.42 reply effect for apps that reply to any reviews versus apps that reply to none.
The 12x speed difference is the operational mechanism behind the +0.42 reply effect. The faster a reply lands, the higher the probability the review gets updated upward.
The featured-games cautionary tale — high ratings, declining reviews
The 100 featured games each platform promoted in 2025 carry an average store rating of 4.34. Impressive on paper.
Look at their current review ratings and the picture changes. App Store featured games average a 2.95 review rating against a 4.43 store rating. That’s a 1.48-star gap, meaning current users are writing reviews dramatically below the cumulative number.
Only 66% of featured games reply to reviews at all. 17% reply to more than half. The average reply rate among featured games is 17.4% — lower than the global average of 24.8%.
The lesson: featuring is not a substitute for review operations. Getting featured pulls installs in the short term. Ignoring reviews while featured pulls the rating down quietly. By the time the store rating catches up to current reviews, the featuring window is closed.
Where the rating uplift actually comes from — middle-of-distribution reviews
Most studios reply to 1-star reviews (damage control) and 5-star reviews (the easy thank-yous). The 2, 3, and 4-star reviews get neglected. This is the most fixable mistake in the 2026 dataset.
The bottom 10% of apps by rating distribute their replies as follows: 48.4% go to 5-star reviews, 28.1% to 1-star, and the entire middle (2/3/4-star) splits 7-8% each. That pattern is reactive — say thank you to happy users, fight fires with angry ones, ignore everything in between.
AppFollow clients show the opposite pattern by star rating. Reply rates: 69.4% on 1-star, 73.8% on 2-star (the highest), 70.9% on 3-star, 67.8% on 4-star, 63.7% on 5-star. The middle gets covered.
Why does 2-star get the highest coverage? Because 2-star reviewers are unhappy but not furious. They are the most convertible audience if a developer can address the specific complaint. Cover them and a meaningful share update to 4 or 5 stars within the engagement window.
Key takeaway: The 2–4 star reviews are the most under-replied and the most convertible cohort. Shift your reply prioritization toward this middle band and the rating-uplift math gets meaningfully more favorable.
Negative 5-stars and positive 3-stars — the texture under the star count
Star ratings and sentiment scores diverge more often than headline metrics suggest. A 5-star written as a feature request is functionally a complaint. A 3-star that opens with "love it" is functionally a positive.
AppFollow clients in the top 10% of store ratings average a sentiment score of 65.9. The bottom 10% average 62.5. A modest gap on average. The bigger story is what sentiment-by-feature-tag exposes — the specific parts of a game pulling sentiment down, two to three weeks before the headline rating starts to slide.
For studios building rating-forecast models, sentiment-by-feature-tag is the highest-information signal in the public review dataset. Star ratings tell you what already happened. Sentiment tells you what is about to happen.
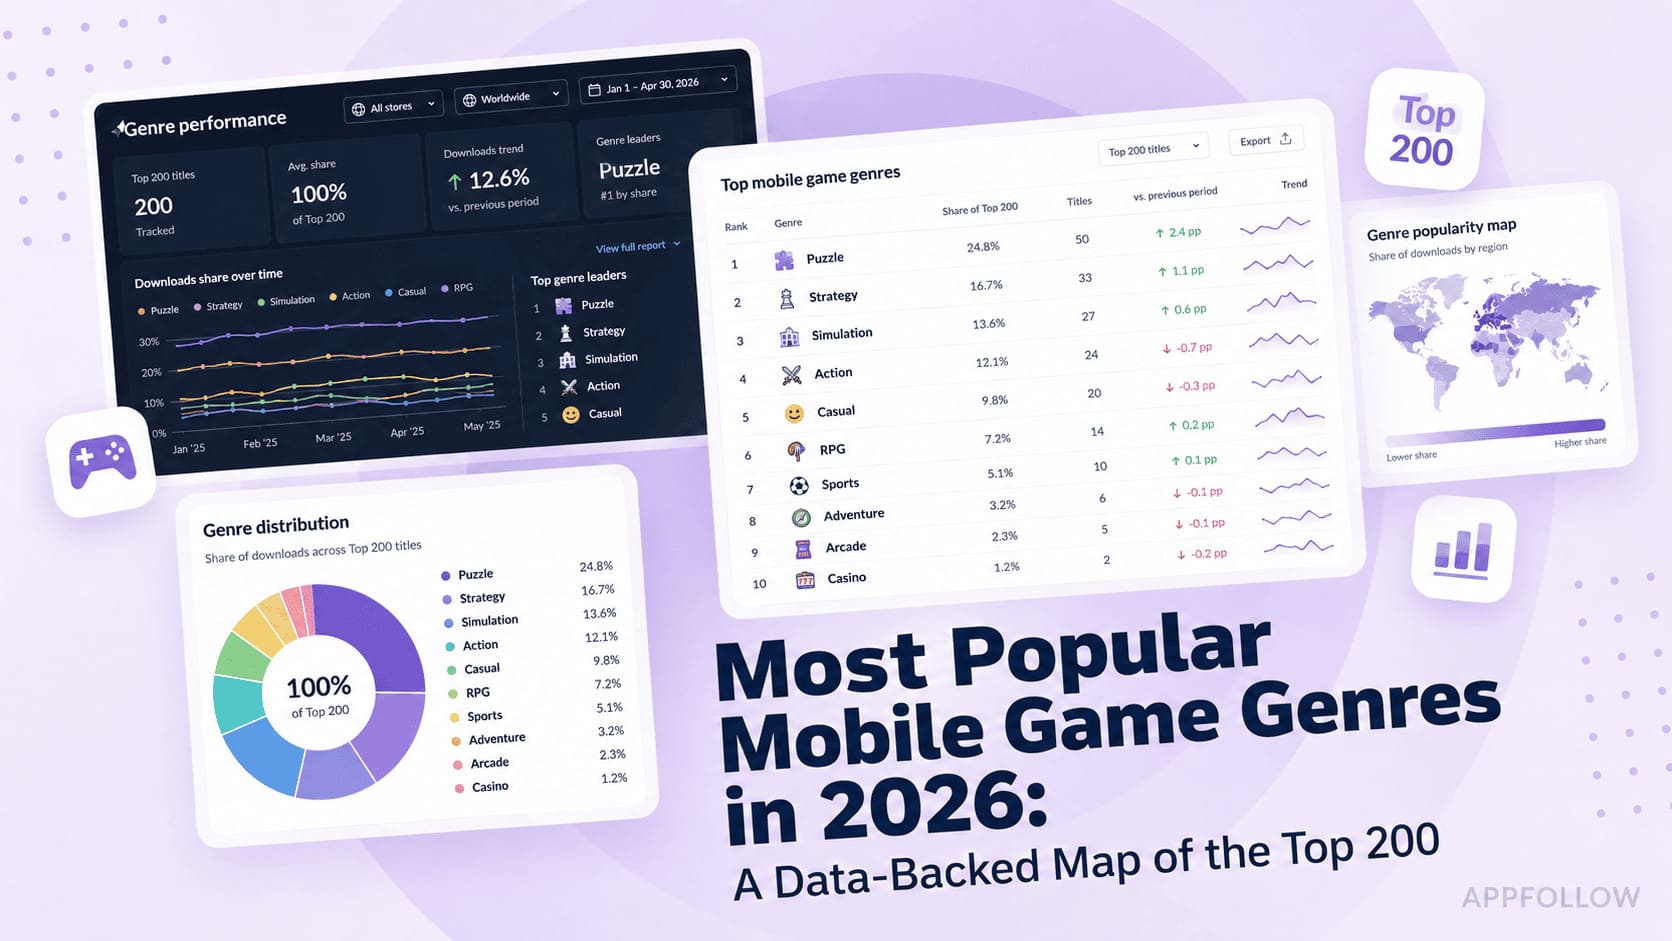
More insights from our repost is in Most Popular Mobile Game Genres in 2026: A Data-Backed Map of the Top 200