AppFollow vs. DIY: AI review analysis and why summaries break past 1,000 reviews

You paste 1,000 app reviews into an LLM on Friday afternoon to get ready for Monday's roadmap meeting. Back comes a tidy list: billing complaints first, then confusing onboarding, then a handful of crashes. It looks ready for a slide.
Nobody counted anything, though. Maybe your prompt held only the longest comments. Maybe ten angry paragraphs about a double charge took more of the context window than 200 one-line crash reports.
So you have a well-written list with a priority order nobody can back with a number. We'll cover the sampling math behind that order, a topic-first workflow with real counts, and the upkeep a consistent workflow needs month after month.
Can AI reliably summarize 1,000 app reviews?
Yes, an LLM can summarize 1,000 reviews, and the summary will usually read well. Whether it represents all 1,000 is a separate question. The answer depends on which reviews went into your prompt, how each topic got counted, and whether a category means the same thing next month. The 1,000 figure is an example workload, with no technical meaning for any model. We show the sampling math and a topic-first workflow first, then compare DIY with AppFollow.
What breaks when you paste 1,000 reviews into an LLM?
The trouble starts before the model writes a word. You (or your script) decide which reviews go into the prompt and how the results get combined, and the final summary shows none of those choices.
The context window is a token budget
Say each review averages 150 tokens. A thousand of them come to 150,000 tokens of review text, before IDs, dates, ratings, your instructions and room for the output. At 300 tokens per review, you're at 300,000. Both are arithmetic scenarios (we didn't measure review length, and neither number is a documented limit for any model).
When the total won't fit the model or your budget, the pipeline trims something. It might cut long reviews, drop older ones, strip metadata or squash whole batches into pre-summaries. If that happens quietly, the summary describes whatever survived the cut, and you still assume it covers all 1,000.
The Lost in the Middle study (TACL 2024) found that models used information at the start and end of a long context better than information in the middle. Its tests were question-answering and retrieval tasks. On Context Utilization in Summarization with Large Language Models (ACL 2024) tested 6 LLMs on 10 datasets for the same effect in summarization. Neither study measured app reviews, so don't borrow their error rates for your 1-star pile.
Paraphrase quality and priority order are separate tests
A review summary can pass or fail five separate checks:
- Each sentence matches the content of some reviews.
- The model saw every review in scope.
- Those reviews resemble the full population.
- Each topic's relative size comes from a count.
- This month's topic definitions match last month's.
A fluent summary can pass the first check and fail the other four. Those four depend on your input and your counting.
"Many users are angry about billing" is a qualitative claim. "Half of users complained about billing" is a number. A number needs a count, a stated denominator and a matching population (and a share of reviews says nothing direct about a share of users).
Intensity and prevalence are separate measures too. A 400-word 1-star rant about a double charge takes about as much of the context window as sixteen 25-word crash reports. In a count it's one review, and nothing in a raw-text prompt tells the model to weigh it as one.
Does a bigger context window fix it?
It fixes truncation, mostly. Filter bias, wrong denominators, duplicates, shifting category definitions and invented percentages are all still possible. Position effects depend on the model and the task, and newer models may handle long inputs better. Neither paper sets any review-count threshold.
The sampling trap: how 5% of complaints become the main issue
Pick reviews by length and you skew the topic mix whenever some topics produce longer reviews than others. Billing disputes are a plausible case, since people describe the charge, the date, the support ticket and the missing refund.
A constructed 1,000-review example
Take a made-up subscription app with 1,000 text reviews in one quarter:
- 50 reviews are billing and payment complaints (5%), and all of them are long.
- 200 reviews are login and access complaints (20%), mostly one or two lines each.
- The other 750 reviews (75%) are praise, feature requests, UX gripes and crash reports.
Now your DIY script keeps the 100 longest reviews to save tokens. In this constructed set, all 50 billing reviews make the cut. The other 50 slots go to long reviews from the "other" group, and every login complaint is too short for the list.
Illustrative synthetic dataset: no customer data and no AppFollow performance data.
Metric (synthetic data) | Full corpus, 1,000 reviews | 100 longest reviews |
|---|---|---|
Billing reviews | 50 | 50 |
Login reviews | 200 | 0 |
Denominator | 1,000 | 100 |
Billing share | 5% | 50% |
Login share | 20% | 0% |
Interpretation | Billing is a minor topic, and login is a major one | Billing looks like the main issue, and login looks absent |
Billing goes from 50 ÷ 1,000 = 5% to 50 ÷ 100 = 50%, a tenfold jump in apparent prevalence. Login drops to zero. The model didn't invent a single complaint. We handed it a biased sample and asked it for customer priorities. Both numbers are shares of reviews in a defined set, which is a different measure from the share of customers or downloads with the problem.
Random sampling and rare incidents
Random sampling removes the length bias, and it's the more defensible way to estimate prevalence from a subset. Rare issues are its weak spot. Say 10 of the 1,000 reviews describe a serious data-loss bug in one OS version (1%). You draw 100 reviews at random, without replacement. Here's the chance that none of the 10 land in your sample:
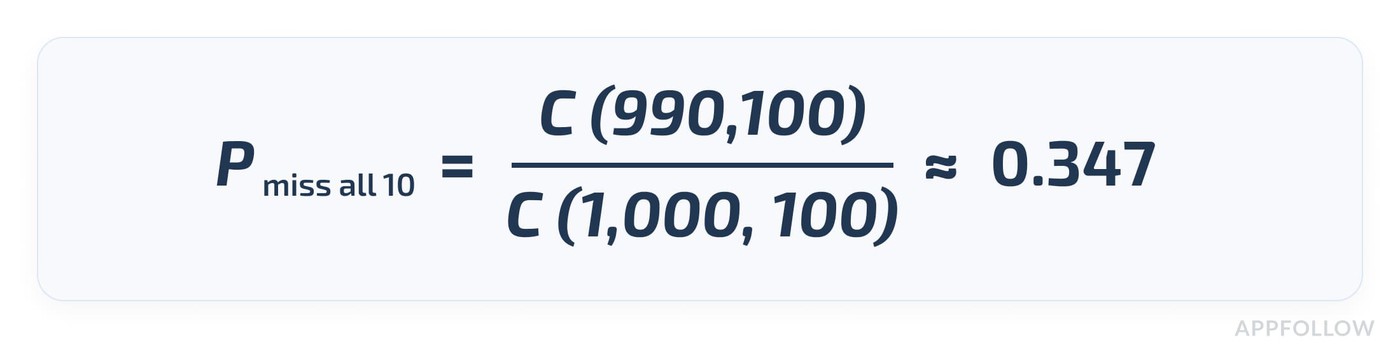
That's about one draw in three with zero rare reports, even though you'd expect one on average. A sample of 200 still misses all ten about 10.6% of the time, and a sample of 300 about 2.8% of the time. These are textbook probabilities for drawing without replacement (statisticians call it the hypergeometric distribution), with no model involved, so they aren't an AI error rate. Use samples to read the general mood of a period, and run a check over every review for high-severity patterns.
Recency, rating, language and version filters change the answer too
Length is one filter among several, and your summary inherits every one of them:
- The 100 newest reviews after a release describe that release and say little about the quarter.
- Filtering to 1-star reviews helps you find pain points, and it removes the denominator for any prevalence estimate.
- English-only input leaves out localized issues, like a broken payment method in Brazil.
- A crash tied to version 4.2 can disappear into the average when the set also includes six months of older versions.
Write the population down before you prompt anything: which app, which store (or both), what dates, which versions, which markets, and whether you include star-only ratings with no text.
Does chunking 1,000 reviews into smaller summaries fix it?
Partly. Chunking handles context size, and the ACL 2024 study tested hierarchical and incremental summarization as ways to reduce position bias. The counts survive only if you carry them through each step.
A common DIY pattern goes like this: split the reviews into chunks, summarize each chunk, then ask the model to summarize the summaries. It can break in five ways:
- If each chunk summary is about the same length, a 50-review chunk and a 450-review chunk get equal weight in the final pass.
- One long complaint can fill more summary text than dozens of brief mentions of something else.
- A first-stage summary can drop a topic that appears twice in its chunk, and the final stage never sees it.
- The final stage can write percentages from prose that has no counts in it.
- Chunks can name the same issue differently ("can't sign in" in one, "account locked" in another), and the merge may treat them as two problems.
Here's an illustrative case with made-up numbers. Chunk A has 50 reviews, and 20 of them mention billing (40%). Chunk B has 450 reviews, and 45 mention billing (10%). Say each chunk summary calls billing notable, and someone averages the two rates to get 25%. The real figure across both chunks:
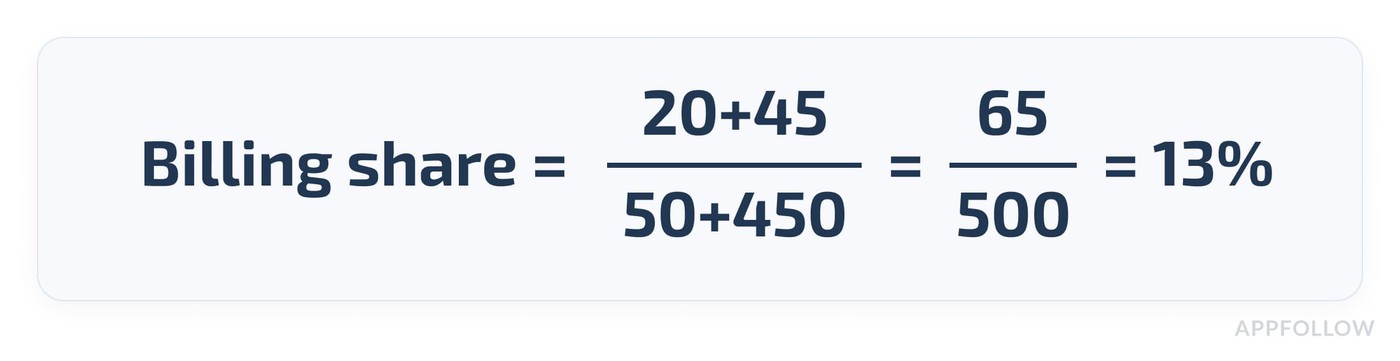
You get to 13% only if each chunk passes along its count and its denominator. Two paragraphs of prose can't give you that number. So at every stage, keep review IDs, per-topic counts, the total number of reviews and the number of excluded or unclassified reviews. Let the model write after the numbers are final.
Hierarchical summarization is a useful building block for long inputs. Pair it with counting, coverage tracking and stable labels.
The better workflow: classify every review first, then summarize each topic
Measure first: label every review, count each topic against a stated denominator, and hand the counts to the model for the write-up.
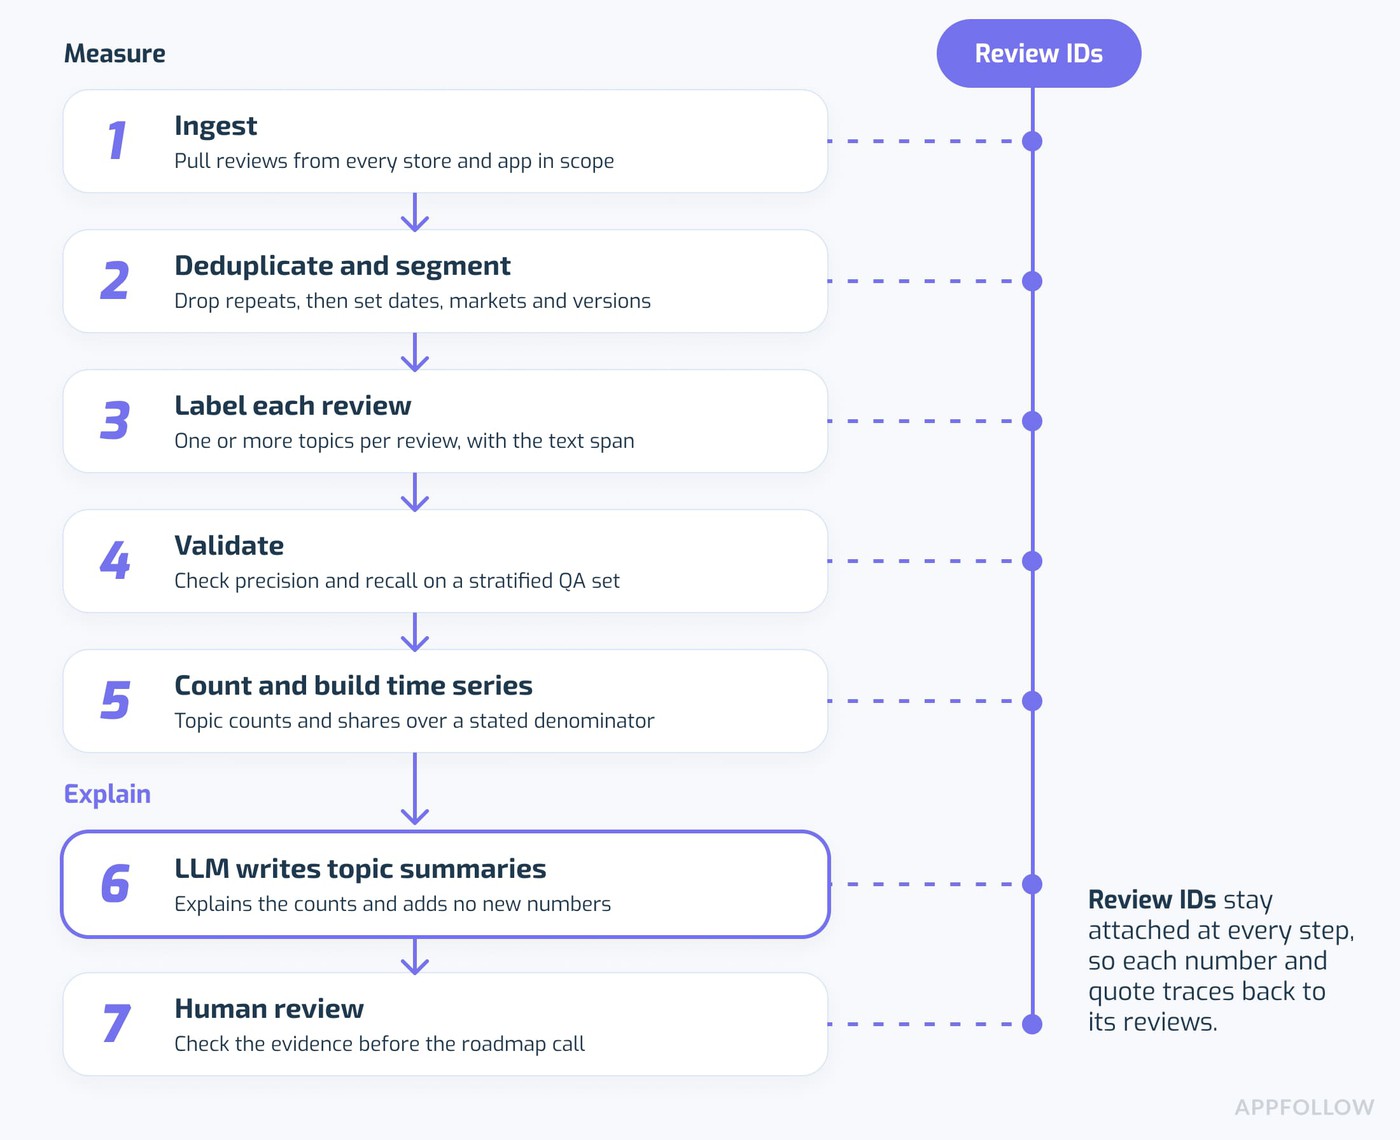
This is a reference design. It comes from research on aspect-based opinion summarization, such as the decomposed approach from Li, Lau, Hovy and Lapata (Findings of ACL 2025). Their method splits the job into three stages: find the aspects, consolidate opinions per aspect, then write the final synthesis. What follows is our recommended practice, and it describes no AppFollow internal pipeline.
Step 1: define and clean the review population
Set the boundaries first: app, store, dates, countries, versions and languages. For each record, keep a stable review ID, the rating, platform, country and version where you have them, the text, the last-updated timestamp and the ingestion time.
Then clean up edited reviews, double imports, deleted entries and untranslated text. Count each review once (track edits as separate events only if you label them that way). Log every exclusion. Keep text reviews apart from star-only ratings, since the two have different denominators.
Step 2: label every eligible review
Start with a small, stable taxonomy. For our made-up app it could look like this:
- Login and account access covers sign-in, OTP codes and password resets.
- Crashes and performance covers crashes, freezes and slow screens.
- Billing and subscriptions covers charges, renewals and refunds.
- UX and navigation covers confusing flows and hard-to-find settings.
- Feature requests covers asks for new or changed features.
- Support experience covers contact with the support team.
- Positive feedback covers praise.
- Other or unclassified holds the rest, so you can see its size.
These labels are generic and unrelated to AppFollow's tag names.
Let one review carry several topics, and store the text span that justified each label, so a teammate can check it later. Take this invented review:
Love the redesign, but I can't log in since 4.2 and my subscription was charged twice.
It gets three labels: design (positive), login (negative) and billing (negative). A single "mixed" bucket would hide two separate problems, which defeats the purpose if your question is topic prevalence.
Step 3: count with explicit denominators
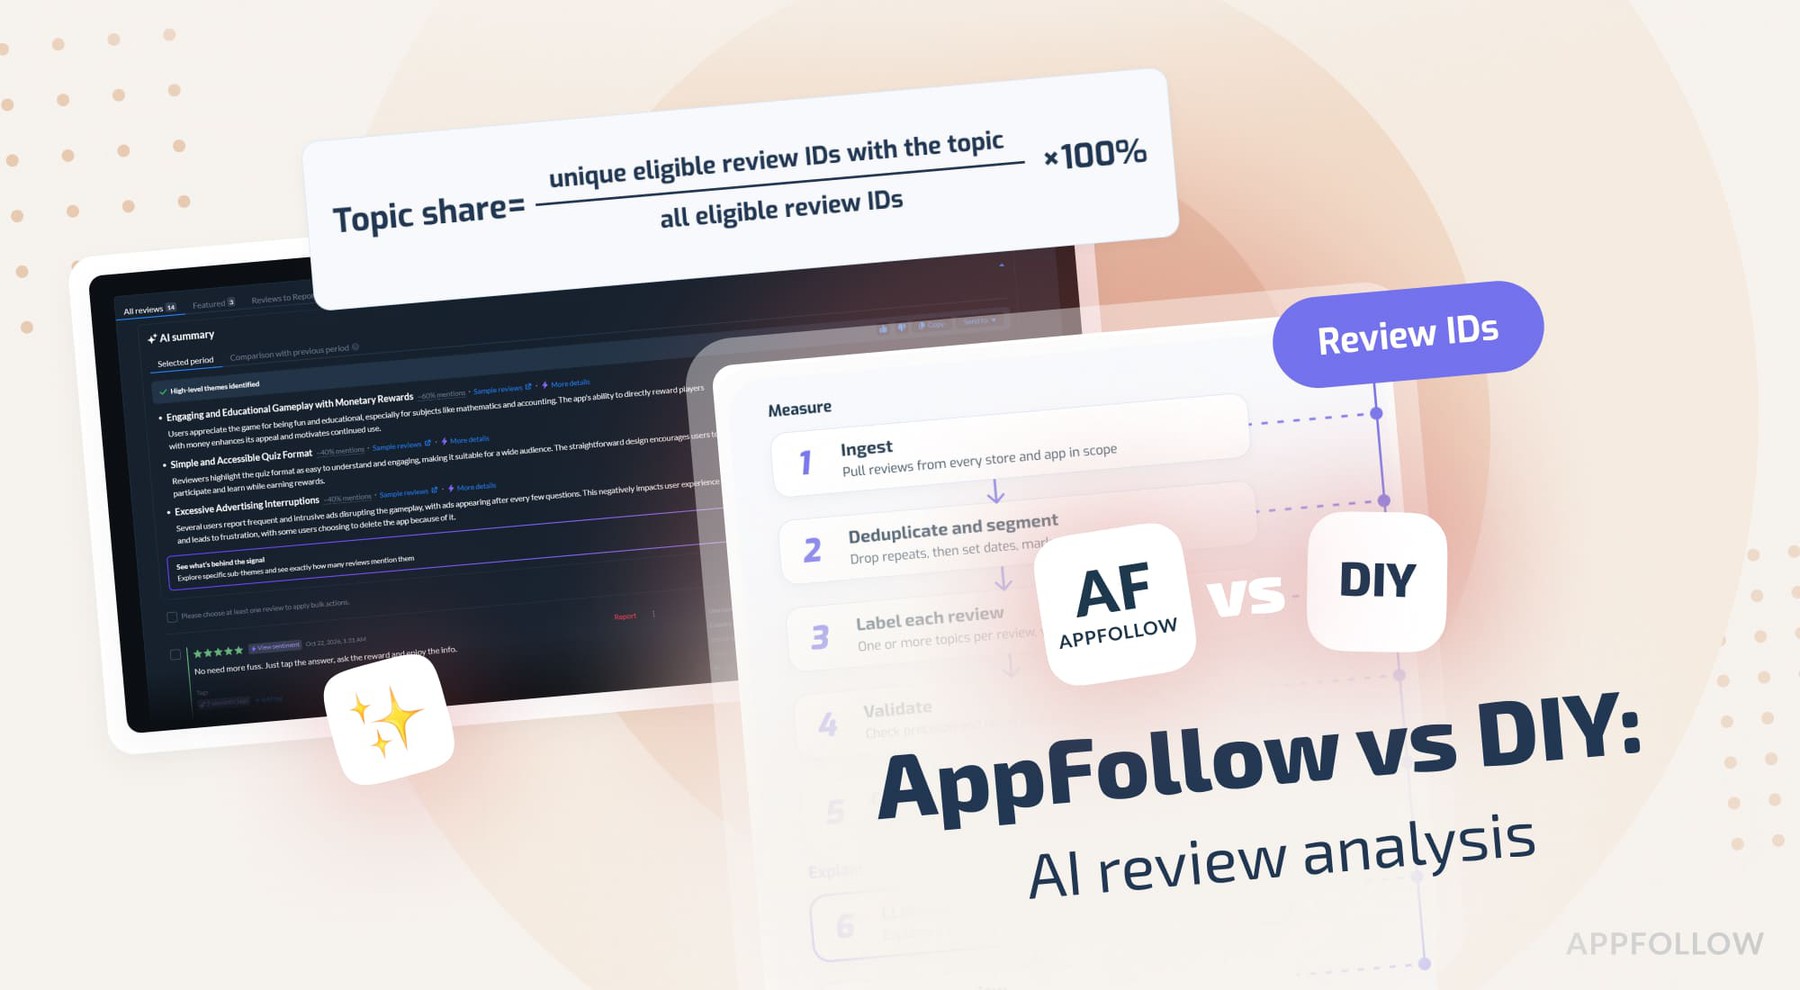
For each topic, use this formula:
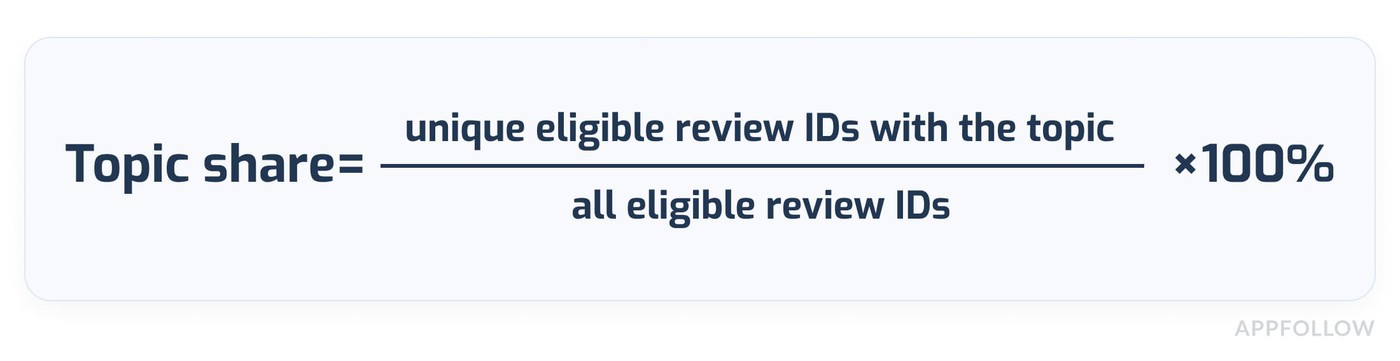
Deduplicate by review ID before you compute any totals. With multi-label data, topic shares can add up to more than 100%. An unclassified bucket can push the total under 100%. AppFollow's AI Summary documentation says the same about its own topic percentages. Overlap can push the total above 100%, and reviews the AI leaves out (nonsense or irrelevant ones) can bring it below.
Here's a worked example with synthetic numbers. Say you have 1,000 eligible reviews. Of those, 180 mention login, 120 mention billing and 70 mention both. Login share is 18% and billing share is 12%. Here's the share of reviews with either problem:
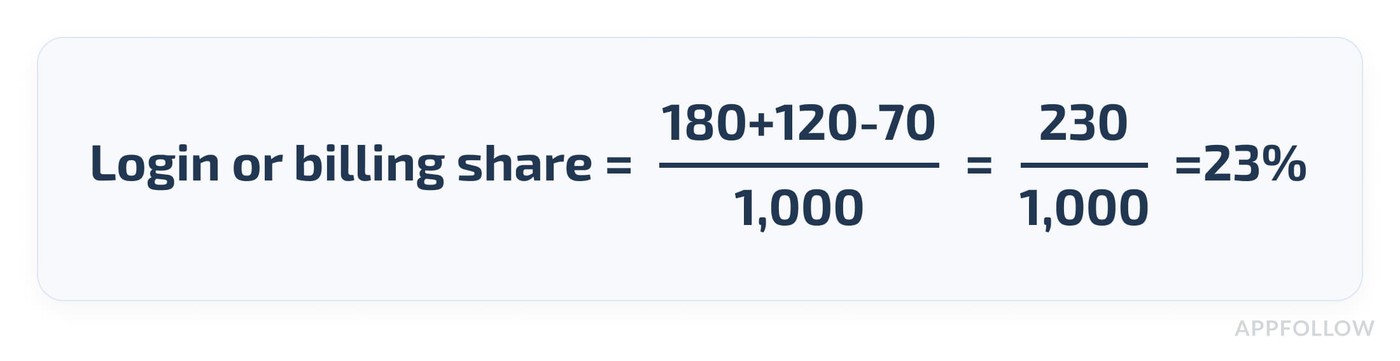
Add 18% and 12% and you get 30%, which overcounts by 70 reviews. You counted the reviews that mention both topics twice.
Step 4: give the model counts for the write-up
Pass the LLM structured aggregates: count, share, change versus the previous period, splits by segment, and a handful of review IDs with example text. For each issue, ask it for five things:
- Describe the user problem in plain words.
- Give the count and share with the denominator and date range.
- Say which way the topic moved against the previous comparable period, when you have that history.
- Quote two or three anonymized examples, or link the original reviews where your data agreements allow it.
- Name a likely owner and list what's still uncertain.
Tell it outright that every number, segment split and root cause in the output has to exist in the input data. If the aggregates don't say why login broke, the summary shouldn't guess at a reason.
One related result comes from the REFER paper (NewSum workshop, 2025). Its authors found that prompts framed in frequencies, in the style of "X out of Y," made LLM opinion summaries fairer. In their terms, a fair summary represents the range of opinions in the source. The effect was strongest in larger models.
Step 5: validate before anyone reprioritizes work
Pull a stratified QA set of, say, 150 to 250 reviews. Spread it on purpose across ratings, languages, review lengths, versions, countries and the rare critical themes. (That size is our suggestion for a pilot. It's no industry standard and promises no particular statistical precision.)
Check precision per topic: of the reviews tagged billing, how many are about billing? Check recall per topic too: of the reviews about billing, how many got the tag? Score rare, high-severity topics separately, because a good overall average can hide a classifier that misses every data-loss report. Before anything goes to leadership, compare totals with your baseline review counts, click through the evidence links, and look for trend shifts with no support in the data.
How do you know the AI found the right issues?
Run three separate tests on the output: coverage, classification and grounding.
Coverage is the share of eligible records your system read and labeled, with failures and exclusions logged next to it. For classification, measure precision and recall per topic and per language on your QA set. Grounding means every number and quoted example in the summary matches a real record, and the summary mentions every high-severity issue from the period.
Here's a scorecard you can start from. It's an engineering checklist, with no AppFollow benchmarks and no guaranteed AppFollow metrics in it:
Metric | What to check |
|---|---|
Source coverage | Eligible review records versus records ingested and processed |
Topic precision | Correct labels among assigned labels, in a human-reviewed sample |
Topic recall | Issues the system found among the ones human reviewers labeled |
Duplicate rate | Unique review IDs after edit and import normalization |
Unsupported numeric claims | Shares or counts in the output with no matching aggregate |
Critical-issue miss rate | High-severity cases in the QA sample that the system missed |
Taxonomy version | A version ID for the label set, plus the mapping rule from the previous version |
Don't put scores on it until you've run a controlled test. After that, rerun it after every model, prompt or taxonomy change. Each change can move precision and recall with no visible sign in the summary text.
Taxonomy drift: why month-over-month topic trends stop being comparable
A trend line compares one number across time, so it works only if the topic definition stayed the same between points.
If "login" turns into "authentication," what happened to complaints?
Here's an illustrative case. In September your team's prompt files "login," "OTP" and "password reset" under Account Access. In October someone updates the prompt. OTP moves to Security, and password reset moves to Onboarding.
The numbers below are synthetic, with no AppFollow performance data in them.
Month | Label rule version | Account Access reviews (synthetic) | Interpretation |
|---|---|---|---|
September | v1 | 120 | Baseline |
October | v2 | 65 | Not comparable with September until v2 is mapped back to v1 |
Account Access fell from 120 to 65 reviews. Every one of those 55 could be a relabeling artifact, with user behavior identical in both months.
Keep a taxonomy version and a crosswalk
Treat the label set like code:
- Write a definition for every topic, with include and exclude examples.
- Give each taxonomy release a version number.
- Store review IDs, the original text and the labeling rationale where it's practical.
- Reprocess older data with the new version when you can, and add a note on the chart wherever reprocessing isn't possible.
- Keep the reporting denominator stable.
- Slice by language, market and app version, so a change in source mix doesn't pass for a change in user experience.
Say login issue share drops from 12% to 7% after a fix ships. Then you notice that reviews from Brazil, where the login bug was worst, fell to half their usual share of the dataset. Before anyone claims the fix worked, check the share market by market.
Why a rising topic count can come with a falling share
Normalize before you call a trend. A release that doubles review volume can double a topic's count with zero change in the topic's share. Some synthetic numbers: last week had 100 login reviews out of 1,000, a 10% share. This week has 160 out of 2,000, an 8% share.
The count rose 60%, and the share fell 2 percentage points. More reviews mentioned login this week, and those reviews made up a smaller share of the total. Report both numbers, by country, and skip the one-line headline.
Period comparisons in any tool follow the same rule, including AppFollow's AI Summary Comparison. A comparison shows what changed in the feedback. It can't prove why, and it can't confirm that your categories stayed identical.
What a production DIY review analysis system needs besides an LLM prompt
The prompt is the smallest of about nine pieces in a production version:
- Ingest reviews from every store, with deduplication and handling for edited and deleted reviews.
- Version a topic taxonomy with written definitions.
- Run a multi-label classifier with an evaluation harness for model and prompt changes, plus a human review path for low-confidence labels.
- Store per-review labels with timestamps and provenance.
- Compute counts and denominators by period, country, rating and app version.
- Handle personal data through minimization, access control, retention rules and redaction of exported examples.
- QA rare incidents, language coverage, false positives and unsupported claims in summaries.
- Build reporting and alerts, plus a workflow for whoever investigates an alert.
- Monitor sources, data and models for changes, and name an owner for upkeep.
Your engineers can build all of this. The trade-off is capacity and upkeep. Someone on your team keeps ingestion working when store APIs change, re-runs evaluation after every model swap, and answers for the numbers when a priority call goes wrong. Our build vs buy breakdown for review management tools puts numbers on that ownership by team size.
Naive LLM summary vs. topic-first DIY vs. AppFollow: what's the difference?
The three setups differ in how they count and in the team responsible for upkeep. We haven't run an accuracy test across them, so the table compares design and maintenance only.
Dimension | Sample pasted into an LLM | Production topic-first DIY | AppFollow (plan-dependent) |
|---|---|---|---|
Source coverage | Only the reviews you pasted | Whatever your collectors ingest and your eligibility rules allow | Reviews from the apps and stores you track |
Topic labeling | Ad hoc, set by the prompt | Explicit multi-label classification per review | Manual tags, auto-tags, sentiment and semantic tags, by plan and add-ons |
Topic prevalence | Percentages the model may invent | Computed from labeled records | Tag counts and shares over time in Tags Analysis, plus Semantic Analysis on supported plans |
Sampling control | Manual and usually undocumented | Yours to design, with QA | Filters on the review set, such as date, country, language, rating and version |
Period comparison | Depends on the prompt each time | Needs a versioned taxonomy and stored history | AI Summary Comparison, with all categories on Team and above |
Evidence drill-down | You build the links | You build the provenance | "Read reviews" on Reviews Analysis opens a summary's source reviews |
Maintenance | Prompt tweaks and manual checks | Your team owns ingestion, taxonomy and QA | AppFollow maintains the platform, and your configuration still matters |
Custom topics | Free-text prompts | Your own taxonomy | AI Summary Custom Topics on Team and above, plus Custom Semantic Tags as a separate premium add-on |
Transparency | You control the prompt, often with little traceability | High, if built well | In-product reports and filters, with access set by user permissions |
A DIY pipeline gives you full control over taxonomy, models and retention rules, and your team staffs every piece of it, from store collectors to comparison views. AppFollow takes over the platform upkeep. Configuration, filters and the final read of the numbers remain your team's job.
None of this says AppFollow processes every review into every summary, or that its models never miss a topic. Check the product the same way you'd check your own pipeline.
How AppFollow handles large review volumes, plan by plan
AppFollow collects your reviews, applies your tags plus plan-dependent semantic tags, and writes AI summaries over whatever set you filter to. On Reviews Analysis, a summary links back to its source reviews.
Start with AI Summary and open the source reviews
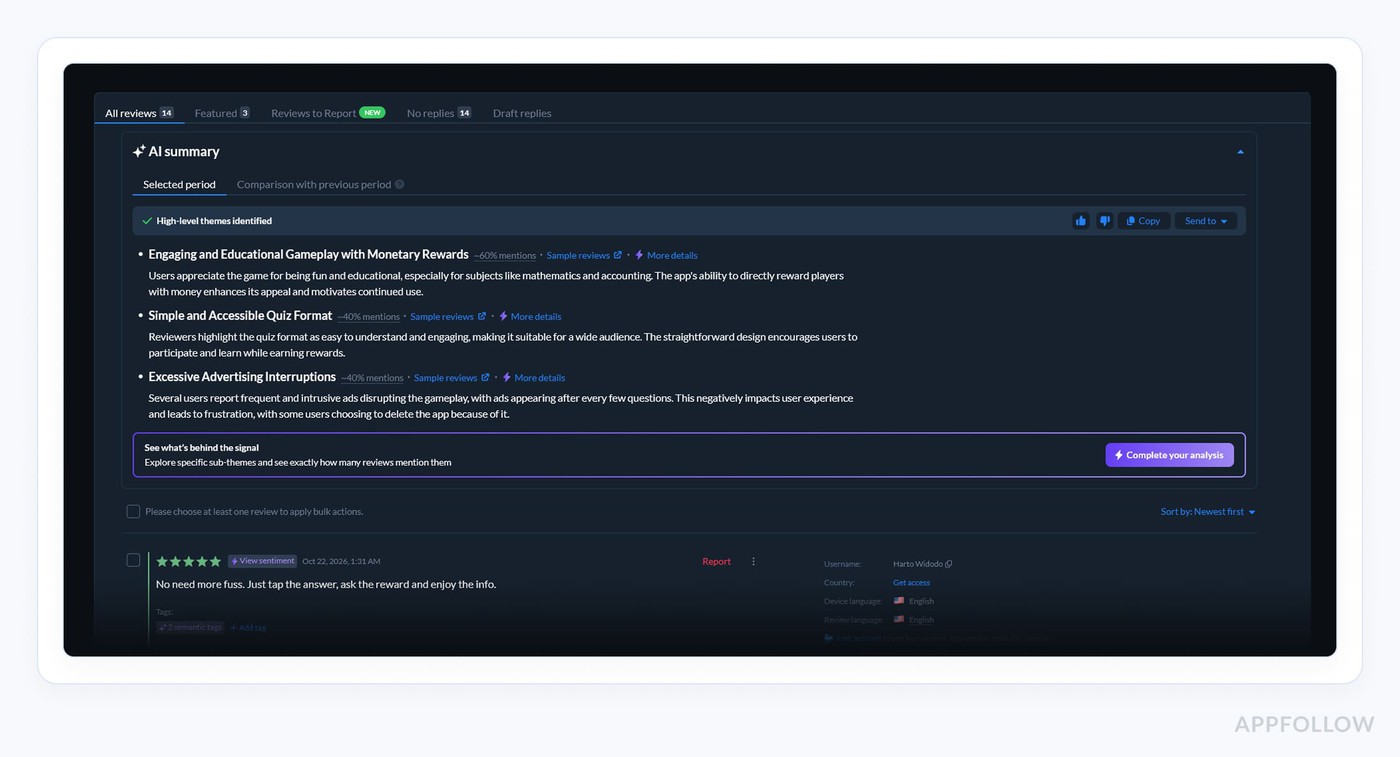
AI Summary appears in the Reviews Feed and on the Reviews Analysis page. It updates when you change filters or presets, so the summary describes the subset on your screen.
On Reviews Analysis, a "Sample reviews" link opens the exact feedback the summary used in the Reviews Feed, so you can check a theme against its sources before it goes into a deck.
Use tags and semantic analysis for a repeatable view
For counts you can report every month, use tags. You set the definitions for manual tags and auto-tags, and Tags Analysis charts them over time.
Semantic tags are AppFollow's machine-learning labels in four categories: bugs, monetization, user feedback and report a concern. Access depends on plan, per the Semantic Tags help article and the add-on list:
- On Essential, you see review sentiment in the Reviews Feed.
- On Team, you get review sentiment plus semantic tags. The full Semantic Analysis page is a paid add-on for Team, listed as AI semantic review analysis. You can request a trial from the page itself.
- Enterprise includes the full Semantic Analysis page, with KPIs, semantic charts, demographic breakdowns and sentiment over time.
- Custom Semantic Tags, trained on your own reviews for topics like "delivery delays," are a premium add-on for Team and Enterprise that you request through your account manager or support.
Custom Topics in AI Summary are a separate feature. On Team and above, you type a short topic phrase (15 to 20 characters, like "checkout issues") and get a summary focused on that topic.
Compare periods with AI Summary Comparison
AI Summary Comparison puts two date ranges side by side. You'll find it on Home Hub and in the Compare tab of the Reviews Feed AI Summary. It writes up what changed across ongoing issues, positive feedback and suggestions. Free and Essential get one category (Ongoing Issues). Team and above get all categories.
Here's a workflow we'd use before a planning meeting:
- Filter to one app, one language and the release window.
- Check the rating and tag breakdown in Reviews Analysis.
- Read the AI Summary for that subset.
- Open the source reviews for the top themes.
- Compare with the previous period where your plan includes the comparison.
- Send the verified findings to engineering or support.
Run the analysis in your own AI assistant through MCP
If your team already works in Claude, ChatGPT, Codex or Cursor, the AppFollow MCP server gives your assistant live access to your AppFollow data, scoped to your permissions. An Owner or Admin connects it. Setup calls are free, data reads and AI analysis spend API credits, and the tools you get depend on your plan.
The open-source AppFollow AI Toolkit adds a /feedback-analysis workflow for reviews, ratings, sentiment trends, top bugs and feature requests. It tracks its own coverage, which is this article's argument in miniature. In its default deep mode, it reads up to 10 pages of 100 reviews for an app and compares that with the window's total review count. If it got less than 60% of the total, it marks text-based findings as "indicative only." When semantic tools aren't on your plan, your assistant classifies the review text itself.cta_get_started_purple
Should you build review analysis yourself, use AppFollow, or combine both?
The answer depends on review volume, how much you need reproducible counts, the infrastructure you already have and the sensitivity of the data.
Start with volume. With a few dozen reviews, read them all yourself. Once you need prevalence numbers that hold up in a planning meeting, you need labels and counts, and the open question becomes the team that maintains them.
Scenario | Starting approach | Why |
|---|---|---|
One-off summary of 30 reviews | General-purpose LLM plus a manual check against the source | You can read the whole input yourself |
Hundreds or thousands of reviews, and you need issue prevalence | Topic-first counting with validation | Prose summaries give no reliable proportions |
In-house ML or data platform and a taxonomy unique to your product | DIY or hybrid | You already own the infrastructure, and your definitions are a competitive asset |
Regular monitoring of several apps in several languages | Evaluate AppFollow plans and add-ons | Maintained ingestion, filters, summaries and reporting |
Natural-language analysis inside Claude or Codex | AppFollow MCP plus AI Toolkit, if your plan's tools and credits cover it | Your AI workflow stays, with governed data access |
Regulatory or security requirements a vendor can't document | DIY, after a requirements review | You need compliance and retention controls you can show an auditor |
A tool won't make the priority call for you, whichever one you pick, and a DIY pipeline with good QA is a fair choice.
Final verdict: write the summary last
Back to Monday's roadmap meeting. Before anyone acts on that summary, someone has to answer four questions: which reviews went in, what counted as a billing complaint, how the frequency got calculated, and whether last month's taxonomy matches this month's.
- Use a general-purpose LLM for small sets you can read end to end, and for exploratory reading.
- Build a topic-first pipeline when your categories are a strategic asset and you can staff the upkeep.
- Use AppFollow's AI review analysis or MCP when you want a maintained starting point, within your plan's limits.
So write the summary last. First pick the reviews you're analyzing, label them consistently, count each issue and keep the evidence. After that, an AI summary can do the job it's good at: putting the numbers into plain words. If you want that groundwork maintained for you, start an AppFollow trial and run AI Summary on your own reviews.
FAQs
Can ChatGPT summarize 1,000 app reviews accurately?
It can write a readable summary of 1,000 reviews. For accuracy you need three things: every eligible review in the input, topics counted against a stated denominator, and a person who checked the result. A thousand reviews is no model limit, and our constructed example shows a length-based sample turning a 5% topic into 50%.
Why does AI miss recurring complaints in app reviews?
Two different failures look alike. Either the complaint never reached the model (truncated input, a biased filter, a sample that skipped it), or it was in the input and got lost to position effects, sparse mentions or inconsistent labels. Check coverage first, since it's a simple count.
How do I avoid sampling bias when summarizing app reviews?
Define the population first: app, store, dates, versions, markets, and text reviews only or ratings too. For prevalence, label and count the full eligible set where feasible. Use random or stratified samples for qualitative reading and QA, and never extrapolate from the longest reviews.
What is topic-first review summarization?
It's a workflow where every review gets one or more topic labels from a stable taxonomy, and each topic gets counted against a stated denominator. Then an LLM explains the counted patterns, with linked example reviews. The five-step workflow in this article covers cleaning, labeling, counting, writing and QA.
How should I calculate the percentage of reviews mentioning an issue?
Divide the unique eligible reviews that carry the topic by all unique eligible reviews in the period, then multiply by 100. One review can carry several topics, so shares across topics can total more than 100%. To combine two topics, subtract the reviews that mention both.
Does AppFollow offer topic-level AI review analysis?
Yes, depending on plan. AI Summary works on your current filtered view, and on Reviews Analysis it links to its source reviews. Semantic tags come with Team. The full Semantic Analysis page comes with Enterprise or as a paid add-on for Team, and Custom Semantic Tags are a premium add-on. Check your workspace's entitlements.