30 Mobile App Analytics Metrics You Can’t Ignore (Part 3)


Table of Content:
In this final part of our ultimate list of 30 mobile app analytics metrics. Here you’ll find 10 metrics tailored to these real-world use cases:
- Scaling visibility over time
- Crisis management & recovery
- App update impact analysis
Each section maps the right metrics to the right decisions, so you can spot shifts early, react fast, and prove what worked.
What metrics to track when you want to scale visibility over time
Scaling visibility is a long game, and the teams that win are the ones tracking mobile app metrics analytics that age well. Not just installs or just stars. I’m talking app analytics metrics tied to real engagement, sustainable retention, and keeping customer acquisition costs from blowing up your next budget review.
In this section, we’ll unpack the visibility metrics that scale with you, month after month, so you can boost traction without burning cost, and build momentum that sticks.
Long-Term Keyword Position History
Long-Term Keyword Position History tracks how your app ranks for specific keywords over time, by platform, country, and keyword type. It’s a running record of your visibility momentum, showing whether you’re gaining ground or quietly slipping away.
Unlike snapshot rankings, this view reveals the real story behind your app’s growth curve. It tells you if your ASO is sticking, which keywords are truly contributing to user discovery, and where competitors may be edging you out when no one’s watching.
And when you align this data with session metrics and marketing campaign, you see what’s moving the needle, long-term.
That wellness team had been tracking keywords like “habit tracker,” “mood journal,” and “daily reflection.” Their ASO dashboard looked decent, no major drops. But when we pulled up historical ranking data, one thing stood out: their top-converting keyword, “habit builder,” had been slowly sliding, from #7 to #29 over just six weeks.
That drop aligned exactly with a slowdown in new sessions and a dip in engagement from organic installs. A competitor had launched a similar feature and optimized for the same keyword. The team hadn’t noticed.
Once we identified the slip, they rewrote the subtitle, added new screenshots reflecting the keyword’s value, and pushed a localized preview. Within three weeks, the ranking bounced back to #10. Installs in Canada jumped 21%.
The revenue impact: steady lift, tied directly to visibility recovery.
To track this in AppFollow, head to ASO → Keyword Tracking
Here’s a simplified example:
Keywords history. Test it live with a 10-days trial.
That visual progression helps you spot erosion before it hits your KPIs, especially session-to-install drop-offs.
Say you’re tracking 20 keywords. Last month, you had 15 in the Top 10. This month? Only 10 remain.
(10 ÷ 20) × 100 = 50% visibility retention
That 25% drop could mean fewer top-funnel impressions, fewer qualified users, and eventually, a dent in revenue if not addressed early.
Best practices:
- Check at least twice a month, and always after metadata changes, campaigns, or seasonality shifts.
- Benchmark: Maintain Top 10 rankings for at least 60% of your core keywords.
- If a keyword drops ≥5 positions over 30 days, check competitor metadata, update creatives, or test store listing copy targeting that term.
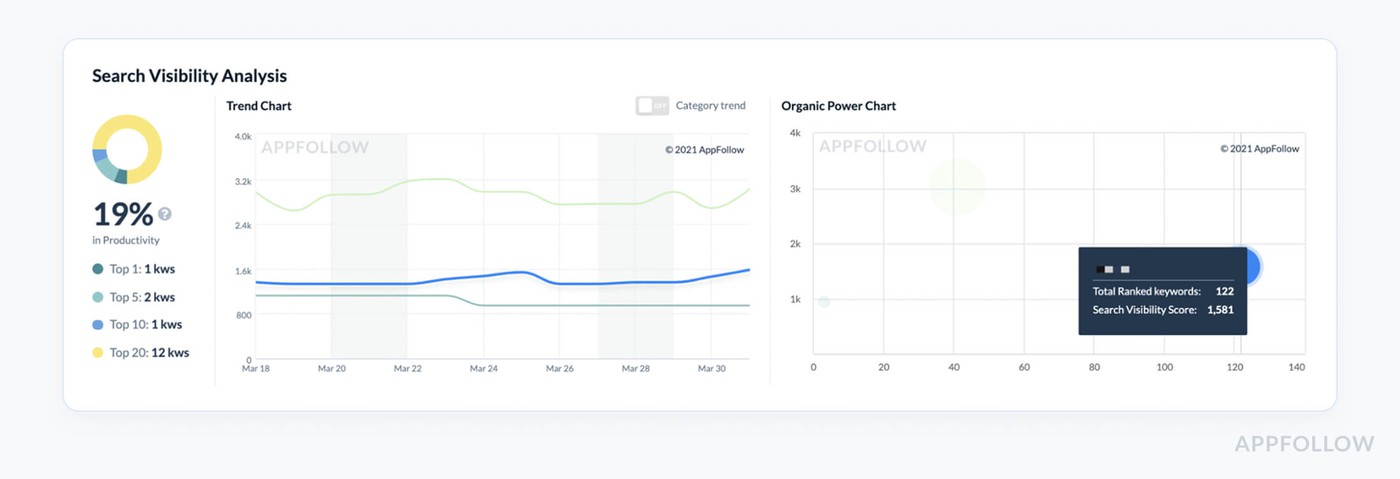
Search Visibility & KEI Trends
Search Visibility is the pulse of how visible your mobile app is across all tracked keywords. It shows how frequently you appear in top search results, weighted by position. It doesn’t just tell you where you rank, it tells you how discoverable you are overall.
Now pair that with KEI Trends, Keyword Effectiveness Index, and you’ve got a double-shot of insight. KEI measures how powerful a keyword is by blending popularity and competition.
So when visibility is climbing and your KEI is improving, that’s when you know you’re scaling with the right terms, and not just chasing high-volume ghosts that never convert.
I had this moment with a mental health app team who were laser-focused on boosting downloads in English-speaking markets. They were adding keywords like “anxiety,” “stress relief,” “self-care” to their metadata. Big volume, yes. High conversions, not really.
When we pulled up their Search Visibility score, it was flat, hovering around 23%. But then we looked at their KEI Trends, and guess what, the keywords they were targeting had brutal difficulty scores and low effectiveness.
We re-centered their keyword strategy using KEI filters. They replaced “anxiety” with long-tail queries like “daily anxiety check-in” and “calm breathing coach”, terms with lower competition but high intent.
Visibility rose from 23% to 38% in 30 days. Installs increased 17%. And more importantly, users arriving from those keywords stayed longer. Retention metrics lifted across the board.
To find it in AppFollow go to ASO → Keyword Analytics → Visibility & KEI Tabs
Here’s a simplified peek at the dashboard:
Test it live with a 10-days trial.
That third row? That’s the moment you know your keyword mix is starting to pay off.
Let’s say one of your new keywords has:
- Popularity: 60
- Difficulty: 10
Your KEI = (60² ÷ 10) = 360
Now let’s say another keyword is:
- Popularity: 90
- Difficulty: 80
Your KEI = (90² ÷ 80) = 101.25
That’s the trap most teams fall into, they chase the second one because it looks bigger. But KEI shows which one will work harder for your app.
Best practices:
- Check Search Visibility weekly, especially after metadata updates or keyword swaps.
- Benchmark: Aim to grow visibility by 3–5% per month for healthy momentum.
- If KEI drops but keyword traffic looks stable, reassess your keyword list, something more competitive may be creeping in unnoticed.
Metrics to track during crisis management & recovery
When the numbers start slipping? Most teams freeze. They panic-scroll dashboards. They guess. They hope. But when you’ve lived through enough flops and fire drills, you stop guessing, and start looking at signals that mean something.
The right mobile marketing metrics don’t lie. They whisper before the drop turns into a crash. They flag problems before your CAC spikes or your customer retention falls through the floor.
This section is your cheat sheet for crisis-mode clarity. The app metrics I reach for when installs stall, engagement tanks, or the paid budget gets torched with zero lift. Pulled from the trenches of real app marketing analytics, under real pressure.
Sentiment spike alerts
Okay, imagine that it's a normal Tuesday morning. You open Slack, look over the normal product updates, and then someone sends that one message that no one wants to read: "Hey... Has anyone looked at the reviews in a while?
One of my clients had the exact problem: their mobile utility app had just gotten a little upgrade to its permissions. Nothing special. They didn't even say anything about it in the changelog. But in Canada, their average rating decreased from 4.4 to 3.6 in less than 24 hours. And no one noticed until people on Twitter started yelling at them about power drain and background tracking.
The results, sessions went down, visibility went down, and installs began to slow down. That's when I told the team, "Okay, we're never doing this without seeing it again." We set up Sentiment Spike Alerts in AppFollow, and to be honest, it transformed how they handled every release after that.
What are Sentiment Spike Alerts, anyway?
Think of them as the emotional smoke detector for your app store. These alerts go off when users' feelings about your app change suddenly, whether they adore it or are angry with it.
The alert is your first clue that something has changed in the user experience, whether it's five-star love or one-star wrath. And what if you're not paying attention to that change? It can slowly destroy your income, session quality, and long-term visibility.
You can get really specific using AppFollow. You may define different limits for each nation, platform, and even keyword tags like "bug," "login," or "crash." In short, you can see what makes your users the most upset.
In that real-life situation, the product team was ready for a flawless feature drop. Marketing was keeping an eye on the progress of the sessions. But no one thought the feature would generate a trust issue because people weren't told what changed.
Why this number is more important than most:
To be honest, the dip in ratings is just the beginning. When people don't like your store, it gets less visibility. That moves you down the charts. Organic installs go down. Teams in charge of marketing are in a hurry. Your nicely crafted funnel is leaking quickly.
And here's the thing: it always starts with one review. One user who is upset, puzzled, or betrayed enough to speak up. That's the time you want to capture. Sentiment Spike Alerts are made for that.
What to do with the info: During launches, check notifications every day, and at least two or three times a week during regular weeks. Set your trigger to go off when the star rating drops by at least 10% or the number of bad reviews with tags rises by 2x (particularly if they are about problems, features, or changes to the user experience).
If it happens:
← Get data by area → To find the problem, sort reviews by tag. Then, right immediately, sync with support and the product to fix the problem and talk to users quickly. How to set up AppFollow to automatically send Sentiment Spike Alerts
This is how I set this up for clients who want peace of mind without having to check things by hand:
Sentiment Spike can be found under Review Alerts.
Set limits for each store, keyword tag, and area (for example, "battery" in Canada and "login" in the US)
Send alerts immediately to Slack or email; no one needs to open another tab.
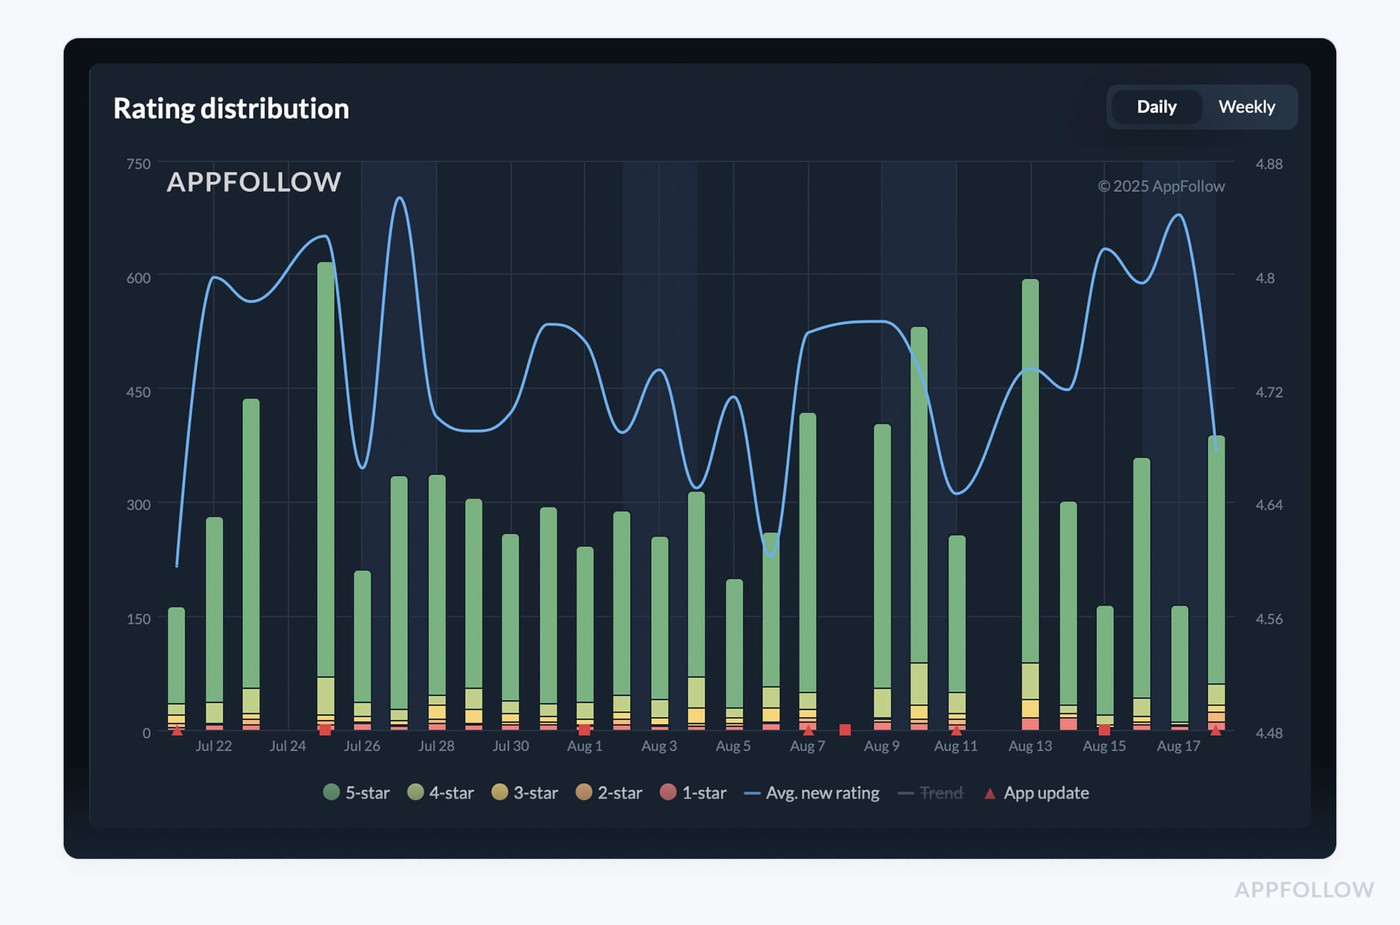
Rating Distribution Shifts
Rating Distribution Shifts track the proportion of each star rating, 1 through 5, over time. So instead of only looking at your average rating (which, let’s be real, hides a lot), you see how the actual breakdown of stars is moving day by day, version by version.
It’s the difference between “our rating is still 4.2” and “we just got 80 new 1-star reviews this week but a handful of 5-stars are hiding the damage.”
This metric helps you spot early churn signals, UX issues, or onboarding misalignment before they tank your visibility, shake trust with users, or block your next app store feature placement.
To find it in AppFollow go to Reviews → Rating Analysis
Test it live with a 10-days trial
Watch that last column. That’s your early warning system, especially when launching new flows or experimenting with features that alter user expectations.
How often to check:
- Daily during launch week
- Weekly as part of your QA/ASO sync
What to watch for:
- A spike of 1- or 2-star reviews ≥ +5% within 3–5 days
- A drop in 5-star share >10% after a release or campaign
If that happens?
- Filter reviews by tag (“UX,” “confusing,” “ads,” “bug”).
- Tie the shift to a specific app version.
- Coordinate hotfixes and adjust messaging in-store or in-product.
Average reply time
Your team just shipped a long-awaited update to your mobile app, new onboarding flow, faster checkout, squashed a few long-standing bugs. You finally exhale. Feels like a win.
Then a one-star review hits.
Then ten.
All saying some version of: “This update broke everything. No response from support.”
Now, that’s not just noise. That’s a signal. And how fast does your team reply? That’s the difference between a temporary glitch and a full-blown trust crisis.
This is where Average reply time becomes your crisis control bestie, and if you ask me, every app team should be tracking it as religiously as they check downloads.
This metric tracks the time it takes your team to respond to user reviews, from the moment a review is posted to when your reply hits the store. It’s measured in hours or days, depending on your setup, and gives you real insight into how reactive (or not) your customer feedback loop is.
In the middle of a messy rollout, this is your first responder metric. It doesn’t just reflect support, it signals to the App Store algorithm that you’re active, attentive, and engaged with users. That matters for discoverability. And for revenue.
AppFollow calculates it like the average reply time for the period.
You can filter it by app version, rating, tags (like “bug” or “payment”), and territory. It’s especially powerful when layered with review volume trends and star rating shifts.
To track it in AppFollow head to: Reviews → Agent performance
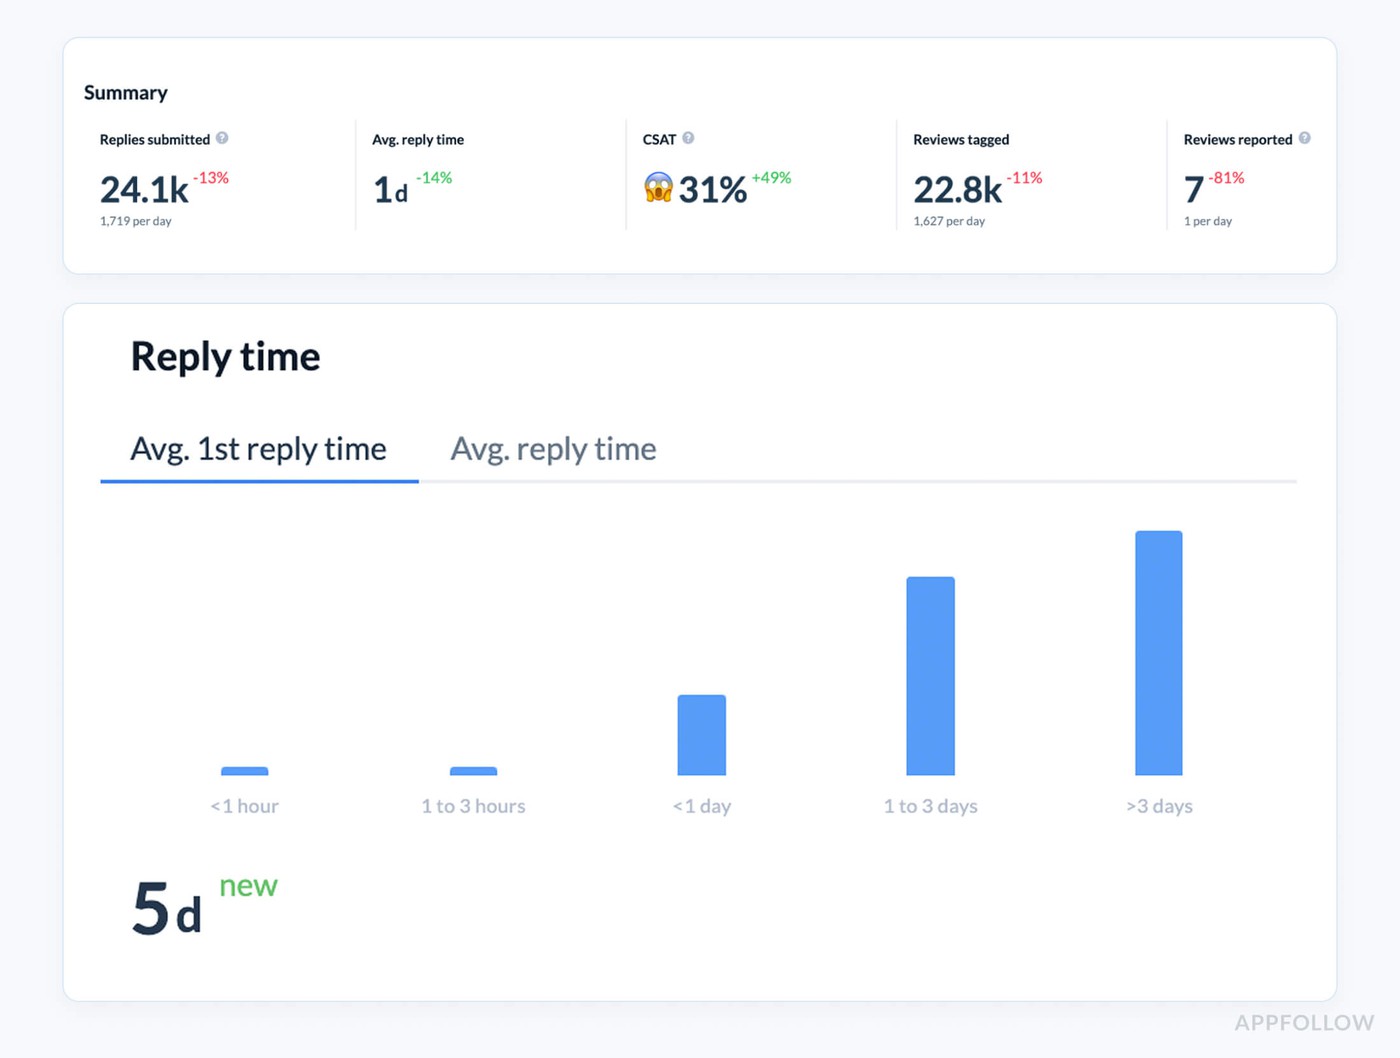
Reply time dashboards. Test it live with a 10-days trial
How often to check:
- Daily during launches, weekly for ongoing health
- Use version filtering to catch new bugs fast
Benchmark to aim for:
- <12h average on 1–2-star reviews
- <24h average across all reviews
- <10% unreplied for any critical tag (“crash,” “login,” “payment”)
If your average spikes:
- Reassign review volume to a wider agent pool.
- Use auto-tagging to route review themes to the right team.
- Prioritize replies to recent reviews (they influence the store listing most).
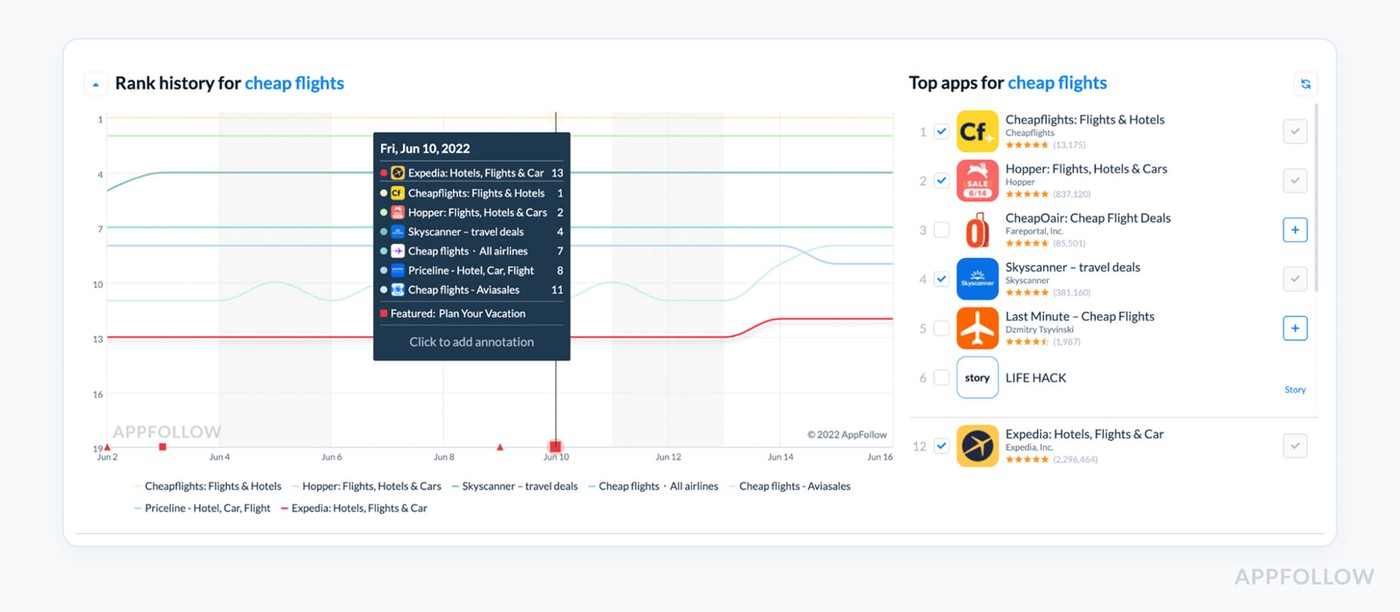
Category & Chart Rank Deltas
Rank in Category and Chart Deltas show how your app's place in the top charts fluctuates over time, whether it's by category, country, or platform. It doesn't just tell you where you are right now. It tells you how fast you're going up, down, or free-falling, and when it started.
You can measure deltas every day, every week, or in your own range. And believe me, when you're in charge of performance during a crisis or after an upgrade, this measure becomes your radar for problems that haven't yet shown up on your metrics dashboard.
You can cut it up by:
- Type of category (like Health & Fitness or Finance)
- Type of chart (Free, Paid, Grossing)
- Type of device in the country
In AppFollow you can find it in ASO ← Category Rankings
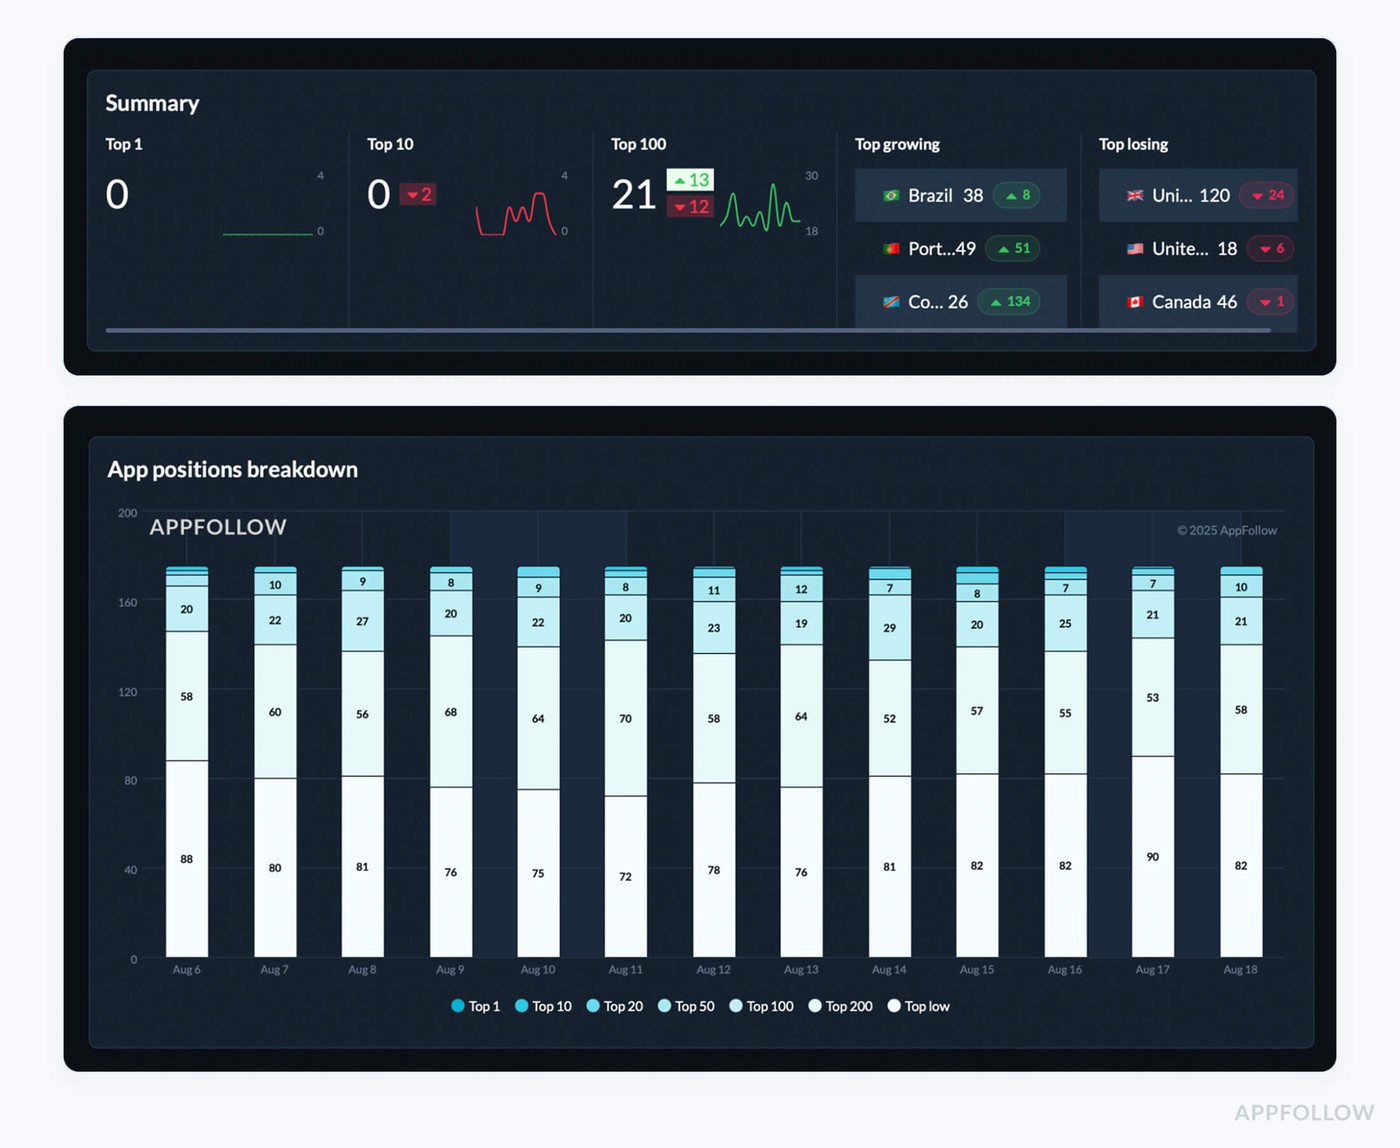
Category racking dashboard. Test it live with a 10-days trial
Not all drips are the same. Some are based on the season, while others are based on user experience. But here's what you should pay attention to:
How often to look: Every day throughout the introduction of new versions, especially in Tier 1 markets. Weekly to keep an eye on health
Benchmarks: A decline of more than 10 positions in 72 hours should raise alarm flags.
Drops in many nations at the same time? Work with product and ASO to coordinate. If this happens:
→ Compare delta with review tags (bugs, crashes, login problems)
→ Look at the history of highlighted placement, did you lose a story or banner slot?
Check to see whether your competitor's rank has changed. Someone may have moved up because of new metadata or a marketing effort.
What metrics to measure during app update impact analysis
Every product update is a gamble. You tweak one thing in your mobile app, and suddenly your session count tanks… or your revenue spikes. Either way, you need to know what changed and why. That’s where mobile app metrics analytics comes in.
In this section, I’m diving into the app metrics that show how your updates land, with users, with your engagement, and with your marketing funnel. No fluff. Just clean, traceable cause and effect. Because guessing is expensive, and product decisions deserve proof.
App Update Timeline Events
Your team sends out a big upgrade for a product. New onboarding screens, a slick new look, and bug fixes that have been bothering you for months. People are high-fiving each other on Slack. But then, at your next growth meeting, the big question comes up:
"So, did it work?" "
At that point, I urge teams to stop guessing and open AppFollow's App Update Timeline Events.
It shows you every single update release, date, version, release notes, and matches those events up against your performance statistics.
It's the best way to go back in time and see how your app is doing. You can go back in time, find out exactly when changes were made, and verify if the update did what your roadmap said it would.
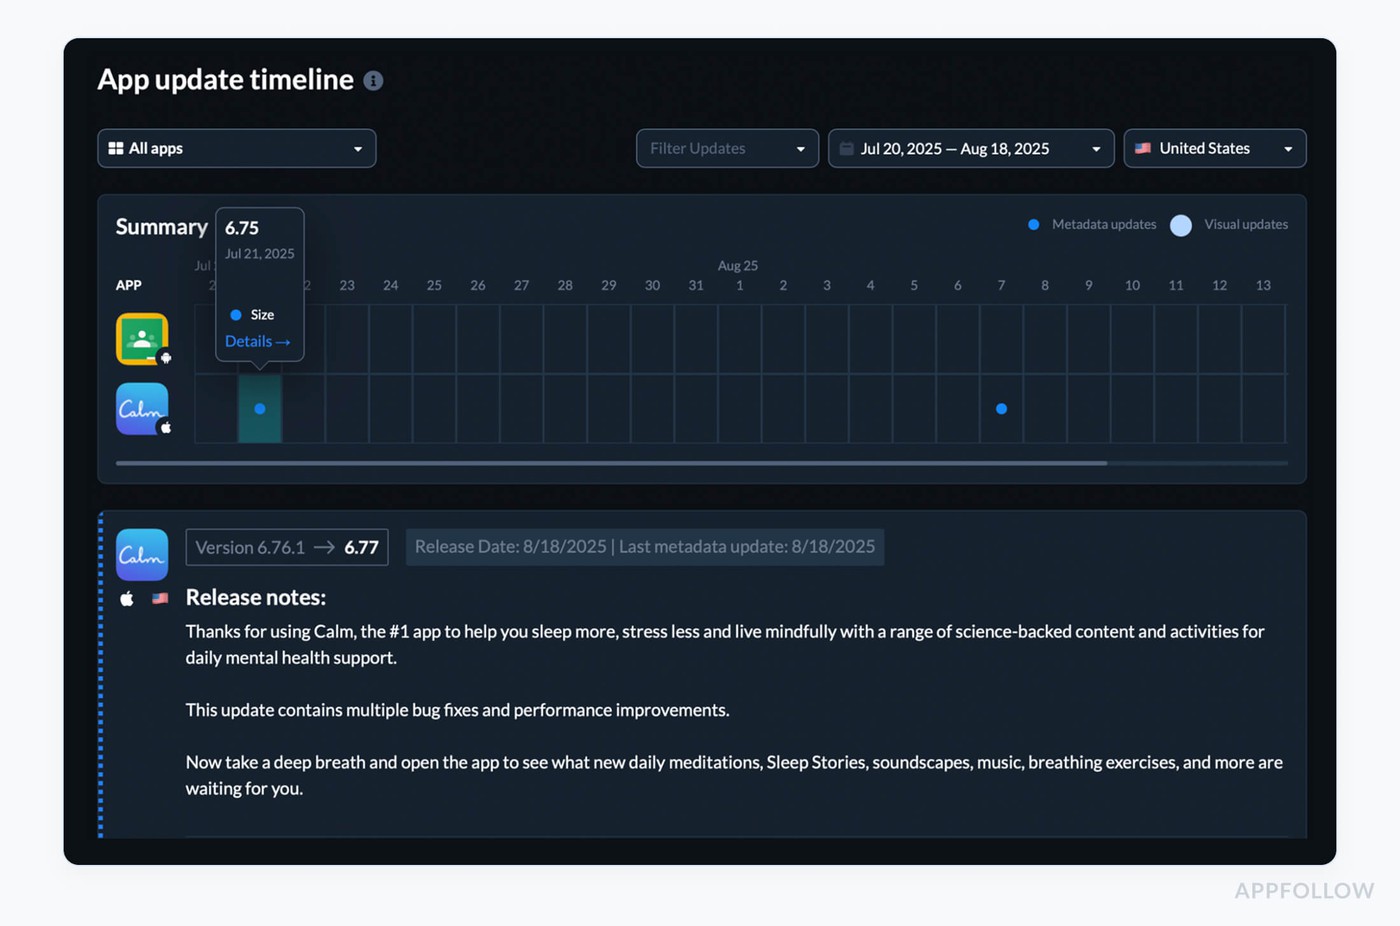
App update timeline dashboard in Appfollow. Test it live with a 10-days trial
From there, you can see a history of updates and their metadata by filtering by app, platform, and country.
Click on any event and overlay rankings, review trends, or category positions. You may see cause and effect in real life there.
What to keep an eye out for:
- Changes in rating after an update happen in 3–7 days (good or bad)
- Changes in category rank in the week after release
- Review sentiment rises connected to new features or bugs
- Download growth or decreases associated with feature launches or removals
Best practices from experts for using the data:
- Always overlay update events on various performance charts. Just looking at ratings can be misleading. Combine them with rankings and download data.
- Tag updates by topic, like "UI overhaul," "feature add," or "performance fix," so you can see which kinds of releases change metrics the most quickly.
- If you notice a bad trend after an update, take action within 7 to 10 days, when the user dialog is still going on. Respond to reviews, release a rapid patch, and change the messaging in your store listing.
- Set a benchmark for how often you issue updates. If you don't release enough, your updates may lose their relevance; if you release too many, your users may get tired of them or leave.
Pre- vs. Post-Update Category & Chart Ranks
This view shows your category and chart positions before a release and then tracks them after go-live, day by day, week by week. You’re not staring at a static rank; you’re watching the delta that belongs to that update.
Questions it answers instantly:
- Did discoverability move up, or stall?
- Did the lift stick, or fade after launch week?
- Which regions or categories dipped and need attention?
When you line these shifts up with installs, review sentiment, and in-app session behavior, the pattern behind visibility, and eventually revenue, comes into focus.
Set one range for the 7–14 days before release, another for the period after. Then filter by category, country, and device.
What to watch for
- Spikes that vanish within a week → curiosity downloads, weak adoption.
- Category-specific drops post-update → UX friction or unmet expectations in a niche segment.
- Country-level mismatches → wins in one market, losses in another from non-localized changes.
Best practices from experts for using the data:
- Always keep track of versions so you can evaluate performance on the same level without additional upgrades getting in the way.
- To find out what's causing movement, look for feature-specific reaction or praise that goes along with rank changes.
- Before adding new features, start a user feedback sprint if post-update ranks drop more than five points in a core category.
- Check your results over a period of 14 to 30 days, not just the first week, to see if the effects last longer than the buzz.
New Keyword Ranking Changes
Picture this: we ship a feature-packed update, reviews look steady, dashboards glow, and the team dives into the next sprint. Then someone asks the question that proves impact: which new searches did we earn because of this release? That’s your cue to open New Keyword Ranking Changes.
This metric tracks the net-new queries your app begins ranking for after a release and how quickly those terms climb. It reveals where the new copy in title/subtitle, localized descriptions, and screenshot captions caught real search intent.
The payoff is clarity: which phrases unlocked fresh visibility, in which countries, on which devices, and whether momentum is building or fading. Consider it evidence that your update speaks the same language as your customer.
Head to ASO → Keywords tracking in AppFollow. Set a window that starts on release day, add a pre-release comparison, and filter by locale to separate true wins from noise.
Now read the pattern, not just the table.
- Speed matters: new terms entering the Top 30 within 7–14 days signal a healthy landing.
- Depth matters: aim for 20–30% of new terms to reach the Top 30 in Tier-1 locales within a month.
- Stability matters: avoid NEW → LOST whiplash across weeks two to four; that hints at weak relevance. And above the fold must carry the promise the query asks for, or page engagement stalls.
From here, act with intent:
- Prioritize momentum. Take the fastest-rising NEW terms and reinforce them in subtitle or short description, then mirror the promise in Screenshot 1 and the preview.
- Localize the winners. When a term cracks Top 20 in one locale, adopt its exact phrasing in that locale’s metadata and captions to lock the gain.
- Make paid work for organic. Spin up a tight Apple Search Ads ad group on the top three NEW terms per locale to amplify lift while controlling cost.
- Protect cohorts. If a newly won term brings installs but weak day-7 retention, keep the term, then tune onboarding copy and first-run UI to deliver the outcome the query implies.
- Close the loop. Share a weekly snapshot with marketing so campaign language, store assets, and creative angles stay aligned with what search is rewarding.
Download Trend Inflection
The moment I always wait for after a release, the bend in the line. You ship, the room exhales, and then we ask: did we change the slope of discovery or did we just make noise? That’s what Download Trend Inflection is for: the point where your download curve meaningfully accelerates or decelerates around a release window, so you can measure the update’s effect rather than the weather.
Think of it as a clean, math-backed answer to “did this move growth?” Among app store metrics, this is the one that shows when momentum shifted. It compares the pre-release trend (the line you were riding) to the post-release trend (the line you earned), and gives you a single signal you can defend in a QBR.
Where it lives in AppFollow: Open ASO → Downloads.
Toggle the release marker (pulls from App Update Timeline), choose a pre window (e.g., -14 to -1 days) and a post window (+1 to +14 days), then enable the slope overlay.
What to watch (benchmarks):
- Magnitude: sustained +15–30% lift in the post window is a healthy win; -10% or worse is a red flag.
- Latency: strong features show a step-up within 3–5 days; heavy UX changes can take 7–10.
- Persistence: gains should hold at least 7 consecutive days; sawtooth patterns hint at paid-only spikes.
- Country split: wins should repeat in priority markets; single-market lifts suggest localization or placement effects.
Pre-release app store download count averaged 2,800/day. Four days after release, the 7-day post window averages 3,650/day. That’s a +30% inflection with a 9-day persistence, green light to expand what worked, country by country.
Deep expert playbook:
- Before you celebrate: sanity-check organic vs paid. If inflection is flat while paid spend climbed, you scaled cost, not momentum. Narrow campaigns to keywords that also rose organically.
- Close the promise loop: when the line bends up, align Screenshot 1 and subtitle to the value that triggered the lift; stronger landing promise boosts page engagement.
- Defend the gain: if the lift fades after day 6, scan review tags for friction and ship a micro-patch; protect week-one retention with first-run tips that match search intent.
- Go surgical by market: replicate the winning metadata in countries that showed a smaller effect; localize phrasing that clearly worked in your anchor locale.
- Tie back to cohorts: if a feature moves the curve but hurts monetization, keep the feature and adjust onboarding; the story you told in search must match what a new customer experiences in minute one.
Discover how to automate your app analytics with AppFollow
AppFollow turns raw store data into decisions, syncing analytics with your release cadence.
Every signal maps to your mobile app lifecycle — submission to rollout.
See how users discover, convert, and complain in near real time. Priority metrics surface automatically.
Track category ranks, keyword visibility shifts, featured placements, country-level download estimates, conversion benchmarks, rating analysis, sentiment auto-tags, reply effect, and competitor discovery. For depth, add ratings velocity, review volume trends, and alert rules so no spike escapes detection.
Everything lands on the Dashboard: drill into granular review tracking, metadata compare grids, and live ASO keyword cohorts with history. Overlay updates with session curves, tie movement to revenue, and share snapshots with marketing for fast pivots.
Try AppFollow free for 10 days across Google, Apple, and Amazon
FAQs
What are the core mobile app analytics metrics I should track?
North Star funnel: Impressions lead to product page views, which lead to CR (installs ÷ views), which lead to D1/D7/D30 retention, which lead to ratings and reviews, which lead to revenue (ARPU/LTV), which lead to uninstalls.
Targets (directional, change by category):
- CR: 3–8% (10% or more is strong)
- Rating: 4.3 to 4.7 "safe" range
- Organic share: 50–70% for long-term health
How do I separate paid lift from organic growth?
Three signals in one view:
- Organic share (Channel Analytics / Organic Dashboard)
- Keyword ranks (if you spend more yet generic ranks don't go up, you're buying volume, not momentum)
- Decay after the campaign (sustained lift = likely organic compounding)
Label the campaign window and compare the baseline, the campaign, and the 7–14 days after.
If organic share goes down as spend goes up, you need to rebalance your keywords toward generic/intent keywords and improve your shop promise before you start scaling.
What’s the quickest way to detect a bad release?
Put these three early-warning measures on top of each other:
- Feelings Spike Alerts (a reduction in rating or a rise in 1★ volume by tag)
- Category/Chart Rank Delta: Red means a decline of more than 10 spots in 72 hours.
- Turnaround time for review responses (more than 12 hours for 1–2★ reviews is dangerous)
Pack of actions: Stop the rollout, respond to the best reviews with a patch or workaround, ship the hotfix, and then align. Screenshot 1 with the promise made clearer in the subtitle.
How do I pick keywords that actually move installs?
Use KEI to rank the intentions that you can win: KEI = Popularity² ÷ Difficulty
Make lists that are specific to each location and KEI leaders.
Check Search Visibility and current rank; protect phrases that are already in the Top 20 and move terms that are in the middle of the pack (20–40) with metadata + Screenshot 1.
Check the new keyword ranking changes following the release and focus on the ones that are going up.
What should be in my weekly ASO report?
Five slides at most:
- Top 30 keywords with the most penetration (+ risers and fallers).
- Search Visibility trend (Week over Week).
- CR by source (search, browse, or purchased) and factors that cause change.
- Changes in the distribution of ratings (by version/locale).
- Actions (tests, hotfixes, localizations), owner, and due date.
Can I estimate downloads by country/keyword — and trust it?
Yes, use Download Estimates based on visibility and ranks.
How to have faith in it:
- Don't look at absolutes for one day; look at trend direction and inflections.
- Check again with the app store territorial dashboards and campaign logs.
- Use confidence by market (Tier-1 is more reliable because it has more data).
Tagging releases and features is a good idea. If estimated lines bend right after a change, you probably located a driver.
How do I connect store wins to in-app outcomes?
Group by: country, app version, and source of acquisition.
If CR goes up but D7 goes down, your page promise is not the same as the first-run experience.
Fix: Change the onboarding text, tooltips, and empty states such that they give the exact result that your most common questions suggest.
How quickly should I see movement when I let go?
Keywords / ranks: 3–5 days
CR (changes to listings): 24 to 72 hours
Stability of the category: 7 to 14 days
Ratings distribution: a relevant read after 7 days
Cadence: checks every day during launch, every week for business as usual, and every month or quarter for trend choices.
Read also
Best Amazon Review Management Software: 10 Tools [Price & Features]
Top 7 AI Tools That Read Customer Reviews for Actionable Feedback
How to spot and report fake reviews on Google & App Store
Understanding App Ratings: Why It Matters for App Success
App Ratings Impact and ASO: 5 Reasons High Ratings Impact Success