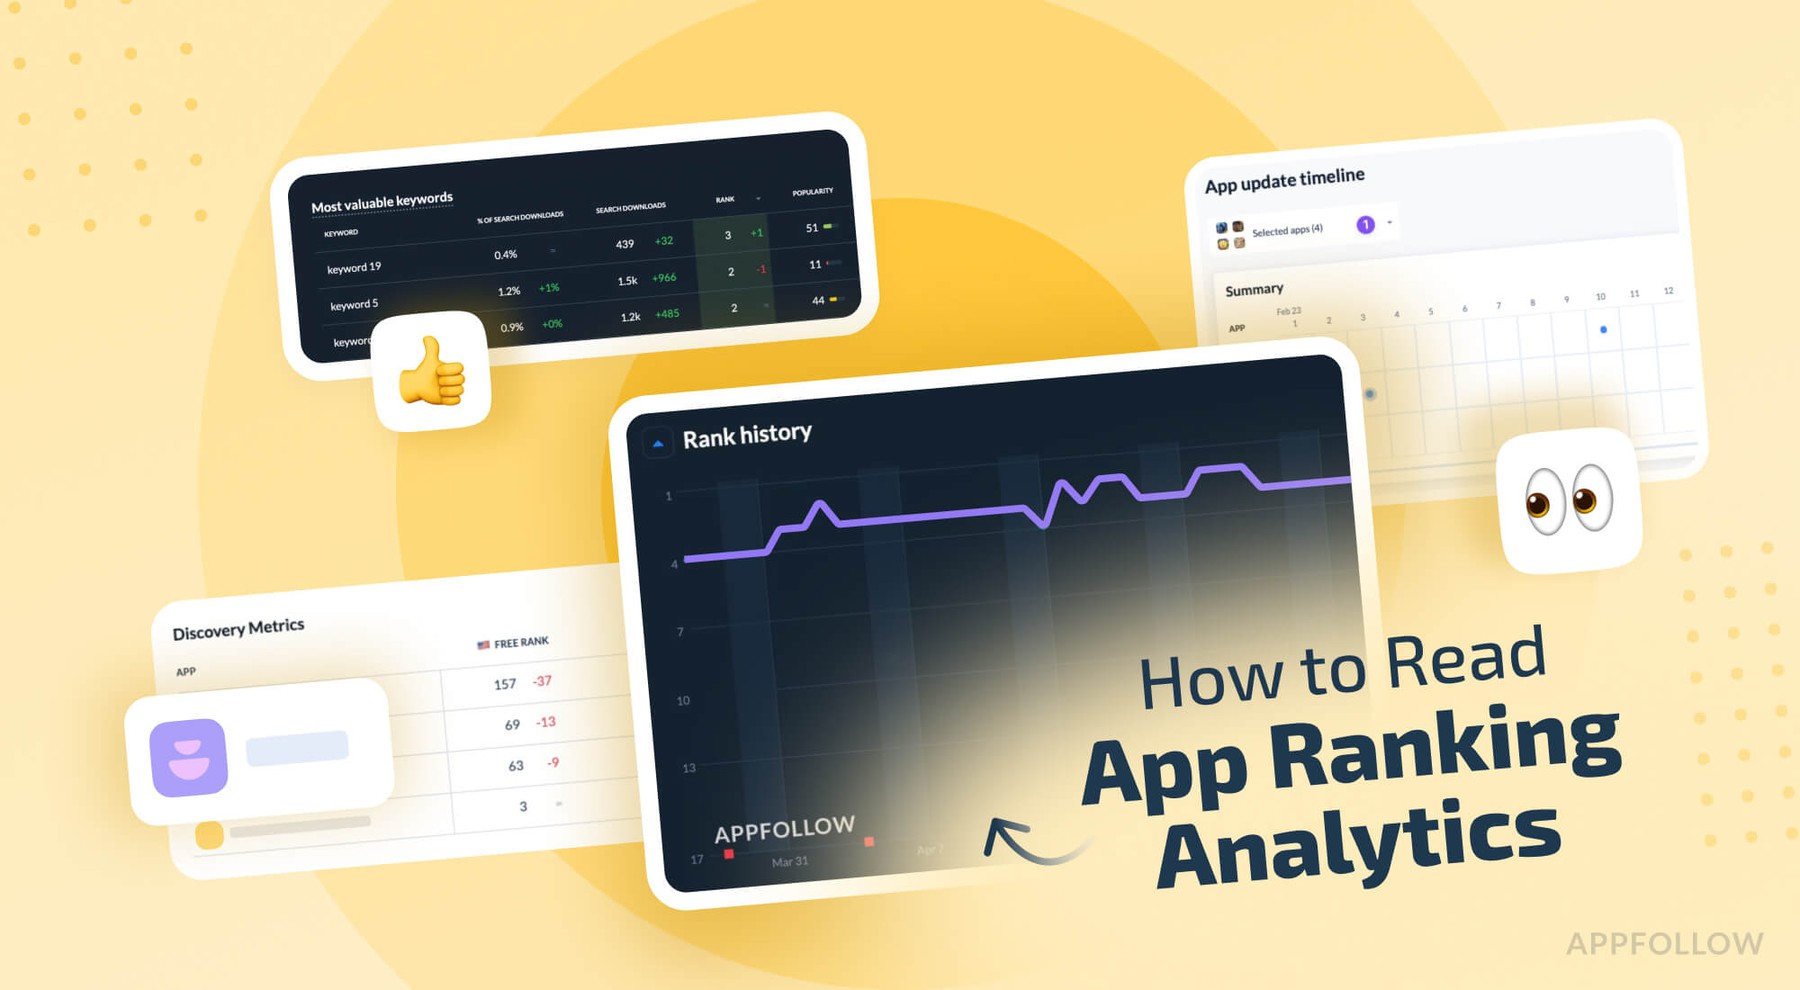
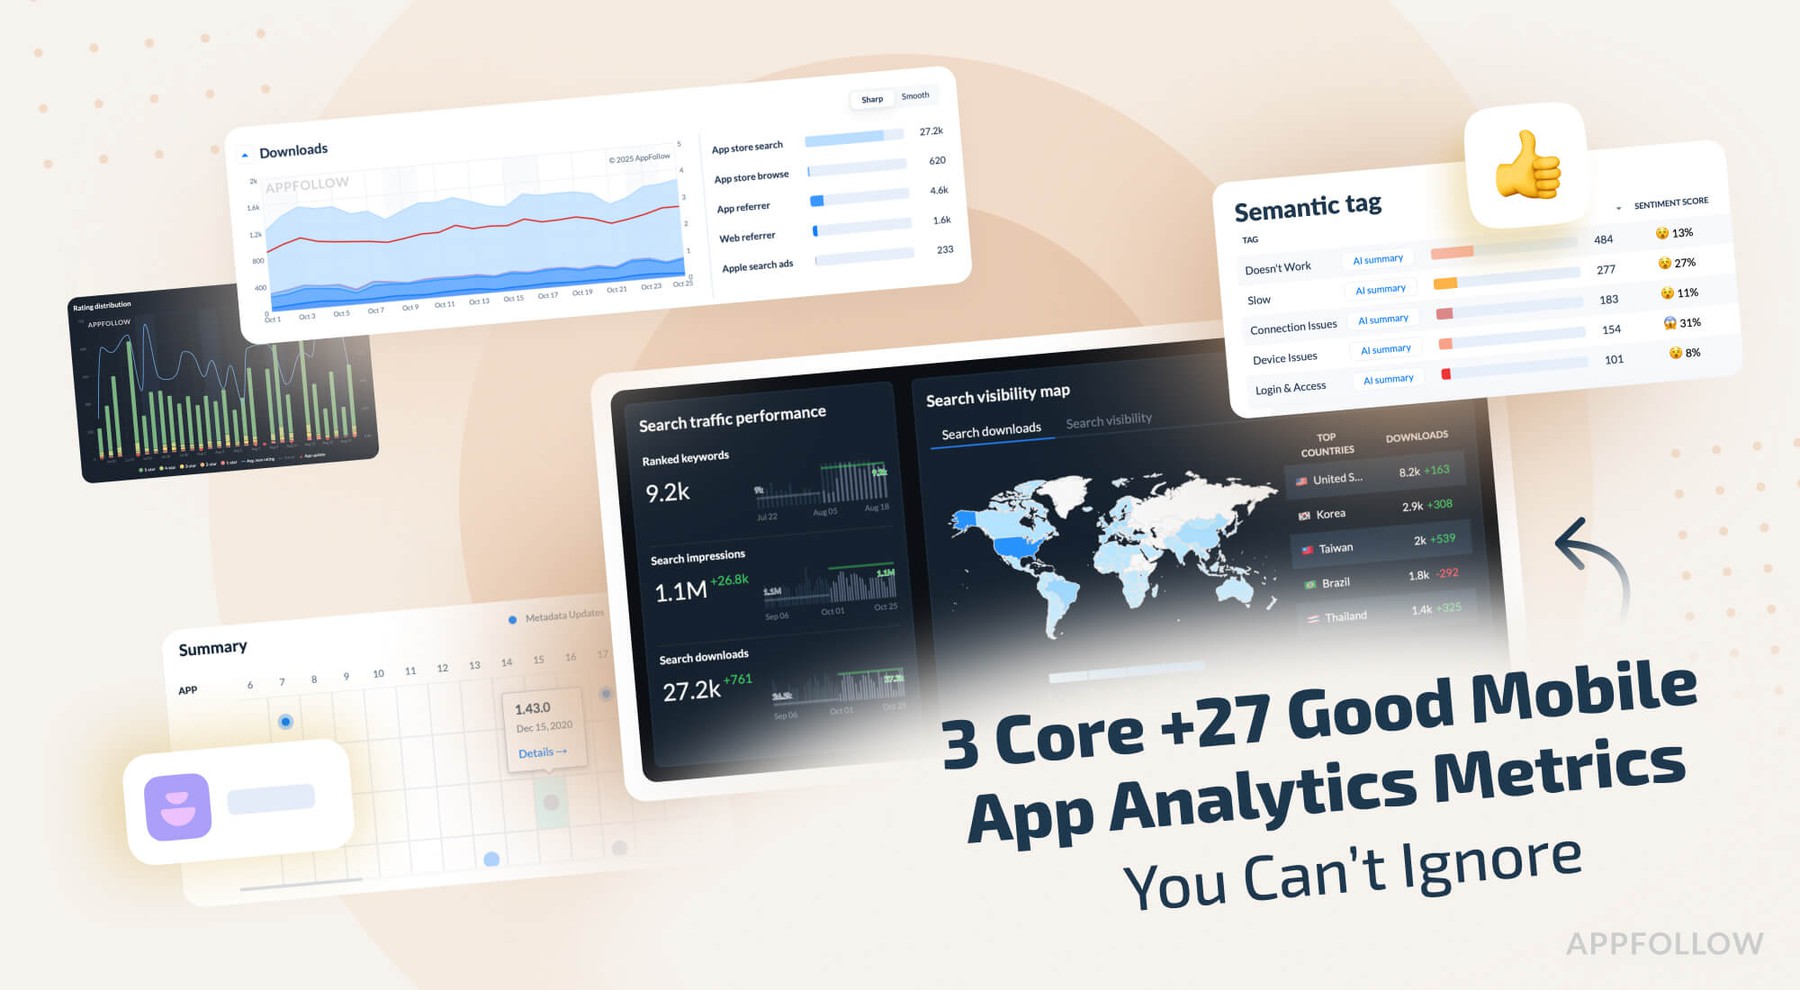
30 Mobile App Analytics Metrics You Can’t Ignore (Part 2)

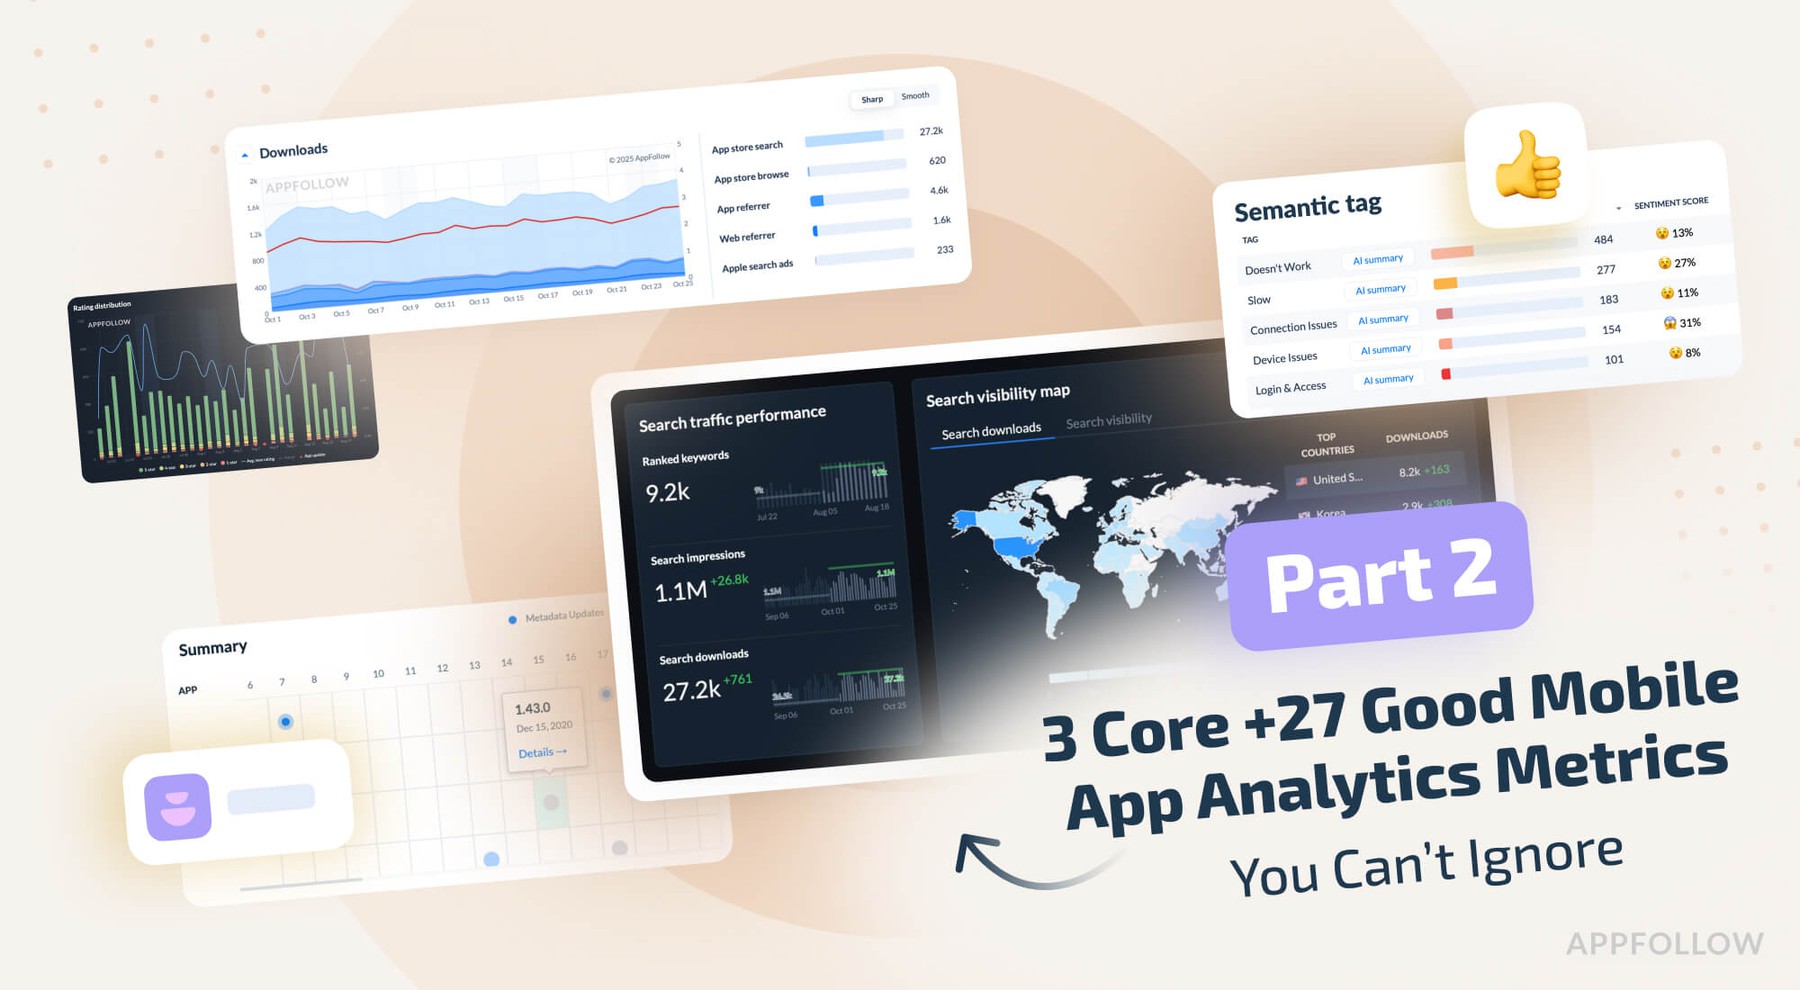
Table of Content:
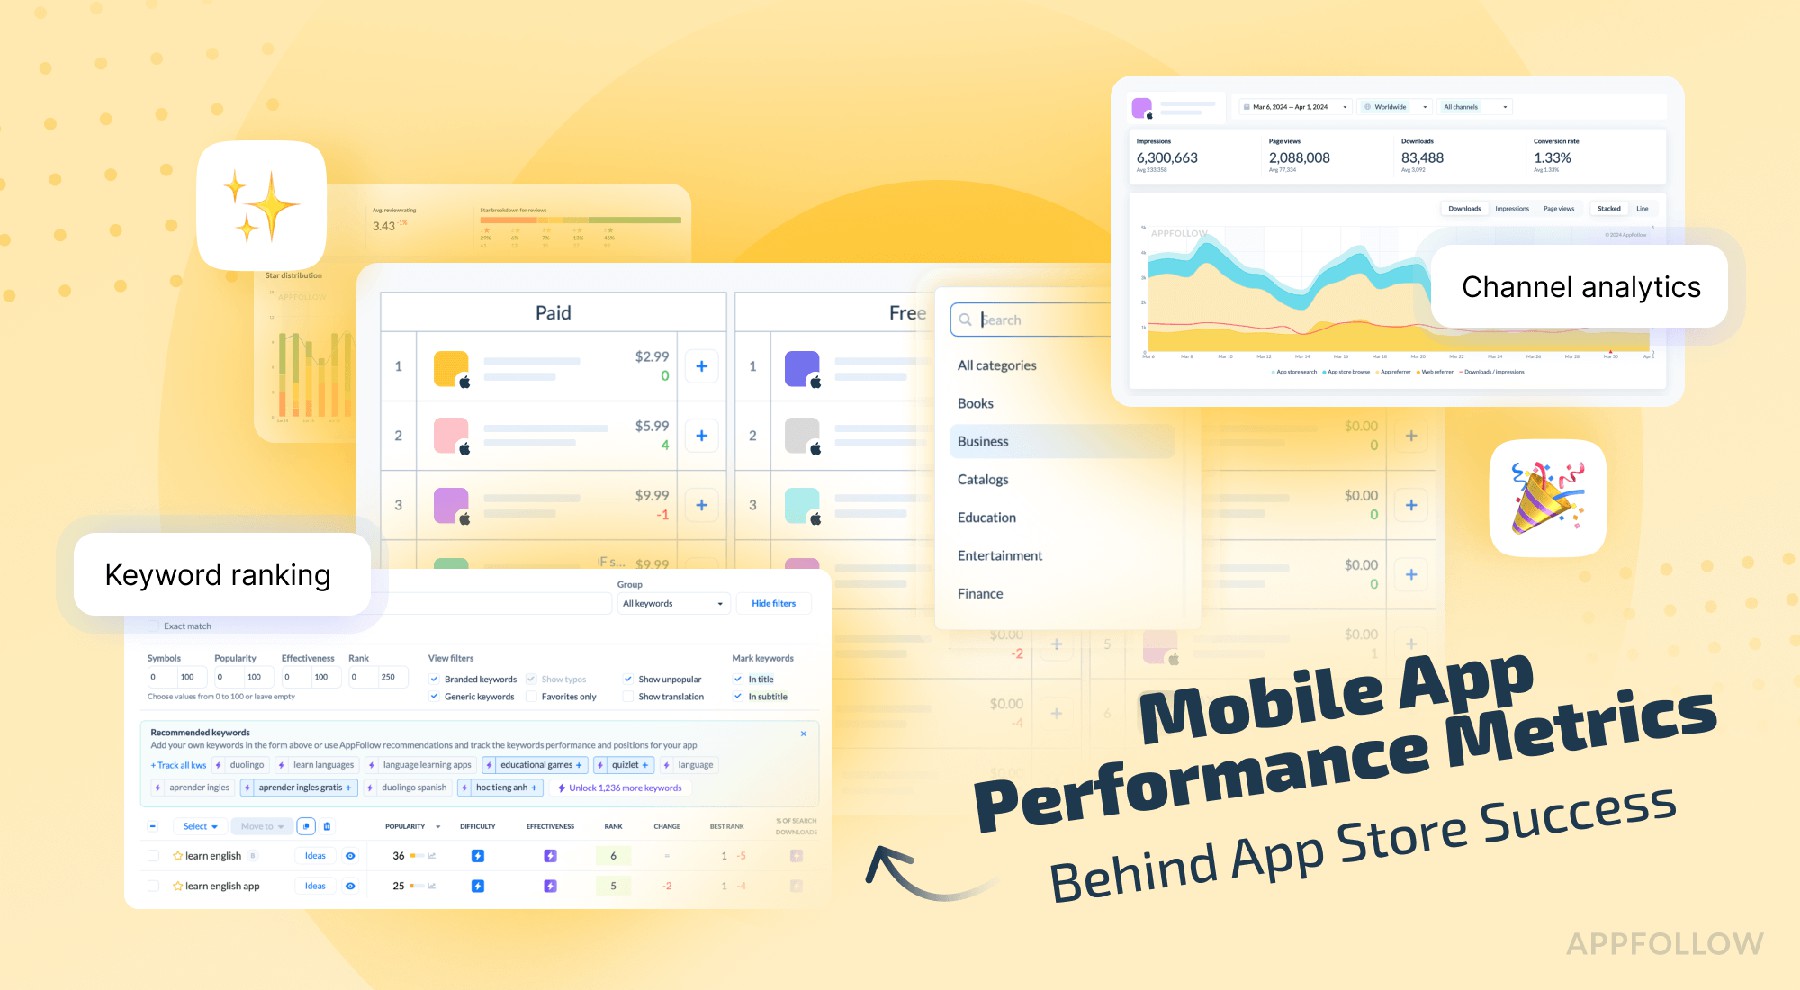
If you’re looking for a list of metrics to measure your app performance on App Store, Google Play, and the Amazon Appstore, you are in the right place. This is Part 2 of our huge guide to 30 mobile app analytics metrics. Here, you’ll find 12 of them grouped by real-world use cases:
- Building user trust
- Maximizing conversion rate
- Outmaneuvering competitors
- Accelerating new releases
Each section has a relevant list of metrics, so you can track what matters and act faster.
But if you’re looking for the core mobile app analytics to track from Day One, or metrics to measure when launching for discoverability or driving search growth, head to Part 1.
Let’s dive into Part 2 and turn intent into insight.
Mobile app metrics to track when building user trust
Before a user becomes a customer, they become a skeptic. And if your mobile app can’t earn their trust in the first session, the drop-off is instant, and expensive. That’s why I always zoom in on a different layer of mobile analytics metrics here. It’s not about keywords.
It’s about how users feel, click, and rate you after install. This is where sentiment meets signals, and trust turns into revenue.
Let’s break down the mobile app metrics that help you stop guessing and start earning loyalty, one honest signal at a time.
App reputation index (composite rating + sentiment)
The App Reputation Index is the heartbeat of your app’s public trust, one number that blends ratings, review trends, sentiment, and how effectively you flip unhappy users. In AppFollow, it’s your single-glance truth about whether the market sees you as a safe bet or a sinking ship, often before your revenue or session KPIs start to crack.
What it looks like in AppFollow:
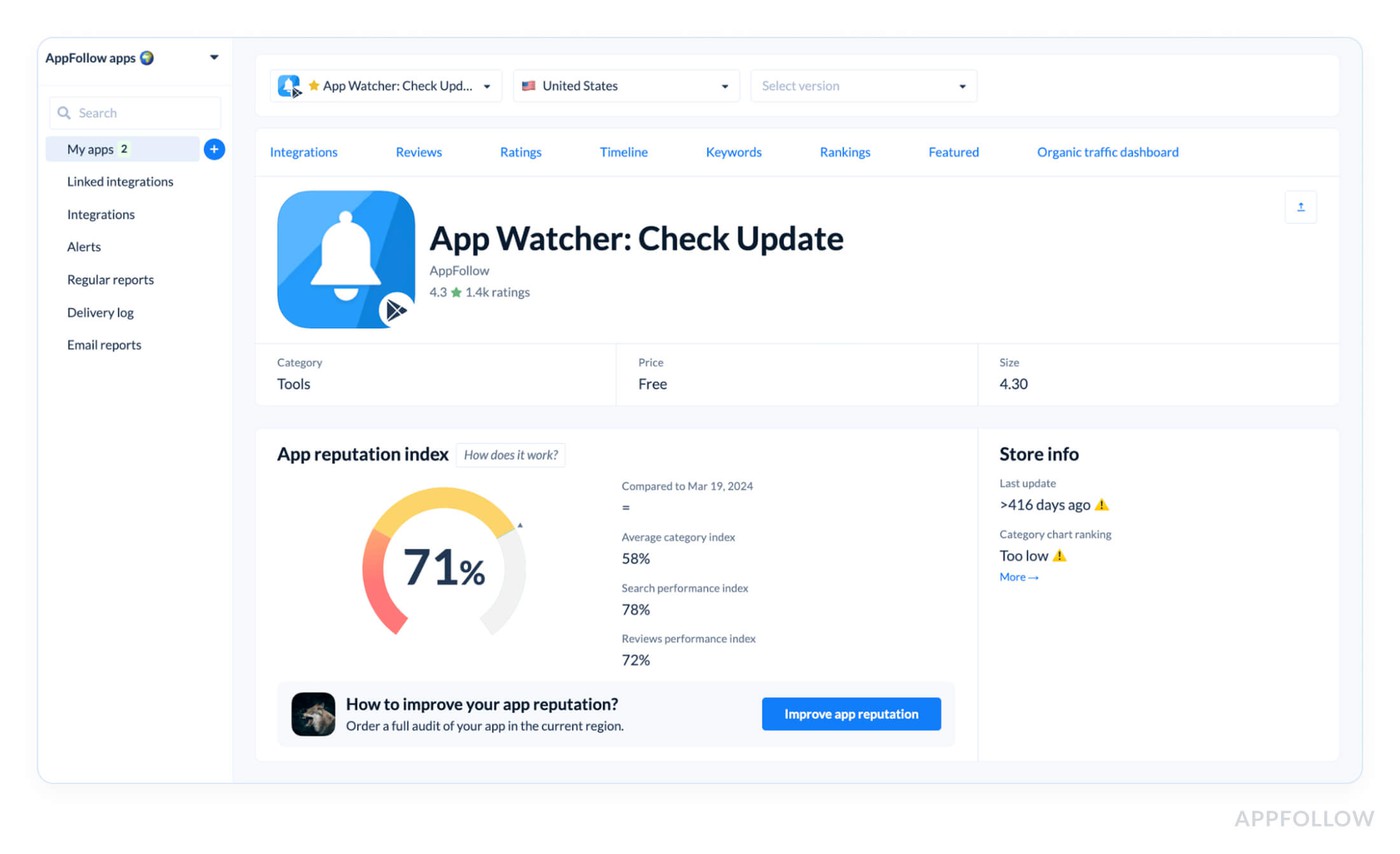
Hover over any metric, and you’ll see the trends that push it up or down.
For example, one fintech app sat at 86. Six weeks later, it slid to 72, reply rates tanked, “account lockout” complaints jumped 31%, and retention fell 9%. They cut SLA from 72h to 24h, tagged every “lockout” review, and shipped a hotfix. Two weeks later, index bounced back to 88 and installs recovered.
Best practices:
- Audit weekly, trend shifts >3 points in a week need eyes now.
- Stay ≥85, below this, you’re likely leaking conversions.
- When sentiment drops >10% on a repeat keyword, pair a product patch with targeted replies for fast recovery.
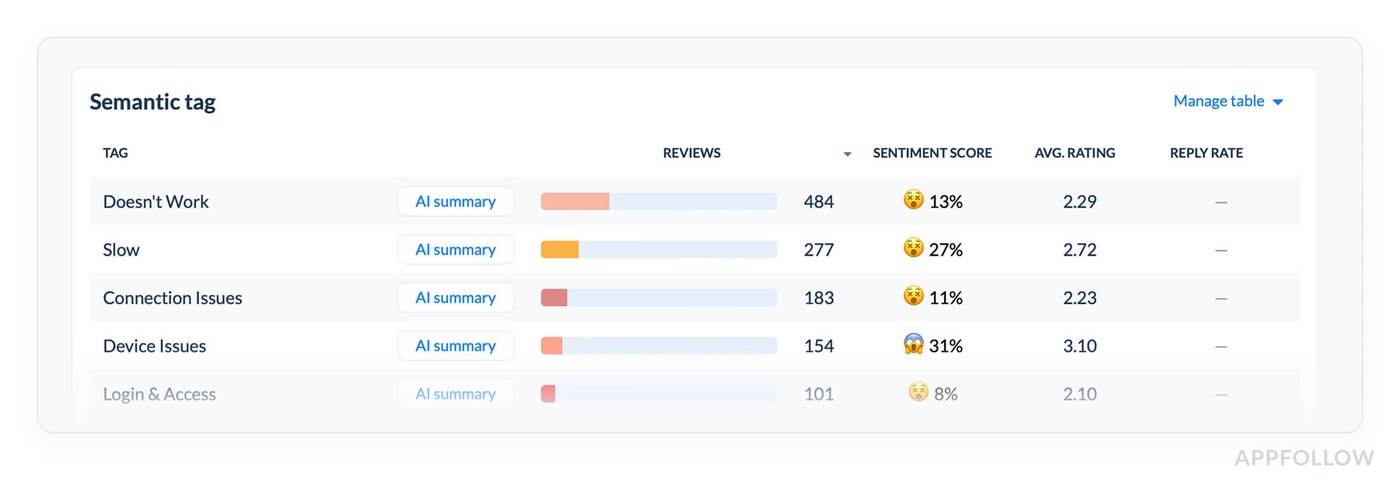
Sentiment analysis & auto-tags for reviews
Clear signals that your users are currently delivering to you through feedback. The question is: Are you capturing them?
AppFollow's sentiment analysis uses semantic algorithms to figure out whether your user evaluations are favorable, negative, or neutral. It doesn't just stop at vibes. Auto-tags go deeper by grouping reviews into useful themes like problems with logging in, complaints about ads, uncertainty about the UI, or errors with subscriptions.
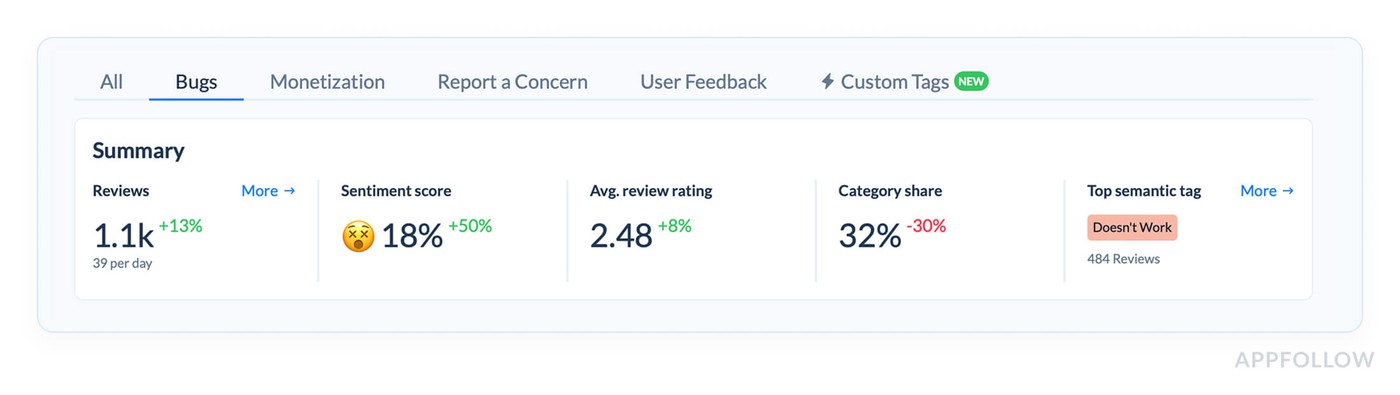
So instead of having to read through more than 2,000 reviews by hand after a significant upgrade, you get a filtered, prioritized perspective of what's shaking user faith and what's just noise.
Semantic analysis in Appfollow. Test it live with a 10-days trial.
A team I worked with recently released a beautiful new user interface. Their 4.6 rating hadn't changed in two weeks, but their DAU was going down. Why? There were dozens of comments like "can't find settings" and "where did dark mode go?" hidden in their stream of evaluations. The average star rating stayed the same. The feeling did.
They didn't see it until they accessed AppFollow's review analytics tab and discovered that the sentiment was leaning strongly toward neutral, with increases in the "UI" and "Navigation" tags.
What to look out for: An excellent goal is to have 70–80% of people feel comfortable about it. If you're less than 65%, you need to look at those auto-tags right now. If you're over 85%, congratulations! But make sure you're marking all languages and places, otherwise you won't get the whole picture.
Check sentiment every week, especially after app updates, big sales, or changes to the user experience. Keep an eye on tag trends, if a negative tag grows for more than three days, it's worth reporting.
If the number of "login" difficulties goes up by 20%, check your sign-in flow and test it on several devices.
Karen Taborda, Customer Growth Team Lead:
“A solid suggestion for automation from the field: "We set up auto-tags by topic and sent the most important ones straight to Slack." If "crash" or "payment" comes up more than five times in 24 hours? Boom! Our product team gets links, context, and severity scores sent to them.”
Review statuses, bulk actions & response tracking
When I'm in conversations with teams looking into performance drops, the debate invariably comes back to one thing: "Are we really doing what users are asking us to do?" That's where AppFollow's Review Statuses come in. They are much more powerful than people assume.
Every review in AppFollow goes through a status lifecycle:
New → In progress → Replied → Deferred → Archived
This flow may seem basic, but it allows you complete access to your review operations. When you use Bulk Actions and Response Tracking together, you can find bottlenecks, find missing feedback loops, and most importantly, show people that you are listening.
Take a look at this from the Reviews dashboard:
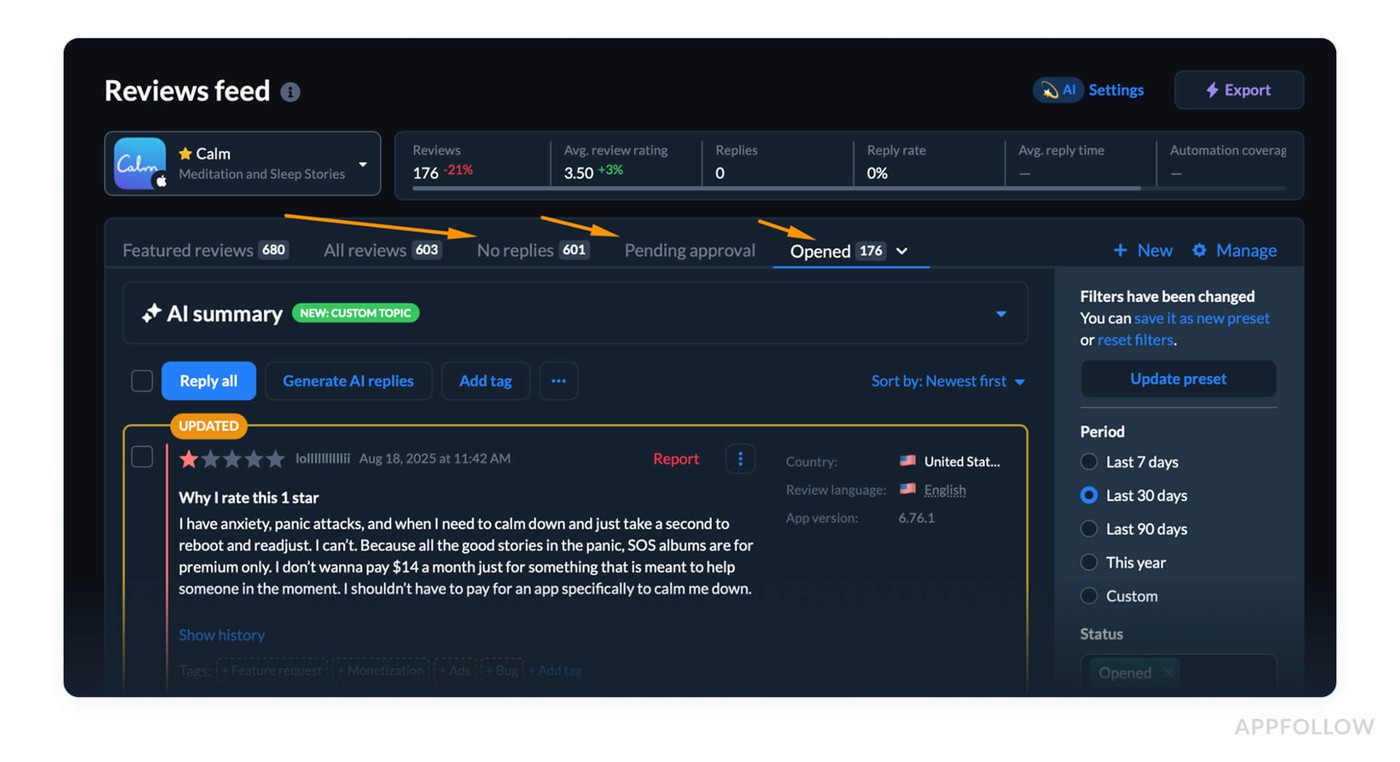
Review statuses in Appfollow. Test it live with a 10-days trial.
It is vital because trust in users goes down quickly when there is no communication. One gaming client dropped 0.2 stars in a week since a problem got into production and their team hadn't answered over 300 bad reviews. They were "keeping an eye on sentiment" but not doing anything about it.
Another financial client noticed a 12% boost in retention in 60 days after putting in place a review reply procedure and checking it daily through statuses.
Real-life math: Let's say you got 500 reviews last week. You answered 350 of them. That is: (350 ÷ 500) × 100 = 70% Rate of Response. If that percentage drops below 50%, you can be missing out on value and trust.
Best ways to measure this metric:
- Check once a week to see if your volume is consistent. Daily if you're in the middle of an update or a new feature launch.
- Try to get at least 80% of people to respond within three days, especially for evaluations with 1 to 3 stars.
- If "In Progress" is more than 15%, look into automating replies or hiring more people. This suggests that replies are becoming stuck.
Ilia Kukharev, Product Manager:
"Use AppFollow's templates or AI to set up auto-replies for frequently asked questions, but tag anything that shows frustration, like 'crash,' 'bug,' or 'stuck,' so you can sort them by hand."

You will save hours and be able to see sentiment increases early.”
What metrics to track when you want to maximize conversion rate
You’ve nailed discoverability, users are landing on your page… but the install button? Still not getting enough love. That’s where conversion rate becomes your obsession. And trust me, this is where most teams stall, right between visibility and action.
In this section, I’m unpacking the mobile analytics metrics that tell you what’s working (and what’s quietly killing installs) on your app’s store listing. We’ll cover the KPIs tied to creatives, page scroll behavior, and that crucial “why didn’t they tap download?” moment.
With real app store download statistics, smart feature tests, and proven best practices, you’ll learn how to read app download analytics like a pro and turn traffic into traction.
Download Estimates & Trend by Territory
This one’s a backstage pass into how your marketing, store visibility, and engagement efforts are performing, territory by territory.
Inside AppFollow, this metric shows you the estimated app store number of downloads over time, broken down by country and platform (iOS or Google Play). It’s modeled using a blend of store rankings, keyword visibility, and category movements, so even if Apple’s tight-lipped, you still get the full picture.
And here's the real gold: you can see where conversions are rising, where they’re stalling, and which campaigns are pulling their weight.
Real-world math: Let’s say in the last 7 days, your iOS app ranks consistently in the top 10 for “habit tracker” in Canada, and AppFollow estimates 6,500 downloads during that period. You localize your screenshots for Quebec and rerun Apple Search Ads, next week jumps to 9,200 downloads. That’s a +41% week-over-week growth driven by a conversion fix.
Best practices:
- Check weekly for each priority territory. Daily during launch or ad push.
- Benchmark: 10–15% MoM growth in your top 5 countries = strong performance.
- If downloads in a key country drop >20%, audit store assets + check category shifts.
Channel Analytics & Organic Dashboard
Let’s talk about a moment when a team celebrates a spike in downloads, champagne, Slack emojis, the works, and then someone asks the question that kills the vibe: “Wait… do we know where those users came from?”
Silence. Shrug. Panic.
That’s where Channel Analytics and the Organic Dashboard in AppFollow step in like total lifesavers. Because it’s not enough to know your app store number of downloads is up. You need to know why, from where, and how much it costs you to get there.
Channel Analytics breaks down your install sources: paid campaigns, organic search, app store browsing, and custom channels. You see what’s driving your traffic and whether it’s converting. Paired with the Organic Dashboard, you can dig deeper into the “free” side, discovering which keywords or store placements are silently doing the heavy lifting.
This combo gives you clarity on:
- Which channels drive the most engagement
- Where your marketing is overperforming, or underdelivering
- And how to balance cost and growth without flying blind
You’ll find it under: ASO → Channel Analytics
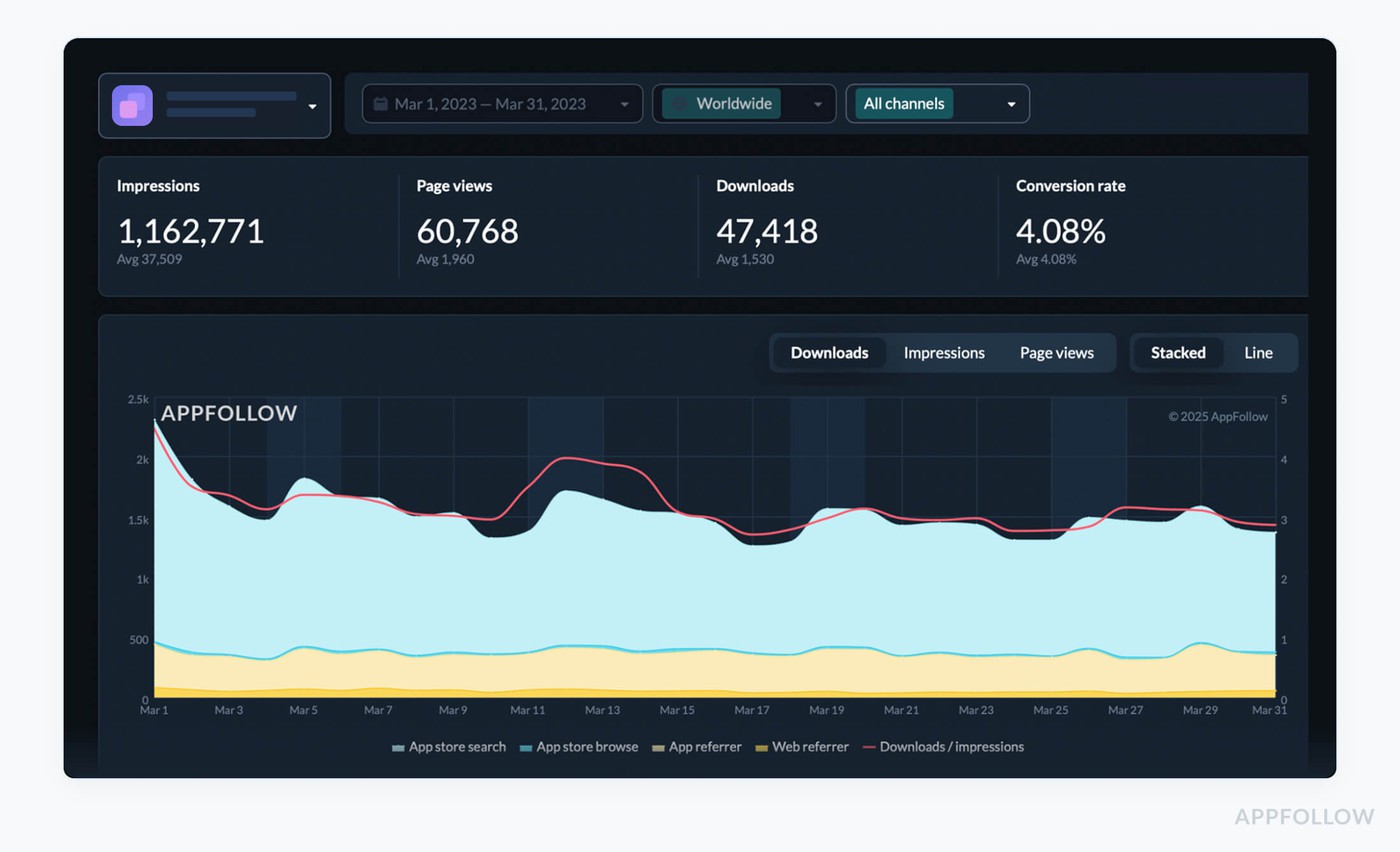
Channel analytics in Appfollow. Test it live with a 10-days trial.
When teams ignore this data, they end up scaling spend, not results. One AppFollow user, a social fitness app, ran Apple Search Ads across five regions. Installs looked strong, but conversion was weak. Turns out, most high-converting users came organically from browse traffic in just two countries. They paused two underperforming campaigns, optimized metadata for top-performing regions, and boosted organic downloads by 27%, without spending more.
Let’s say you hit 15,300 installs last month. Here’s the spread:
- Apple Search Ads: 3,400
- Facebook Ads: 2,100
- Organic (Search + Browse): 9,800
Now plug it in: (9,800 ÷ 15,300) × 100 = 64.05% Organic Share
If you were chasing paid installs but your organic already covers 64%, and with the best CVR, your next move isn’t “buy more traffic.” It’s “double down on what’s working.”
How to act on this data:
- Check it weekly, or daily during UA pushes or feature launches.
- Benchmark: 60–70% organic share in top-performing countries.
- If engagement drops on high-cost channels, pause, inspect creatives + store listing, and reallocate to organic optimization.
Conversion Rate Benchmark (installs-per-view vs. category)
You run the campaigns, polish your creatives, localize your assets, drive a wave of store traffic... and then installs flatline. That’s the moment I usually say, “Okay, let’s stop guessing. Pull up your Conversion Rate Benchmark.”
Because traffic is only the first step. What happens after users land on your app page? That’s where conversions, and ultimately revenue, are won or lost.
The Conversion Rate Benchmark in AppFollow helps you measure exactly that: how well your app store listing turns visitors into users. It compares your installs-per-view rate against the median for your app’s category, so you’re not just watching your own numbers, you’re seeing how they stack up across the board.
And for mobile app teams who obsess over session behavior, marketing ROI, and engagement loops, this metric is your north star for store performance.
Benchmark = Your CR% vs. Category Median
You’ll find it in AppFollow under: ASO → Conversion Benchmark
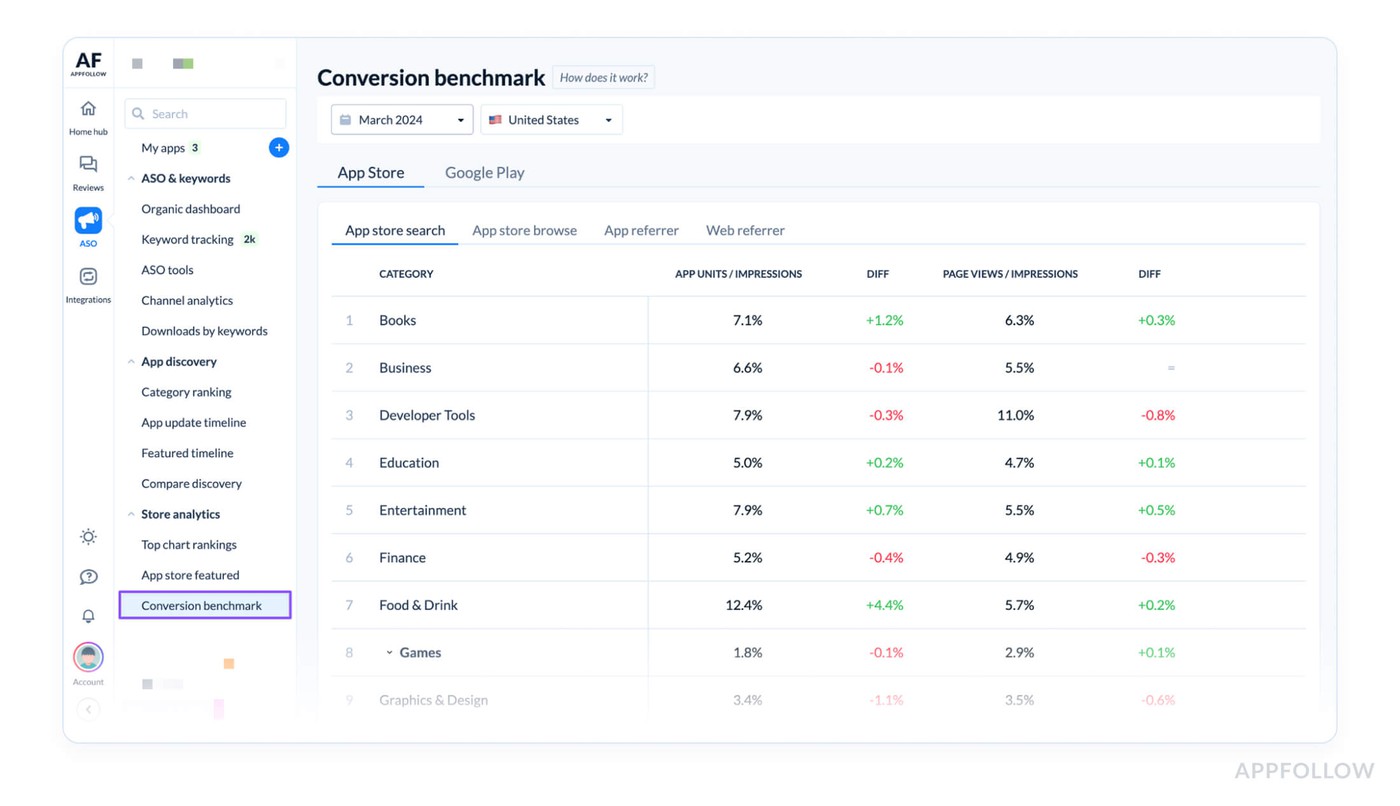
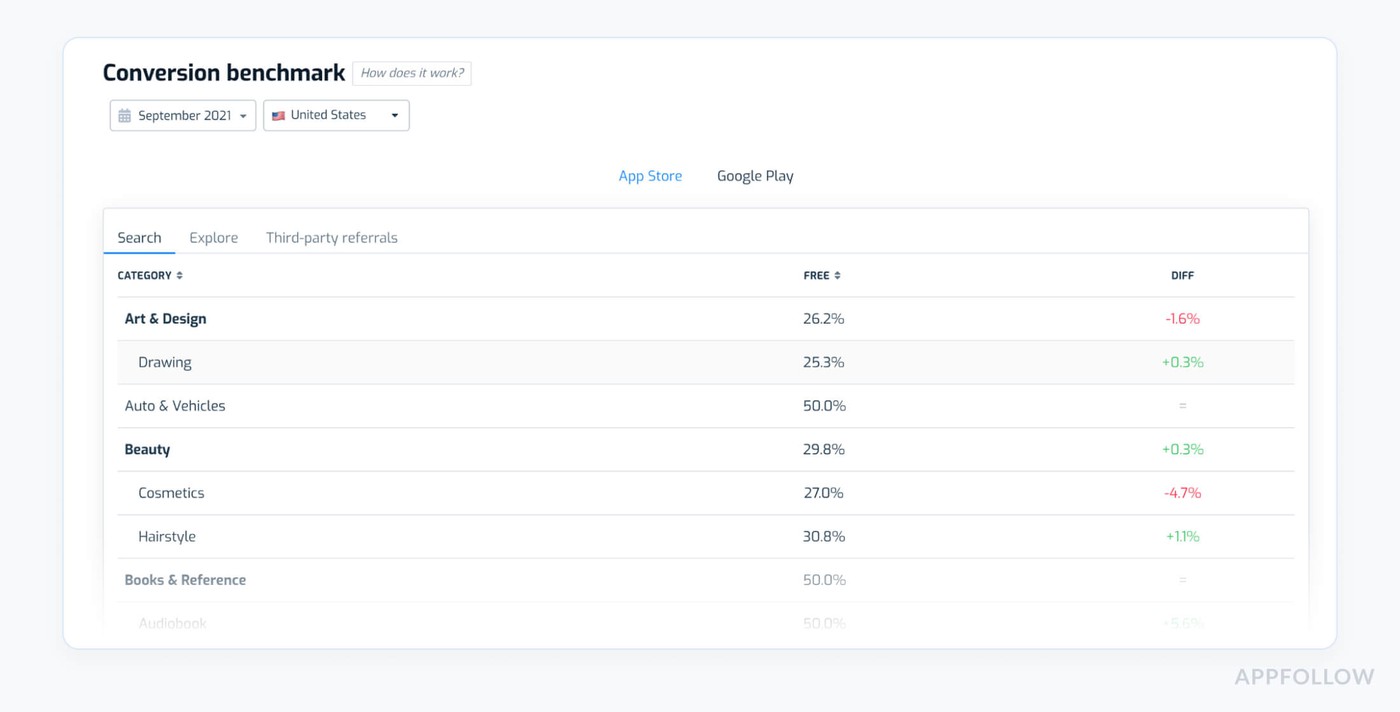
Conversion Benchmark in Appfollow. Test it live with a 10-days trial.
This table is where conversion clarity begins. It tells you if your visuals, copy, and metadata are earning trust, or quietly leaking potential users out the side door.
One client we worked with, a mobile meditation app, was pushing heavy UA but couldn’t figure out why installs had plateaued. When we checked their CR Benchmark, they were converting at 3.2% while their category averaged 6%.
That one insight shifted their strategy. They updated their first screenshot to focus on time-to-relief (“Calm down in 90 seconds”), tweaked their subtitle, and tested testimonials in the preview video. Within four weeks, their CR climbed to 5.4%, and monthly revenue jumped 18%. Zero extra ad spend. Just conversion alignment.
Let’s say your app had 50,000 product page views last month and 2,100 installs:
(2,100 ÷ 50,000) × 100 = 4.2% CR
Your category’s median? 5.7%. That gap? It’s costing you users every single day.
How to act on it:
- Check biweekly, or immediately after any metadata, asset, or localization update
- Aim to beat your category median by at least 0.5–1%, especially if you’re targeting competitive search terms
- If you're 1% below median, test your first screenshot and subtitle before adjusting the rest of your page
Out-maneuvering competitors
When you're up against smart competitors, surface-level mobile app metrics won’t cut it. You need to dig into personalized insights, the kind that show how users are reacting to your updates vs. theirs, where your messaging is winning (or flopping), and what changes are helping you outrank them in real-time.
In this section, we’re looking at the sharpest mobile app metrics analytics for competitive edge: the ones that uncover gaps, flag opportunity windows, and help you act before the next session even starts. Because outmaneuvering is tracking the right mobile app metrics faster than they do.
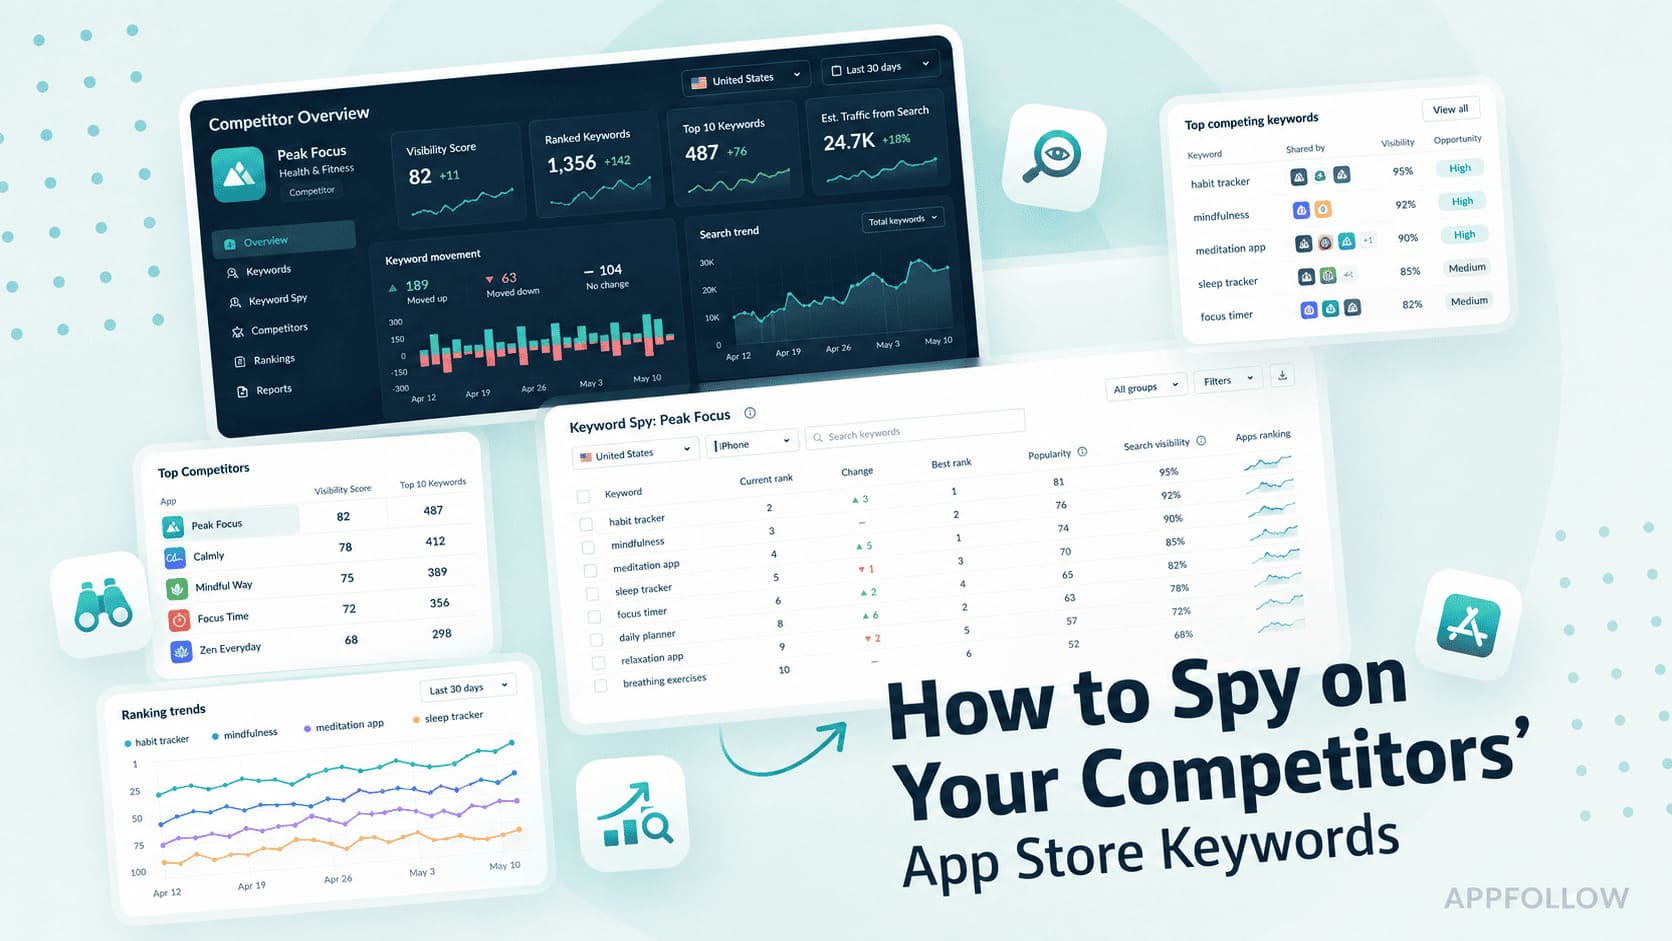
Compare Discovery (share of voice in top search)
Imagine your app, along with a lot of other well-known apps, competing to get the attention of those high-stakes keywords. Share of Voice (SoV) in top search examines how often your app appears at the top of search results when people are looking for certain terms, compared to how often your competitors do the same thing.
For people who utilize AppFollow, SoV is the "heartbeat monitor" that tells you how easy it is to find. With all the noise in app analytics, vanity measures, and surface-level stats, this one shows you if your marketing and engagement efforts are really making a difference in exposure where it matters.
I've seen client after client gawk at rising install numbers or worry about conversion rates, but they still missed the main problem: their apps weren't getting enough exposure to the people who were most likely to buy them. SoV shows how well your keyword optimization and paid advertising are really working. It can show problems like targeting keywords that aren't relevant, changes in user behavior, and sometimes a clever competitor outbidding you on a high-value phrase.
People who work in app marketing and have to deal with regional split tests, multi-channel launch timelines, or drops in revenue always say to me, "The second I started reacting to SOV changes, my whole marketing playbook changed."
Here is how this metric dashboard looks like in AppFollow:
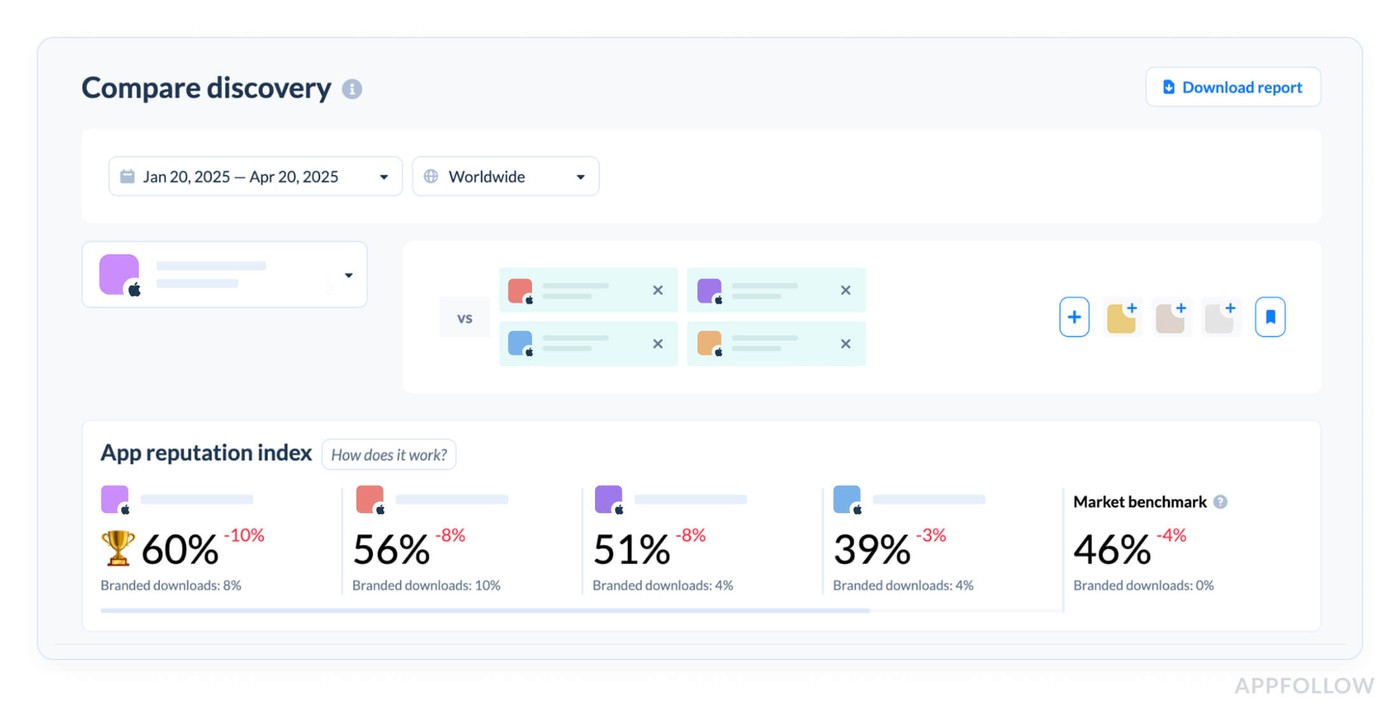
Test it live with a 10-days trial.
A fast look shows where you're doing well and where your money might be going to more nimble competition.
Patterns and benchmarks to look for:
- For specialty or branded keywords, leaders normally get 30% to 45% of the clicks.
- For very competitive generic phrases, even getting more than 10% to 15% of the clicks can mean your marketing is working.
- If your app's engagement or marketing mix isn't working, or if your paid plan needs some work, this number is generally below 10%.
Keep an eye out for SoV to change quickly. A decline could signal that a new product from a competitor is getting a lot of attention, while a spike could be the result of a well-timed marketing campaign.
For example, think about going after "healthy recipes" in the US: Last month, your app had 2,400 impressions. Total impressions (for all apps with the same keyword): 10,000.
That means that around 24% of shoppers see your app first, which is the kind of visibility that consistently brings in money and keeps people interested.
Best practices when tracking Compare Discovery metric:
- Make it a habit to look at SoV every week after you make changes to your ASO, add new creative, or start new paid marketing efforts.
- Set Smart Targets. For most portfolios, a SoV of 20% or more on the important keywords that drive conversions is a good indicator of progress. For core branded phrases, aim for 40% or more.
- If your SoV for a keyword that brings in money drops by 5% or more after a competitor's update, use fresh creative assets or move paid budgets right away to get engagement back up to speed.
Yaroslav Rudnitskiy, Senior Professional Services Manager:
“Set up an AppFollow automation so that you and your CMO get an alert in Slack every time your SoV for a mission-critical keyword drops by 10% week-on-week. No more spreadsheets, no more surprises. Let the platform keep an eye on things all the time so your team can work on creating the next big campaign.”
Compare Meta (icons, screenshots, descriptions)
Sometimes it’s not your targeting that’s off. Or your budget. Or even your keywords. Sometimes, you’re losing users because your app icon looks outdated, your screenshots don’t spark action, or your competitor just launched a killer video preview that’s stealing attention right at the conversion point.
That’s why when I’m helping teams audit their store presence, I always pull up Compare Meta in AppFollow first. It’s like walking into your category's storefront lineup and seeing exactly what customers see, before they make a choice.
Compare Meta lets you monitor how your visuals and metadata stack up against your competitors, side by side, in real time. You can compare app icons, screenshots, videos, descriptions, titles, subtitles, and version histories across markets and platforms.
It’s essential when:
- You're about to run a big campaign and want to match the visual language of your category
- You’re losing retention at the first session and suspect store misalignment
- You’re updating assets and need to benchmark what’s performing in your space
In other words, if Competitor B updated their icon and their downloads spiked shortly after… your job is to reverse-engineer that success. Or at the very least, not ignore it.
Go to: ASO → Compare Meta
Then select your app and 2–3 competitors. Here’s what it looks like in simplified form:
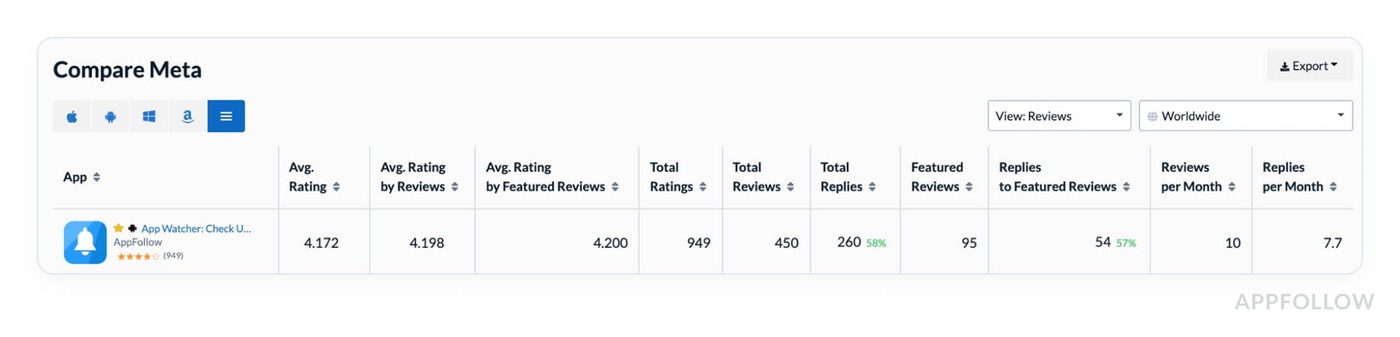
Pair this with their download trend from AppFollow’s analytics, and you start seeing patterns others miss.
One client, a guided journaling app, kept seeing bounce after bounce on their product page. Everything else looked healthy. Their keywords were fine, ratings stable, traffic strong. But then we checked Compare Meta.
Their screenshots looked completely different from every other top-ranking app in the category. White background. Abstract illustrations. No UI, no benefits. Their closest competitors? Screens full of calming gradients, real product previews, bold outcomes like “Less stress in 5 mins.”
They ran a new creative test set aligned with that narrative, and cut their cost per install by 22% in two weeks. Customer retention in week 1 improved by 11%. Why? Because the users landing on the page finally got it.
Best practices when working with Compare Meta metric:
- Check every 2–4 weeks, especially before or after metadata updates
- Benchmark: Update visuals at least once per quarter, or after any major release
- If a competitor updates and you see a spike in their downloads, note the changes and A/B test similar elements on your next push
Peer Category & Chart Ranking Benchmarks
Imagine your app stepping out onto the track for the big industry race. Peer Category & Chart Ranking Benchmarks show you not just your time, but exactly where you stand in the field. These metrics reveal your app’s position relative to competitors in your category (think: “Health & Fitness,” “Finance,” or “Games”) by country, ranking chart (Free, Paid, Grossing), and even download tier.
For AppFollow users, this is how you know whether last night’s install surge made you a contender or just kept you in the peloton. We’re talking real-time market context for your marketing, engagement, and revenue moves.
When AppFollow clients start watching the “Category Rankings” in AppFollow, they can instantly spot if their shiny marketing burst landed them in the Top 10 for “Utilities” in Germany or if a revenue dip coincided with sliding to the #45 spot on the US charts.
You see exactly where the path forks, should you double down on ASO, launch a new campaign, or tighten onboarding to compete with the median benchmark? Peer Benchmarks unlock that high-res strategic vision.
AppFollow aggregates ranks and percentile data from stores to display:

You’ll spot this on the Category Rankings page or under Compare Discovery, color-coded for momentum (green for gains, red for dips). Filter by country, time span, or even device to laser-focus your insight. Each entry shows not just today’s rank, but exactly how your position is trending across time, unavoidable for marketers working with seasonal spend or campaign spikes.
Benchmarks:
- Top 10 or Bust. Apps consistently breaking Top 10 in a high-competition category often scoop the lion’s share of downloads and, yeah, revenue.
- Sudden Drops. A 5+ position drop week-on-week in a key market is your early warning alarm, often tied to a competitor campaign, a poor review streak, or store featuring shuffle.
Say you were ranked #25 last week in “Health & Fitness” on the iOS Free chart. This week, you’re at #16.
25 - 16 = ▲ 9 spots
At the same time, your closest competitor moved from #20 to #10. That trendline tells a story. You’re climbing, but they’re climbing faster, and you need to know why.
Best practices:
- Check 2–3 times per week, especially during launches, store updates, or seasonal campaigns
- Aim to stay within Top 25 in your core category to maintain strong organic visibility
- If your rank drops >5 spots in a week, audit retention trends, review velocity, and featured placements, then act fast
Ilya Kataev, Professional Services Team Lead:
“Automate Slack alerts for any 3+ day slide in your chart ranking or when you drop below the peer median. AppFollow lets you set triggers, so you can patch leaks in marketing or engagement before they impact your revenue targets. Gives you more time for… margaritas and moonshots.”
Accelerating New Releases
New release coming? Cool. But before you hit “submit,” let’s talk messaging, personalized updates, and the app analytics metrics that keep you from flying blind. Launching without tracking is like cooking without tasting, especially when iOS app metrics can shift fast based on user feedback, store logic, and bugs you didn’t see coming.
This part walks you through the pre- and post-launch signals AppFollow clients track to speed up rollouts, spot red flags early, and make every update smarter than the last.
App Update Timeline & Release Notes Tracking
I was working with a product team behind a top-tier food delivery app. On the surface, everything looked fine. Reviews were stable. Retention wasn’t terrible. Updates were going out every couple of months. But when we dug into user feedback, a pattern emerged:
“I didn’t even notice anything changed.”
“Still no fix for this bug?”
“Why no mention of [feature] in the update?”
The problem wasn’t just product velocity, it was perception. Customers weren’t seeing progress. And that’s when we pulled up AppFollow’s App Update Timeline & Release Notes Tracking.
This view shows you exactly when your app and your competitors push updates, and what those updates say. It tracks frequency, release notes, platform, and country-level differences. In other words, it turns every release into a timeline of decisions, outcomes, and missed signals.
And when you layer that timeline over downloads, reviews, and rankings, you start spotting cause-and-effect patterns that most teams miss.
Because every release doesn’t just carry cost, it carries opportunity. A chance to re-engage churned users. A moment to shift perception. A quiet test of what builds trust. But only if you know how and when to track it.
Here’s what it looks like in AppFollow:
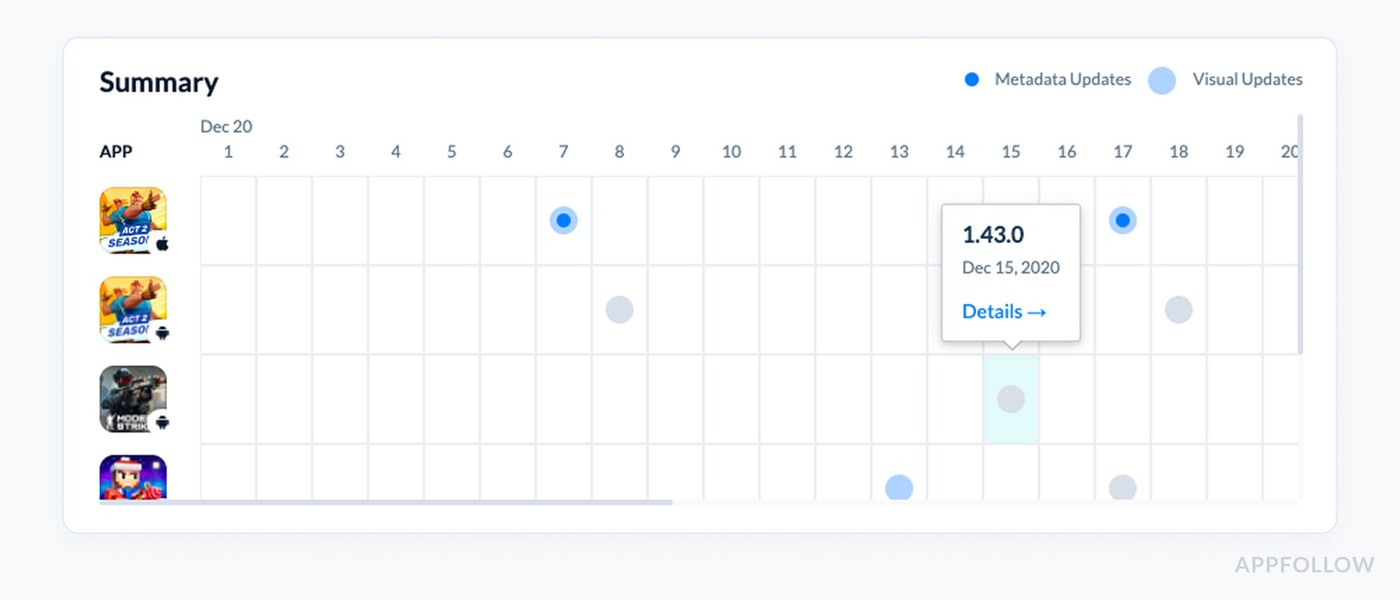
App update timeline in Appfollow. Test it live with a 10-days trial.
This is where you can compare update strategies side-by-side. Who’s releasing more often? Who’s communicating changes well? Who’s tying their product evolution to performance outcomes?
Say you release every 60 days. A competitor releases every 30. Over three months, they’ve had two more chances to surface in “Recently Updated,” collect post-update reviews, and re-engage churned users.
Now look at their numbers: 1.8x more new reviews, 11% better week-one retention, and a 0.2 star rating lift. That’s not just a cadence difference, it’s a compounding effect on customer experience.
Best practices:
- Check monthly, especially during roadmap planning or post-release retros
- Benchmark: 3–6 week release cycles are the current sweet spot across top 200 apps
- If reviews spike after an update, and your notes don’t mention the fix? Start writing better release copy, or better yet, tag the release themes in AppFollow so your whole team sees the context
Dzianis Shalkou, Senior Professional Services Manager:
“We automatically track competitor update frequency and version notes. When a top app in your category pushes a significant release and your rating drops shortly after, we flag it. That kind of signal lets product and ASO teams course-correct before impact compounds.”
Keyword Discovery for New Titles
Here's what I see way too often: a product team finally ships a shiny new feature or UI revamp. Downloads barely move. Visibility, meh. The ASO lead gets side-eyed in the Monday standup. And someone inevitably mutters, “Shouldn’t we have ranked for that feature name?”
That’s where Keyword Discovery for New Titles comes in, and why I always remind teams that your title isn’t just a headline. It’s your launch hook.
Keyword Discovery helps you uncover high-potential, underused, or trending search terms that you can strategically embed in your app title, subtitle, or short description when shipping a new release.
Because when you launch something new, say, AI chat, meditation packs, or budget goals, but keep the same title that’s been live for six months? You’re giving your competitors a head start on visibility you earned.
You’ll find this inside: ASO → Keyword Research
Here’s what it looks like:
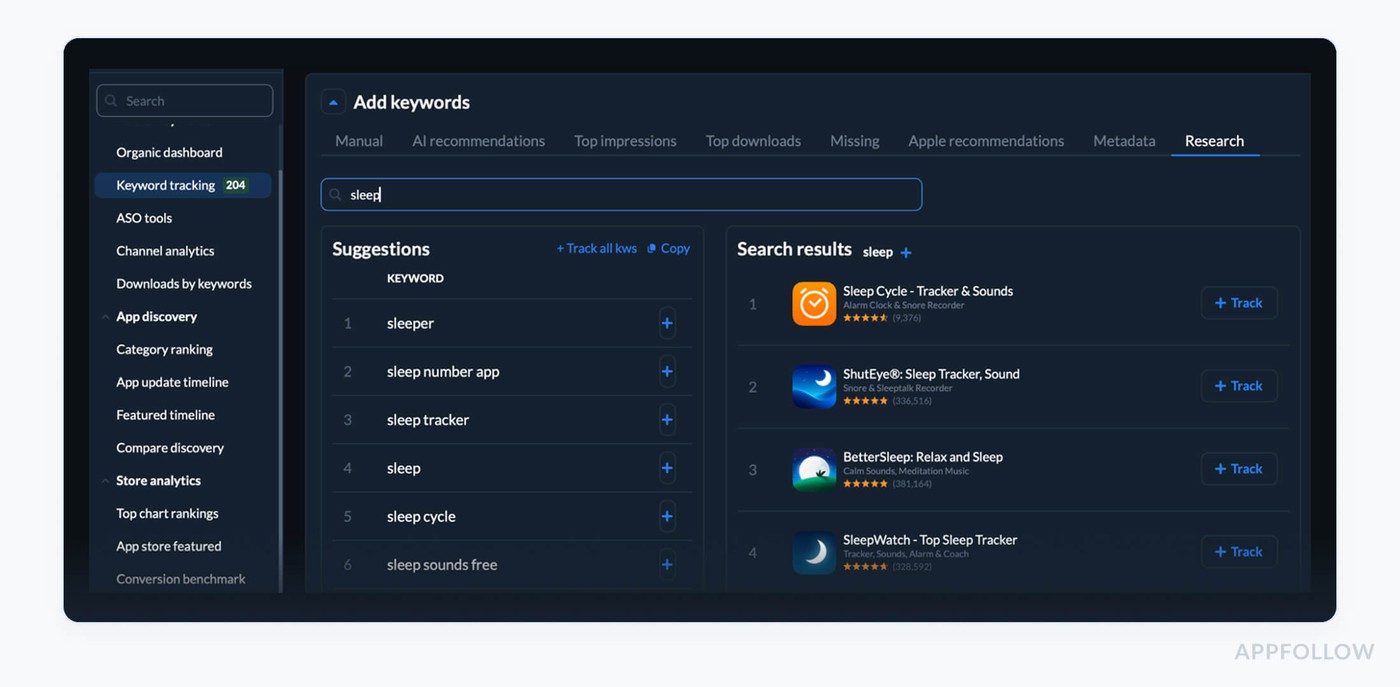
Keyword research in AppFollow. Test it live with a 10-days trial.
You can sort by score, filter by category, and track how a keyword performs across time. It’s not guesswork, it’s precision marketing for your release messaging.
Let’s say your app adds “offline mode” in your next update. You run Keyword Discovery and see “offline tracker” has a score of 2.9. Your current title doesn’t mention anything close.
You tweak it to “Focus Timer & Offline Tracker” before submitting the build. Post-release? You see an increase in browse-to-search conversions and a 22% lift in downloads from Tier 2 markets. That’s how you tie keyword discovery to revenue.
Best practices:
- Check 1–2 weeks before every release, so you have time to test and localize.
- Benchmark: Add at least one high-score keyword to every new title or subtitle push.
- If downloads plateau after a feature launch, audit which keywords are missing from your metadata and retest top scorers.
Alerts for Featured Placements & Rank Spikes
It’s the early-warning system every release deserves but most teams forget to set up.
These alerts automatically notify you when:
- Your app is featured in any territory, store section, or category
- Your rankings shift significantly (up or down) in the top charts or keyword positions
You’ll know exactly when the App Store or Google Play highlights your app, and when your visibility starts to spike, dip, or drift. Which is critical, because featured placements can supercharge installs, but the window is short. If you’re not watching it in real time, you miss the session-to-download goldmine.
We worked with a fitness app team who launched a small update, nothing wild, just an iOS 17 optimization and new icon. Overnight, their U.S. downloads jumped 47%. Everyone assumed it was the new creative. But when we checked AppFollow’s Featured Timeline, we saw they were quietly placed in the “Workouts at Home” collection for iPhone.
The product team didn’t know. They hadn’t prepped support. They weren’t tracking onboarding. They missed the first-time session analytics. Which meant they couldn’t fully capitalize on the user wave that followed. No feature-to-retention funnel. No localized re-targeting.
From then on, they set up alerts. They knew within hours of being featured, adjusted UA messaging, and tracked how those spikes translated into actual long-term users. Next time they were featured? Retention improved 19% in week one.
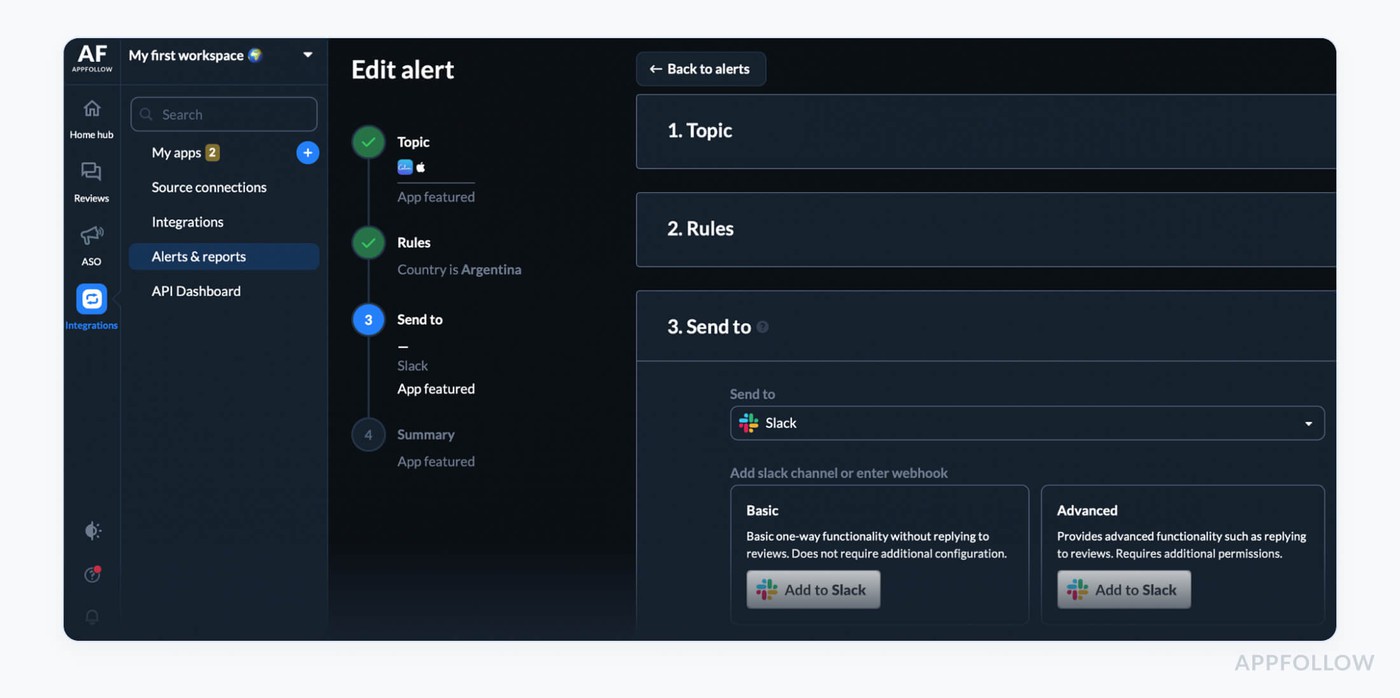
How it’s structured in AppFollow. You’ll find it under: Integrations - Alerts
Best practices:
- Check alerts daily, or set real-time Slack/email notifications during release windows.
- Benchmark: Set spike alerts at ±20% rank change in top 50 apps or priority keywords.
- If featured or spike detected, update App Store creatives and onboarding copy to align with new traffic sources or geo trends.
Discover how to automate your app analytics with AppFollow
AppFollow turns raw store data into decisions, syncing analytics with your release cadence.
Every signal maps to your mobile app lifecycle — submission to rollout.
See how users discover, convert, and complain in near real time. Priority metrics surface automatically.
Track category ranks, keyword visibility shifts, featured placements, country-level download estimates, conversion benchmarks, rating analysis, sentiment auto-tags, reply effect, and competitor discovery. For depth, add ratings velocity, review volume trends, and alert rules so no spike escapes detection.
Everything lands on the Dashboard: drill into granular review tracking, metadata compare grids, and live ASO keyword cohorts with history. Overlay updates with session curves, tie movement to revenue, and share snapshots with marketing for fast pivots.
Try AppFollow, free for 10 days across Google, Apple, and Amazon.
Sign up and start measuring your app metrics
FAQs
How do I forecast installs from a keyword win?
Use a quick proxy: Incremental installs ≈ (Δ Search Visibility for term) × (Term share of views) × (Product Page CR).
What KEI thresholds should I use to prioritize?
Rule of thumb per market: KEI ≥ 25 = defend, 15–24 = push, <15 = watchlist/experimental. Re-score monthly; revisit after metadata changes or rank jumps.
How do I size store A/B tests properly?
Aim for ≥1,000 product page views per variant, 7-day run, MDE ~10%, 80% power. Freeze during big promos. In AppFollow, tag the test window and compare CR deltas by variant.
How do I pinpoint which asset leaks conversion?
Change one element at a time (Screenshot 1 → subtitle → icon). Watch CR shift + bounce alongside Rating Distribution by version. If CR ↑ but reviews say “misleading,” revert and re-message.
How do I reconcile App Store/Play vs internal analytics?
Standardize timezone, lookback window, install definition. Compare 7/14-day trends, not single days. In AppFollow, annotate windows with App Update Timeline so teams interpret the same slice.
How do I prove “reply effect” in dollars?
Create two groups: reviews replied ≤24h vs >24h/unreplied. Measure avg. star delta, % updated, and CR change on the page for the same period. Attribute uplift to fast-reply coverage.
Which alerts should I enable by default?
- Keyword rank drop ≥5 (Top-50 terms)
- Category delta ≥10 in 72h
- CR dip ≥15% WoW
- Sentiment spike (1★ tags ×2 in 24–48h)
- Review backlog >X hours for 1–2★
Pipe to Slack + assign owners.
How do I estimate the value of a feature placement?
Baseline the prior 7–14 days by country; measure featured-window uplift and post-window decay. Count only the sustained post-window area as organic gain; the rest is visibility surge.
How do I normalize for seasonality?
Match weekday-to-weekday periods and compare YoY where possible. Exclude holiday spikes from baselines. Keep a “clean baseline” Custom Report for planning.
What’s the fastest localization sequence?
Start with title/subtitle + Screenshot 1 in top 3 locales, then short description/captions, then video. Validate with New Keyword Ranking Changes and CR by locale before scaling.
Read also
12 Best Customer Review Management Software We Love [Pros & Cons]
50 positive review response examples [+15 negative cases]
What Is Review Management: Ultimate Guide To Managing App Store Reviews
43 Examples and 10 Tips on How to Respond to Negative Reviews
Ultimate Guide to App Store Review Analysis in 2025 [5 Tools Inside]