Android App Analytics Explained by Pros: 5 Lifehacks & Tools

Table of Content:
- 5 “Why” Google Play Store analytics is vital for growing your app
- Google Play Store analytics vs App Store analytics
- 5 metrics to track in Google Play Store analytics
- What tool to use to analyze android mobile app performance
- How to turn Google Play App Analytics into strategy
- 5 mistakes of the google play analytics and how to avoid them
- The best solutions for your mobile app analytics in one platform
- FAQs on how to analyze app performance in Google Play
- Read also
You’ve launched. You’ve got installs. And now your Slack is filled with “How’s it performing?” messages from product, growth, and, of course, your CEO. You open Google Play Console… and boom. Charts, filters, zero clarity.
I’ve worked with enough high-performing mobile app teams to know the pain: you’re drowning in data but starving for direction.
This isn’t about checking your download count. It’s about mastering android app analytics, understanding what users are doing before they install, why they drop off after, and how your store listing conversion, retention, and search term performance are silently shaping your success.
In this guide, I’ll break down the specifics of Google Play Store analytics, the 5 core metrics every marketer should obsess over, how to turn them into strategy, and the exact tools and platforms that’ll save you time and drive revenue.
Let’s cut through the noise, and make your app analytics work for you.
5 “Why” Google Play Store analytics is vital for growing your app
So instead of giving you more generic industry stats, I asked someone who lives and breathes this space.
Karen is a customer growth team lead at AppFollow. She’s helped mobile apps across industries, from meditation to music streaming, use Google Play Store analytics to fuel smarter decisions, faster iterations, and scalable growth.
In this interview, she breaks down the real reasons why analytics matter and how you can turn insights into action that moves the needle.
Me: Helen, I’m so glad we’re having this convo today because let’s be honest, mobile app marketers and product owners are swimming in data, but when it comes to Google Play Store analytics, they’re often staring at dashboards thinking: “Cool chart. Now what?”
So, let’s cut through the noise. Can you tell me why Google Play Store analytics should be at the heart of an app growth strategy, not just a check-the-box exercise?
BENEFIT 1: Visibility into What Drives Conversion (and What Doesn't)
Karen: Absolutely, Me. Most folks look at installs and ratings as vanity metrics. But what they should be digging into are things like:
- Store Listing Conversion Rate
- First-time Install Volume per Traffic Source
- Keyword-driven downloads
- Rating velocity
- Rating distribution changes after each release
Let’s talk about Komorebi, a mobile mindfulness app. They were doing well in Japan and Brazil but had hit a growth ceiling. After analyzing store listing data and running A/B tests on screenshots and the icon, they localized key visuals and metadata.
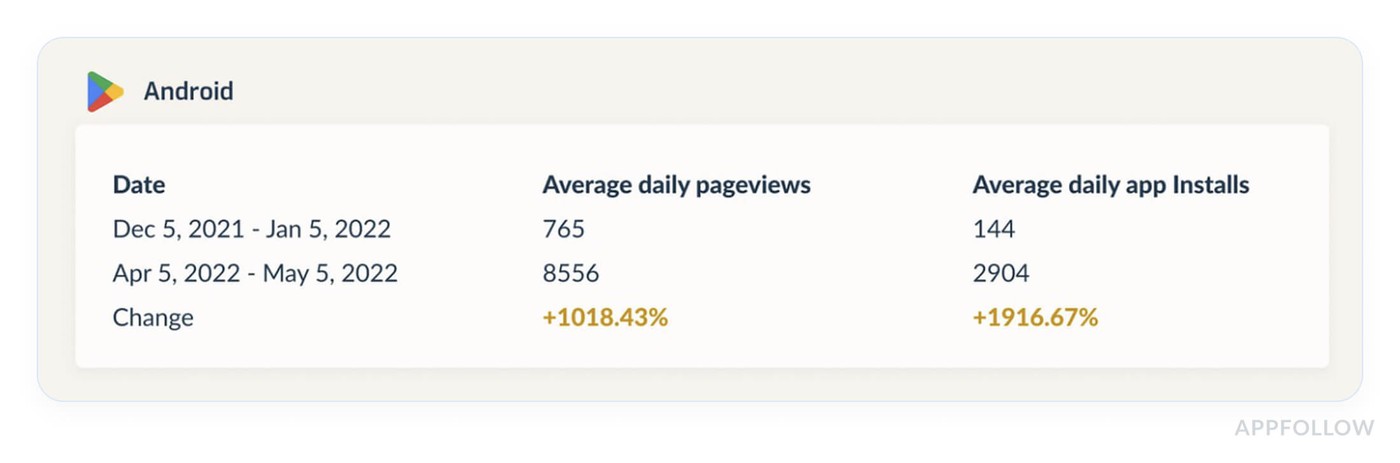
Result? They saw a 33% conversion rate increase and tripled their installs in 2 months.
That’s the power of visual and metadata testing backed by Google Play Store analytics.
BENEFIT 2: Correlating Ratings with Feature Releases and Crashes
Me: Yes! And you just touched on something mobile app teams constantly face, the unknown backlash. You push a release, and ratings tank, but no one knows why.
Karen: Exactly. You need to stop looking at ratings in isolation.
Take Hepsiburada, a massive eCommerce app in Turkey. Their product team used analytics to track how user reviews responded to new releases. They noticed a consistent drop in ratings after certain Android version updates. By investigating version-level data and user feedback, they uncovered a payment issue that affected Android users.
Once resolved, their average rating jumped from 3.6 to 4.4, and they returned to the Top 10 Shopping apps on Google Play.
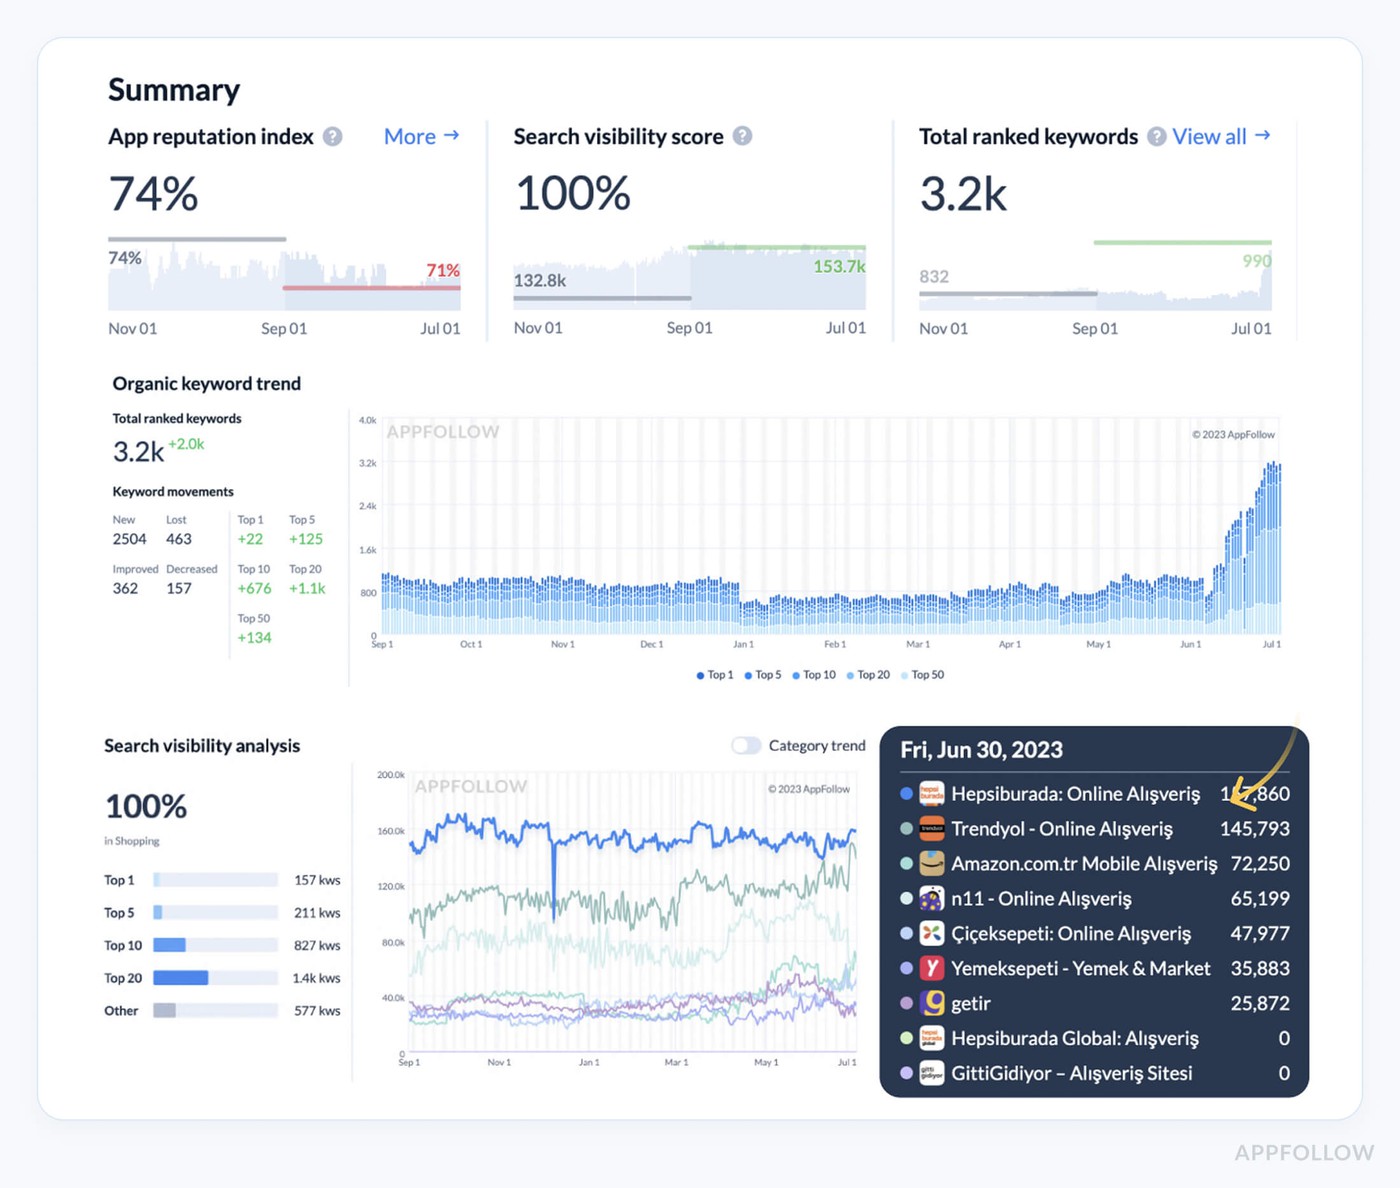
Google Play Store analytics can uncover what’s breaking your user experience, before your customers churn.
BENEFIT 3: Keyword-Level Data That Drives Organic Growth
Me: Let’s get into ASO. Everyone talks about keyword optimization, but without tracking it, it’s just guesswork.
Karen: Exactly. Google Play Store analytics gives you the data you need to pinpoint what’s working and what’s a dead end.
Audiomack, a music app, used keyword metrics to identify top-performing search terms. Just 10 keywords drove 60% of their organic installs. Once they knew that, they optimized around those keywords and cleaned up their metadata.
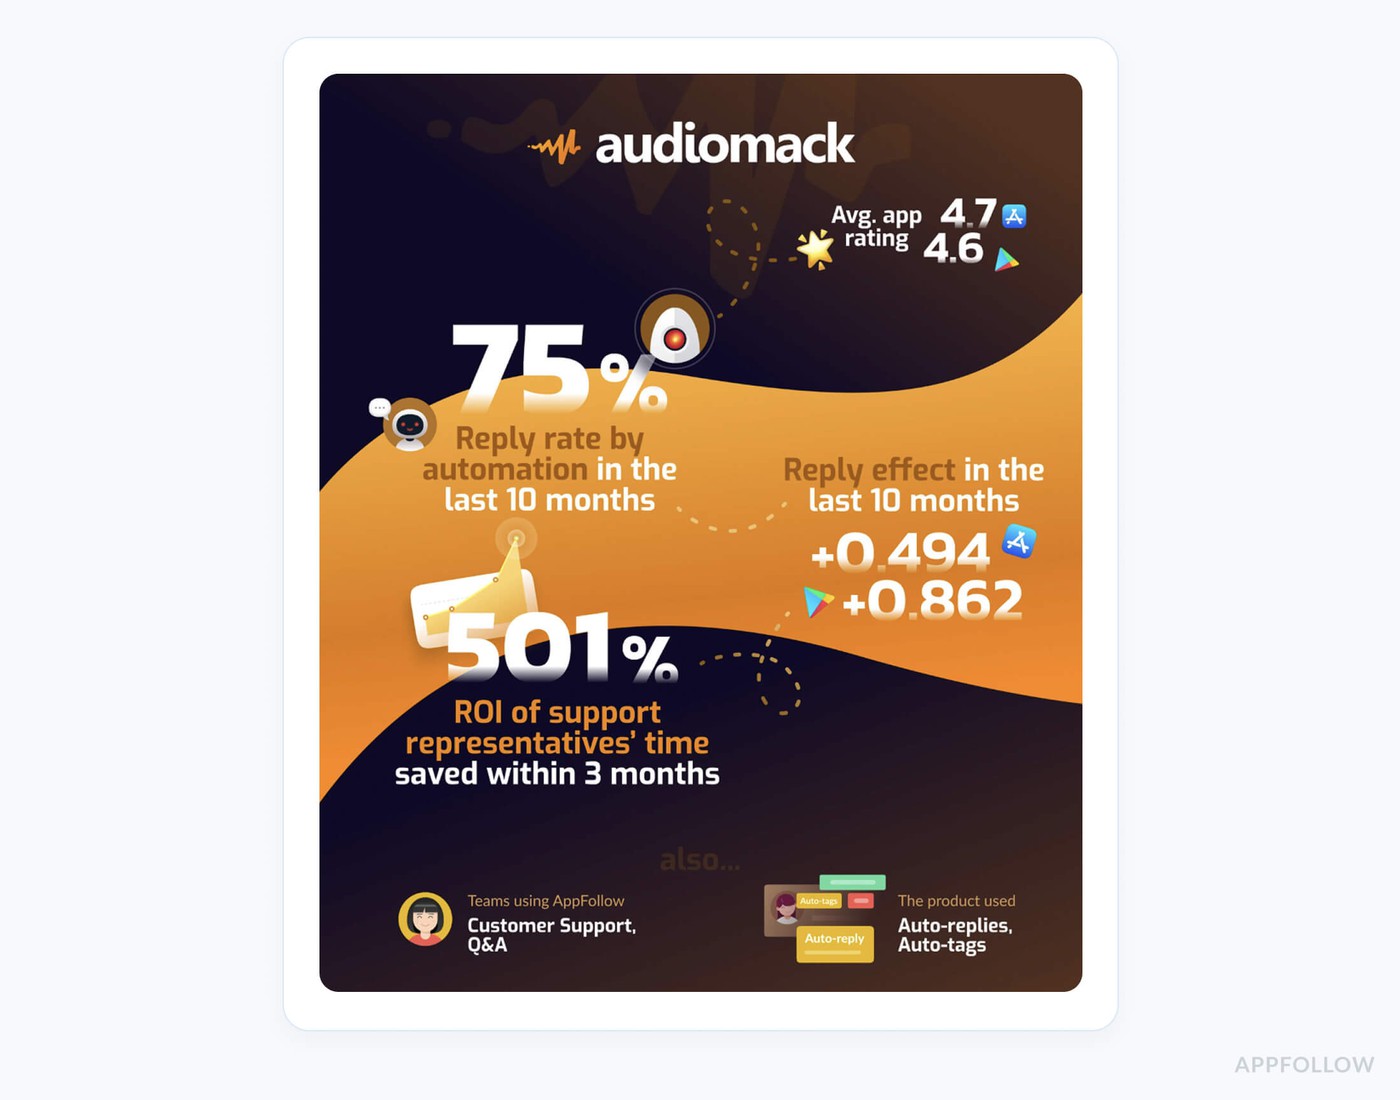
With review automation and store optimization combined, they achieved a 501% ROI on their efforts.
If you’re not aligning keyword data with install trends, you’re wasting time and losing users to competitors.
BENEFIT 4: Understanding User Sentiment at Scale Without Manual Guesswork
Me: Now let’s talk reviews. Most teams treat it as noise, but there’s gold in there.
Karen: True. But only if you tag and filter correctly.
Huuuge Games, a global game publisher, had this issue. Their customer support team couldn’t keep up with high review volumes. They started tagging reviews by topic, bugs, ads, pricing, and by region.
That’s how they spotted a UI problem right after rollout that mainly affected LATAM users. They reverted the update quickly and avoided a bigger ratings hit.
That’s the power of structured user feedback via review analytics, especially for large-scale mobile apps.
BENEFIT 5: Aligning Marketing Spend with Actual Outcomes, Not Guesses
Me: This one hits hard. I’ve seen mobile app teams pour thousands into UA campaigns… but with no real visibility into what converts.
Karen: Exactly, and that’s why Google Play Store analytics needs to be integrated into marketing ops.
Take Scoot, a mobility app. They used analytics to compare paid and organic traffic performance. They discovered their branded keyword traffic converted significantly better than paid campaigns.
By reallocating budget and optimizing store listings based on user behavior, they dropped CAC by 20% and increased MAUs by 15% in just 6 weeks.
Campaigns without data-backed decisions waste money and miss your best customers.
BENEFIT 6: A Feedback Loop for Product and Growth Teams
Me: Let’s wrap on this, how can product, growth, and marketing sync better?
Karen: By using the same Google Play Store analytics dashboard as a feedback loop.
You track:
- Ratings over time and per version
- Keyword installs
- Store listing conversion experiments
- Review sentiment tags
- Bugs reported in user feedback
When this data is shared across teams, you don’t just fix bugs, you prioritize the ones killing your growth. That’s how teams become customer-led and mobile app growth becomes systematic, not reactive.
Now that you’ve seen how Google Play Store analytics can drive real growth, it’s time to look at how they stack up against App Store analytics.
Google Play Store analytics vs App Store analytics
You know that feeling when you’re deep in a launch campaign, juggling UA creatives, reviewing conversion trends, and someone from the product team casually asks, “Can we get insights from the app store analytics to inform this?” And you’re like… which store are we talking about?
Because if it’s Google Play Analytics, buckle up. It’s a completely different playground than Apple’s App Store.
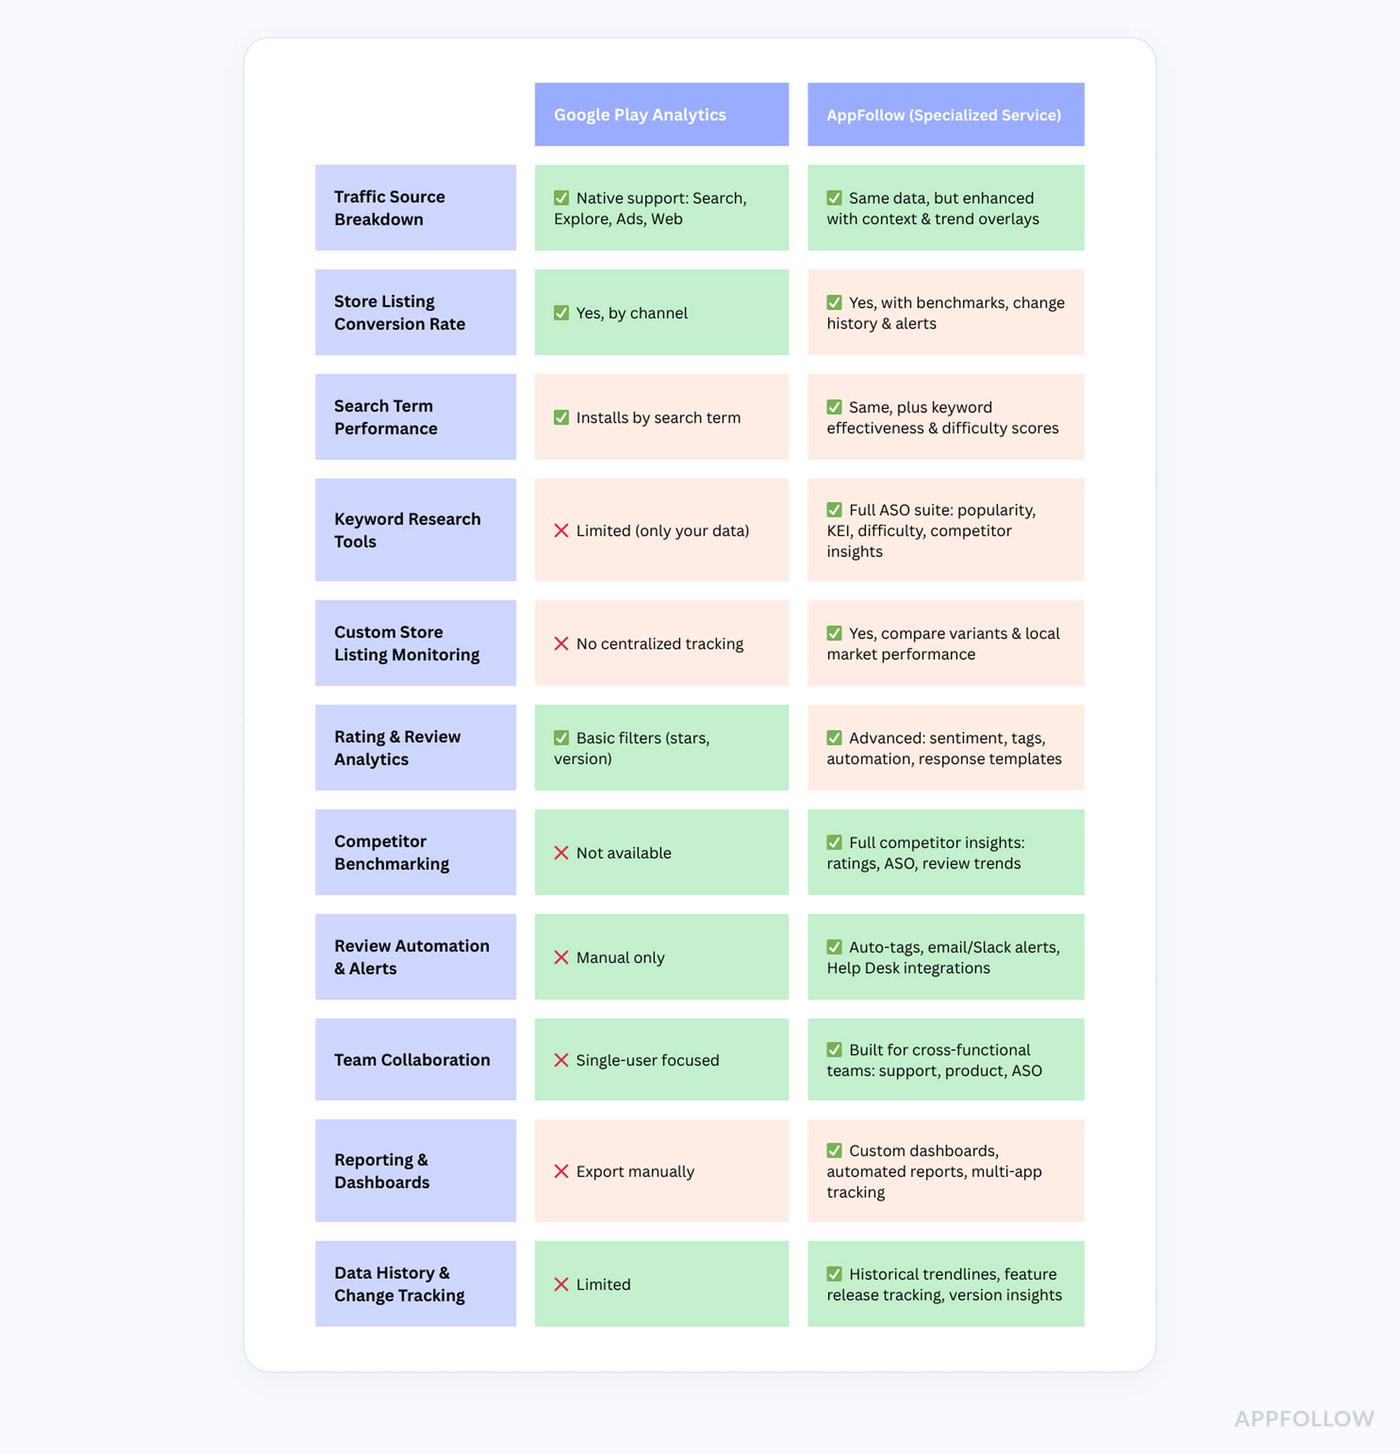
Here is a quick comparison table:
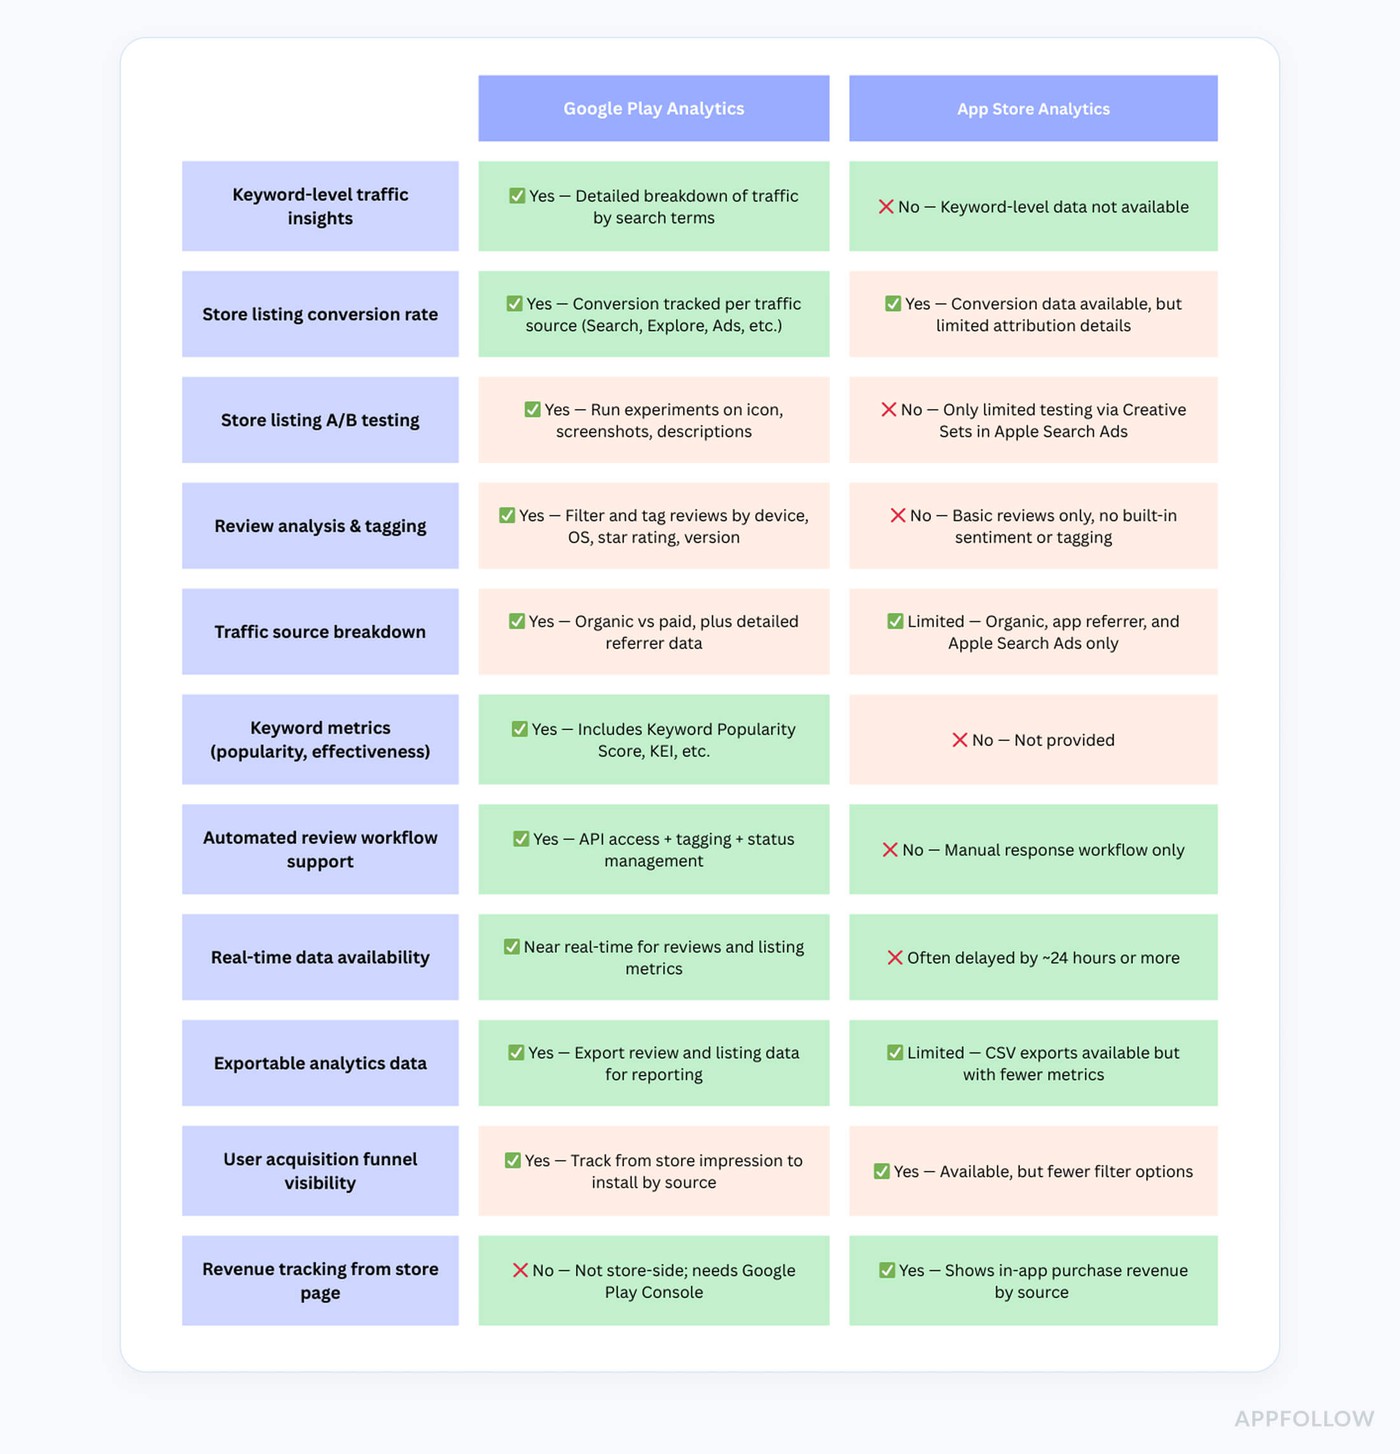
Let’s just say this: Apple gives you the “polished highlight reel” of your mobile app performance. You’ll see page views, impressions, downloads, and a sprinkle of attribution. But you won’t know which keywords brought in new users. And tracking review trends or user sentiment across versions? Not happening.
Now enter Google Play Analytics, and it's like switching from a blurry snapshot to a high-resolution dashboard, full of user behavior data, rich breakdowns, and actual insight that drives growth.
Let’s get specific.
With Google Play, you can:
- Track keyword-level traffic, see exactly which search queries brought users to your app.
- Monitor conversion rates by traffic source: Google Ads, organic search, Explore traffic, or third-party referrals.
- Launch store listing experiments to A/B test screenshots, icons, and descriptions with statistically significant data.
- Create custom store listings per country or install status (think: tailored onboarding for new customers vs returning users).
- Dive into reviews analytics, filtering by app version, device, OS, star rating, or even tags like “slow” or “bug.”
Apple...none of that.
Say your product team ships a new update and ratings suddenly drop. On iOS, you get a vague trend. On Google Play? You see that Android 13 devices had a spike in 1-star reviews mentioning “payment crash.” That’s a fix you can push today.
Or imagine your mobile app conversion rate drops. On the App Store, you’re guessing if it’s your new icon. On Google Play, analytics show your Explore traffic plummeted after a metadata tweak, and the A/B test confirms your new screenshots underperformed in Brazil. You iterate. Fast.
The irony - Google provides more analytics power, but many teams don’t use it. They ignore store listing experiments. They don’t segment user reviews. They run the same creatives globally. That’s like driving a Ferrari in first gear.
If you want your mobile app to grow efficiently, Google Play Analytics isn't optional, it’s foundational. It bridges marketing, product, and support. It gives customers a better experience because you’re not guessing. You’re adapting in real time.
And when your entire team speaks the same data-driven language? That's when growth compounds.
So yeah, same "storefront" concept, but Google Play and App Store analytics are two entirely different games. And if you’re working on Android? You’ve got the sharper toolset. Use it.
cta_get_started_yellow
5 metrics to track in Google Play Store analytics
If you’ve ever opened a dashboard in android app analytics and thought, “Cool, I have all this data… but now what?”, you’re not alone.
After working with hundreds of high-growth mobile app teams, I can tell you this with confidence: the most successful apps don’t look at everything. They look at the right things. And at AppFollow, the customers who grow fastest are laser-focused on a small handful of high-impact app analytics metrics that move the needle.
So if you're ready to stop guessing and start making smarter, faster, more profitable decisions, these are the top 5 metrics I recommend to every mobile marketer and product lead track. Every week. No excuses.
1. Store Listing Conversion Rate (by Traffic Source)
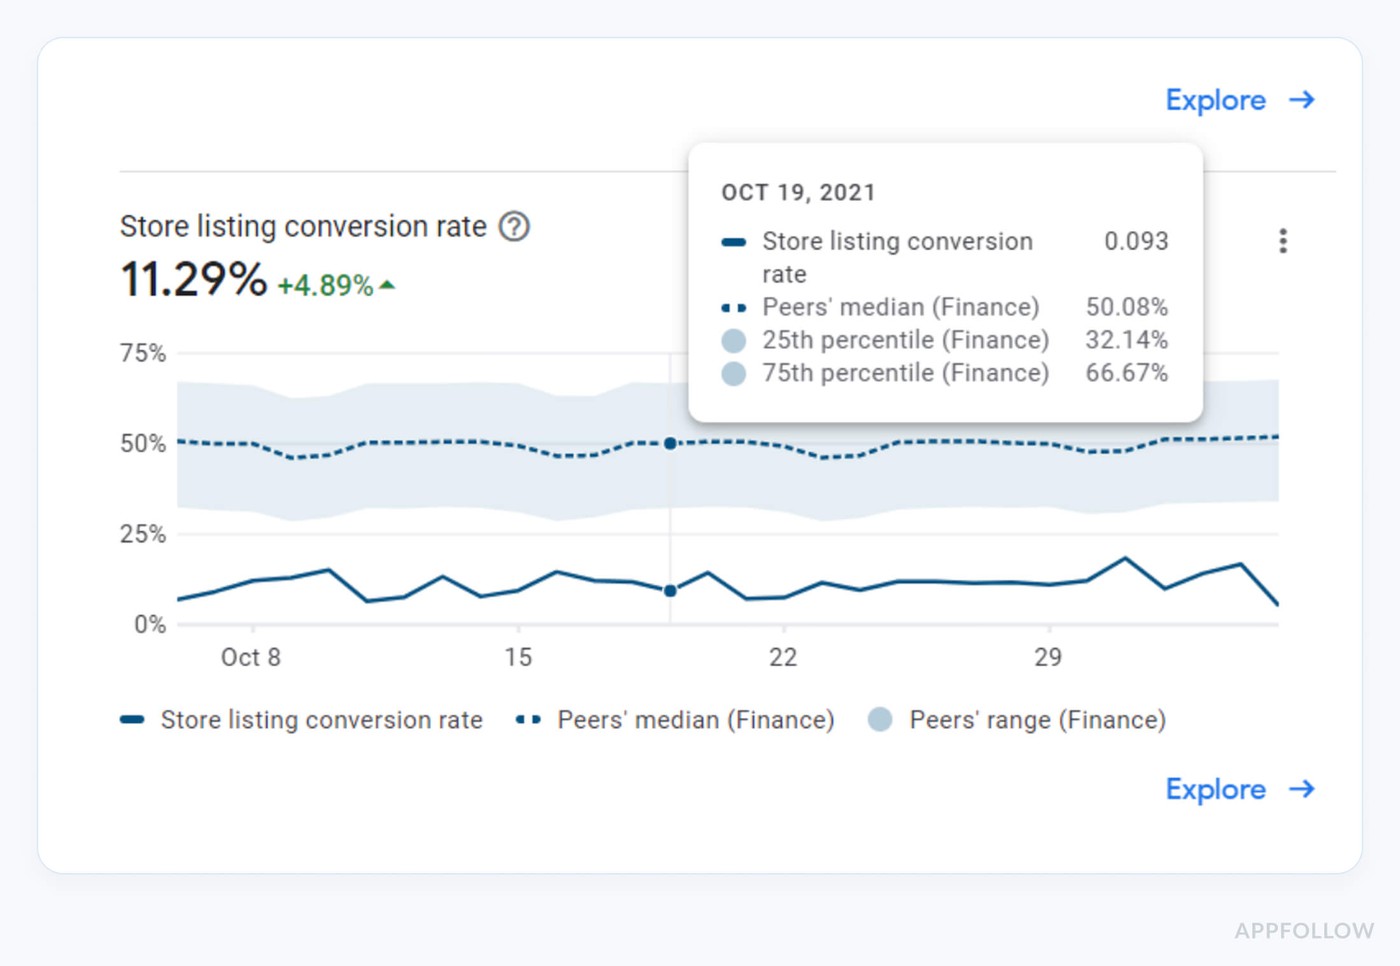
This metric reveals how well your Google Play Store page converts visits into installs, segmented by traffic sources like Search, Explore, Ads, or third-party web referrals.
If your paid users convert at 1.2% and organic users convert at 6.5%, you don’t just have a marketing problem, you’ve got a product–message mismatch. Smart teams run A/B tests, update visuals, and localize copy based on this exact data. That’s how you improve both acquisition and retention, with precision.
2. Installs by Search Term
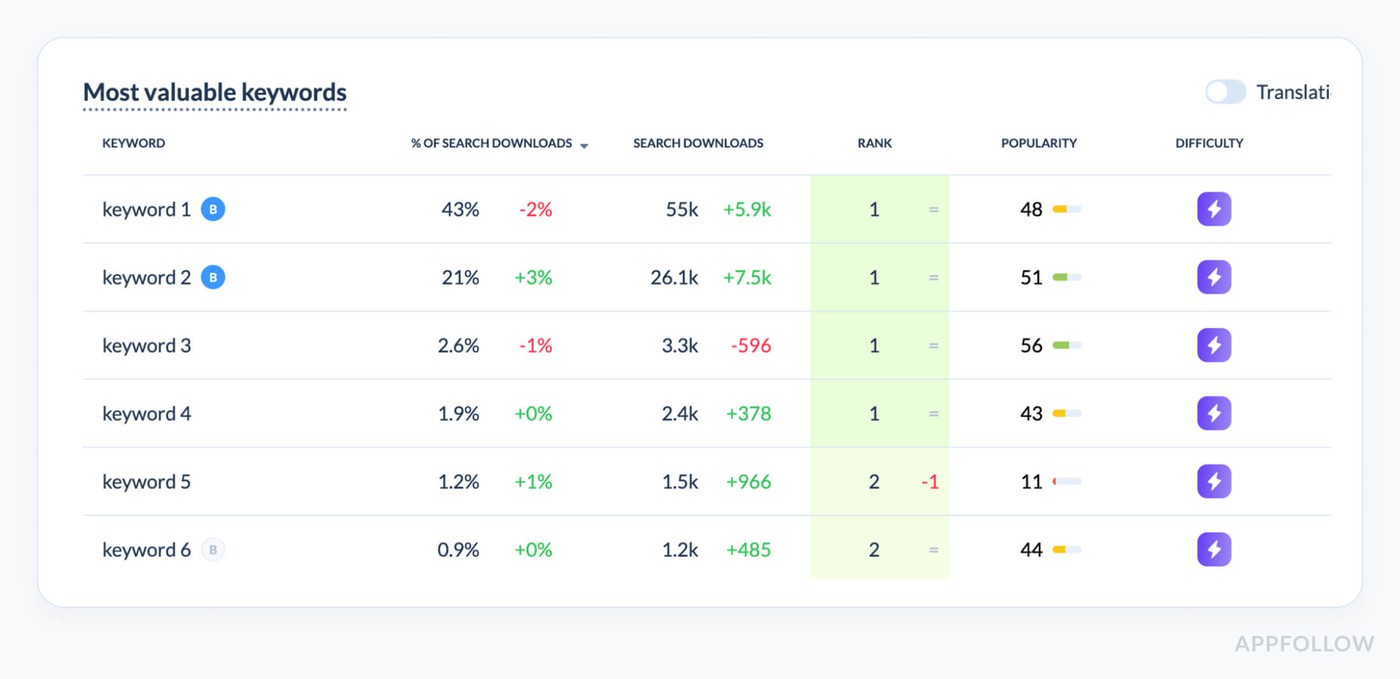
This is an element of the AppFollow dashboard. Test how it works for free.
This is where Google Play’s android app analytics outshine Apple’s, hands down. It shows you which search terms are bringing in installs. No guesses. Not impressions. Real install behavior from real users.
This metric fuels your ASO strategy. One client shifted their keyword focus after discovering that 70% of their installs came from just three mid-volume terms. After optimizing around them, their organic installs grew 38% in under a month, without spending an extra cent on ads.
3. Store Listing Experiments (A/B Testing)
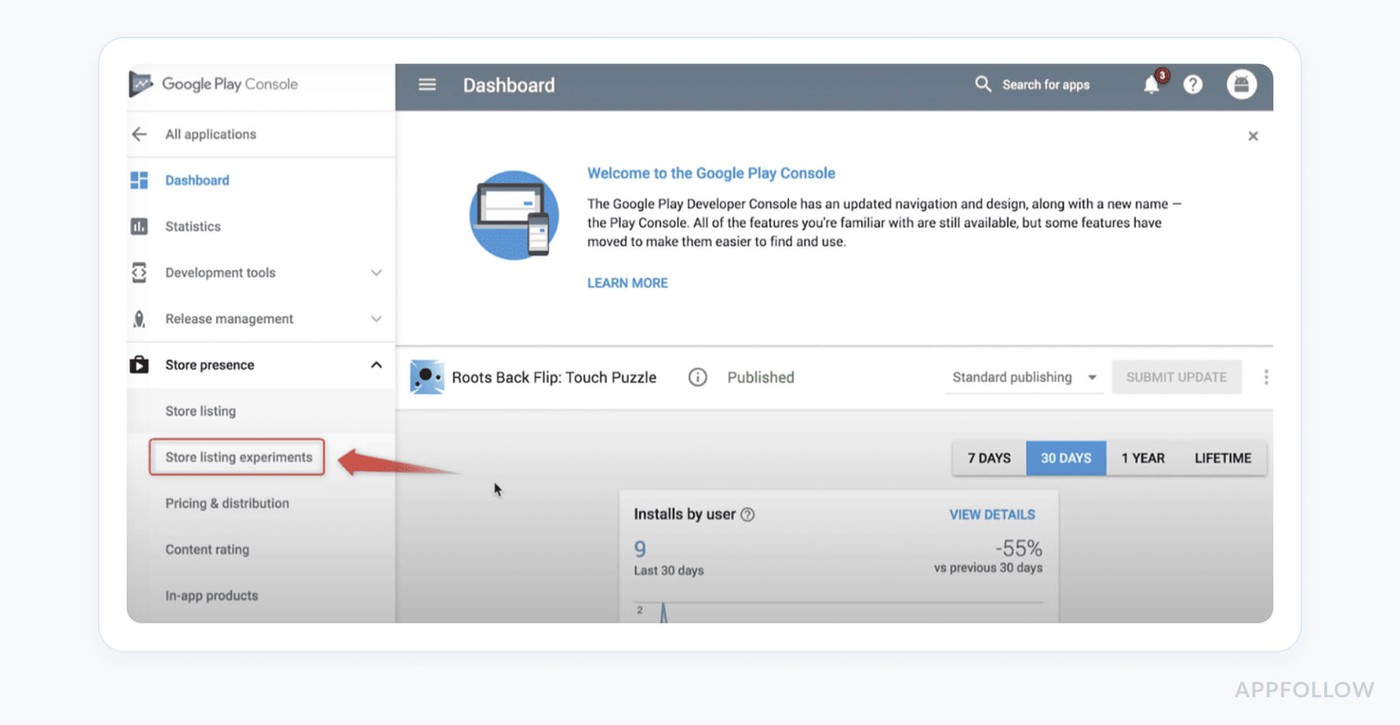
Google Play lets you run true A/B tests on your store listing assets, like your icon, screenshots, short description, using live user traffic. It’s built-in mobile app analytics magic.
Test region-specific creative. What converts in Europe may flop in LATAM. We once ran a three-way A/B test for a shopping app, and localized visuals in Mexico outperformed the default English set by 26%. That’s not creative guesswork, that’s business impact driven by smart information.
4. Retained Installers (Day 30)
Installs without retention - a leaky bucket. This metric shows how many of your new users still have the app installed 30 days later, and where they came from.
If you're seeing a 70% uninstall rate from paid web traffic, chances are your ad and store listing are overpromising what your product delivers. This is where mobile app analytics and customer alignment meet. Fixing your store messaging based on retention data often beats any performance tweak.
5. Ratings & Reviews by App Version
This metric lets you track how users rate your app by version, so you can tie feedback directly to a specific update, bug, or UX change.
Use analytics to tag recurring review themes like “crash” or “battery drain.” We helped a fintech mobile app spot a pattern of 1-star reviews from Galaxy users post-update. That pinpointed a device-specific bug no one had flagged in QA, saving time, reputation, and revenue.
More Metrics Coming Soon…
These 5 are just the beginning. In the full article, I’ll walk you through even deeper app analytics that serious growth teams rely on, including:
- Keyword Effectiveness Index (KEI)
- Custom Store Listings
- Funnel breakdowns by geography and OS
- Review response workflows
- Pre-registration data
- And how to use mobile app analytics to align marketing, product, and CX for serious ROI
Because in a world overflowing with analytics, it’s not about having more information, it’s about knowing what matters for your business and your users, and using it in real time.
Ok, but how to track these metrics?
What tool to use to analyze android mobile app performance
You know that moment when someone on the team drops, “Why did our install rate drop 18% last week in India?” and suddenly your whole Monday becomes a search mission through every analytics panel ever created?
Been there. And here’s the thing: if you’re only using Google Play Analytics, you're not getting the full picture of your mobile app’s performance.
Now don’t get me wrong, Google Play Analytics is essential. It gives you native visibility into your store listing’s performance. You can see:
- Conversion rates by traffic source
- Which users came from Search, Explore, or Ads
- Installs by search term
- Review volume and star ratings by app version
- Basic user retention and uninstall data
And that’s great, for quick reads and high-level analytics. But when your marketing, support, and product teams need to collaborate on real decisions, you need more depth. That’s why I always pair it with a specialized app analytics tool like AppFollow.
With AppFollow, you can:
- Tag and filter reviews based on what users are saying (like “bug,” “crash,” or “pricing”)
- Compare our mobile app performance against direct competitors
- Export and share unified reports for cross-functional teams
- Align messaging, features, and user sentiment, all in one place
Check how it works for free with a 10-day trial
Think of it like this: Google Play Analytics gives you the raw data, AppFollow gives you the insights that drive decisions. And in this business, knowing what’s happening is good, but knowing why it’s happening is what keeps your customers coming back.
Because when you're managing apps at scale, you need more than numbers, you need clarity.
How to turn Google Play App Analytics into strategy
Okay. Let me set the scene.
Your mobile app is live. The team’s hyped. Marketing did their thing. Product crushed the roadmap. You're finally seeing traction, some installs, a few reviews, maybe even a couple of five stars.
And then it happens.
Someone says, “Hey, can we look at the analytics to see what’s working?”
You open the Google Play Console and boom, charts, filters, tabs. You’ve got installs by source, conversion rates, retention curves, even search term data. But what do you do with it?
Because here’s what I see all the time, teams have data, but no direction. You’re not running an android analytics app startup for fun. You’re here to grow, retain users, and turn that traction into actual business results.
So let me walk you through how I coach clients, from indie apps to scale-ups, on how to translate app analytics into strategic action.
Low Conversion Rate? That’s a Messaging Mismatch
If your store listing is converting under 5%, we’ve got a problem. It means users are seeing your app but not installing it.
Here’s where mobile app analytics kicks in. First, segment conversion rates by traffic source, Google Ads, Search, Explore, or web referral. Then compare countries. You might find that traffic from Brazil converts twice as much as from France.
That’s not just a visual issue, it’s a positioning one.
One of my customers, a finance app, promoted “AI-powered budget tracking” in their ads, but the store description led with generic copy like “manage your money better.” We realigned the value prop across the store listing, and paid conversion jumped by 3.8%.
Users Are Installing, But They’re Not Sticking
You’ve got installs, but your Day 1 or Day 7 retained user numbers are flatlining. Why? Because what your store promises doesn’t match what your product delivers, or your onboarding experience isn’t landing.
In mobile app analytics, go to Retained Installers and filter by acquisition source. Paid users might churn faster than organic ones. Then break it down by geography. Are certain markets sticking better?
For one journaling app, we noticed that web referral traffic had a 9% Day 7 retention rate, while Search installs held at 22%. That told us we were attracting the wrong audience through PR and content campaigns. We realigned the channel strategy, and retention improved across the board.
You're Only Ranking for Your Brand Name
You pull up “Installs by Search Term” in the Console, and it’s 90% brand. That means you’re visible only to people already looking for you. Not great.
What your android analytics app should help you spot are non-branded keywords that convert, then double down.
For a meditation app, “sleep sounds” was converting better than their branded name. We re-optimized the title, short description, and screenshots with that exact intent in mind. Result? +34% organic installs in 14 days. That’s what I call using information strategically.
Ratings Are Dropping After a New Version
Your users are trying to tell you something. And it’s probably not a “great job.”
If your app rating takes a dive after a release, go straight to Ratings & Reviews → Filter by App Version. This is where mobile app analytics and product meet. You’ll start spotting patterns, device-specific crashes, UI changes that backfired, or bugs no one caught in QA.
I had a customer, a food delivery app, get 12 1-star reviews in two days, all from Samsung Galaxy S22 users. The login screen froze after a backend tweak. Without version-filtered reviews, they wouldn’t have caught it. We pushed a patch, replied to every review, and recovered their rating from 3.7 to 4.2 within a week.
One Country Is Outperforming the Rest
Sometimes your goldmine is hidden in plain sight. You just need to look beyond global averages.
Let’s say your analytics shows Brazil has double the install rate and 20% higher retention than the US. Don’t celebrate, invest. Build a custom store listing just for Brazil. Localize the visuals. Translate the short description. Make your icon pop for that market.
That’s exactly what one fitness mobile app client did, and turned Brazil into their #1 revenue market in under 2 months.
Smart teams don’t just localize when they go global. They localize when the data tells them to.
Every app analytics dashboard gives you one thing: possibility.
But your growth comes from action. From prioritizing what matters. From aligning your product, marketing, and support teams around the right signals.
Use your mobile app analytics tools, Google Play, AppFollow, or any android analytics app, to:
- See what your users do (and don’t do)
- Spot opportunities early
- Stop the bleeding before it’s public
- Double down where you’re already winning
- Build a better business one data point at a time
Because let’s be real: anyone can check their analytics. But the teams who grow?
They read between the numbers.
5 mistakes of the google play analytics and how to avoid them
You finally launch your mobile app. Installs are rolling in. You’ve got a solid product, the creatives look great, and you’re checking your app analytics dashboard every morning like it’s stock market news.
But then someone on your growth team asks the million-dollar question: “Cool. But what’s driving the installs? And why aren’t we retaining users past Day 1?”
You stare at the Google Play Console screen, pages of charts, data, user flow graphs, search term clouds, and think: what do I even do with this?
That’s when I pull in my team. Because these are the 5 mistakes we see again and again when teams look at Google Play analytics, and how we advice to fix them.
Mistake 1: Tracking Installs Without Measuring Conversion
“You’re not growing if you don’t know how many people said no.”, Lucija Knezic, Customer Success & Product Strategy Manager
One of the biggest issues? Teams love talking install volume, but totally skip store listing conversion rate. If 10,000 people visit your listing and only 300 install, you’re leaking users you already paid to attract.
“Before we scale traffic, I always look at conversion by source, Search, Ads, Explore, Web. Then I literally click through the store listing to see what they’re seeing. Are the visuals aligned with the traffic intent? Does the short description match what our ad promised? That’s where most of the drop-off hides.”, Lucija Knezic, Customer Success & Product Strategy Manager
Fix it:
- Go to Store Performance → Conversion Rate
- Segment by source
- Match store assets to user intent
We helped one android analytics app improve their paid conversion by 4.2% just by aligning ad headlines with the Play Store's first screenshot.
Mistake 2: Focusing on Impressions, Not Install Intent
“Impressions are just digital window shoppers. I want the ones who walk in and buy.” Dzianis Shalkou, CRO & Market Analysis
Visibility’s great. But app store success comes from keywords that convert, not just keywords that show up.
Dzianis’s method:
- Use the “Installs by Search Term” report
- Find high-converting non-branded keywords
- Rebuild metadata around those phrases
- Mirror the same intent in visuals (especially first screenshot and short description)
For one mobile app focused on wellness, “gratitude journal” had double the install rate of “daily planner,” despite lower impressions. Updating metadata and creatives accordingly boosted organic installs by 34% in 3 weeks.
Mistake 3: Thinking Retention Is a Product Problem Only
“If your Day 1 retention sucks, maybe your Play Store promised the wrong thing.”, Andressa Mendes, Customer Support Associate at AppFollow
We talk a lot about retention in terms of push, onboarding, or feature depth. But honestly? If your mobile app analytics show people bouncing in hours, you might’ve just misled them.
“When I see a retention cliff, I go straight to the acquisition source. Are Search users sticking longer than paid? Then I’ll check what messaging they saw on the way in, ad copy, short description, screenshots. If the app says one thing and the store says another, of course they uninstall.”, Andressa Mendes, Customer Support Associate at AppFollow
We had a journaling app promising AI-based daily prompts… but that feature was hidden in a menu. Sam rewrote the short description, repositioned the screenshots, and Day 7 retention increased from 11% to 23%.
Mistake 4: Responding to Ratings Without Analyzing Them
“Ratings are the symptom. Reviews are the diagnosis.”, Anatoly Sharifulin, CEO & Co-founder at AppFollow
Here’s what most teams do: They see a drop in average rating and scramble to reply with “Sorry you had a bad experience.”
“Filter reviews by app version and tag them by themes, crashes, ads, payment, whatever. If five 1-star reviews mention ‘freeze’ within 24 hours of a new release, that’s a signal.”, Anatoly Sharifulin, CEO & Co-founder at AppFollow
For one mobile app, we noticed a sudden spike in 1-star reviews from Samsung Galaxy users using Android 13. Keywords included “slow,” “freeze,” and “battery.” We escalated it to the product team within hours, and they pushed a hotfix in under 48 hours.
Pro stack:
- AppFollow + Google Play Console
- Tag reviews: “ads,” “bugs,” “UI,” “login,” etc.
- Set alerts on tag spikes
- Monitor app version sentiment over time
This is how review data turns into real business decisions.
Mistake 5: Ignoring Geographic Patterns
You’ve got a global launch. But your analytics show wildly different performance by region.
“We had one android analytics app converting at 12% in the Philippines, with no localization. That’s not luck, that’s potential. I built a custom store listing, adjusted the visuals to match local UX expectations, and rewrote the description with the language nuance that converts. Installs doubled. Just from looking deeper.”, Yaroslav Rudnitskiy, ASO Expert in AppFollow
What to segment in Google Play analytics:
- Conversion rate by country
- Retention by region
- Review volume and sentiment by market
- Keyword performance per locale
Smart teams use mobile app analytics not just to optimize globally, but to scale locally.
Anyone can track app analytics. But real growth happens when you connect:
- What the user saw
- What the data says
- What your product delivers
- And what your customers expected
When your team understands how to pull actionable insights from information, tie it to retention, and react in real time?
That’s when your apps stop coasting and start climbing.
“Your analytics aren’t just reports. They’re strategy sessions waiting to happen.”, Me, every Monday standup
The best solutions for your mobile app analytics in one platform
Whether you're on Google Play, the Apple App Store, or Amazon, AppFollow is the ultimate android analytics app and multi-store solution to help your teams turn app store data into decisions that drive revenue.
It’s the trusted platform behind growth for mobile brands like Opera, Discord, Gameloft, and BetterMe. They use it for app rating growth, app review & reputation management, ASO.
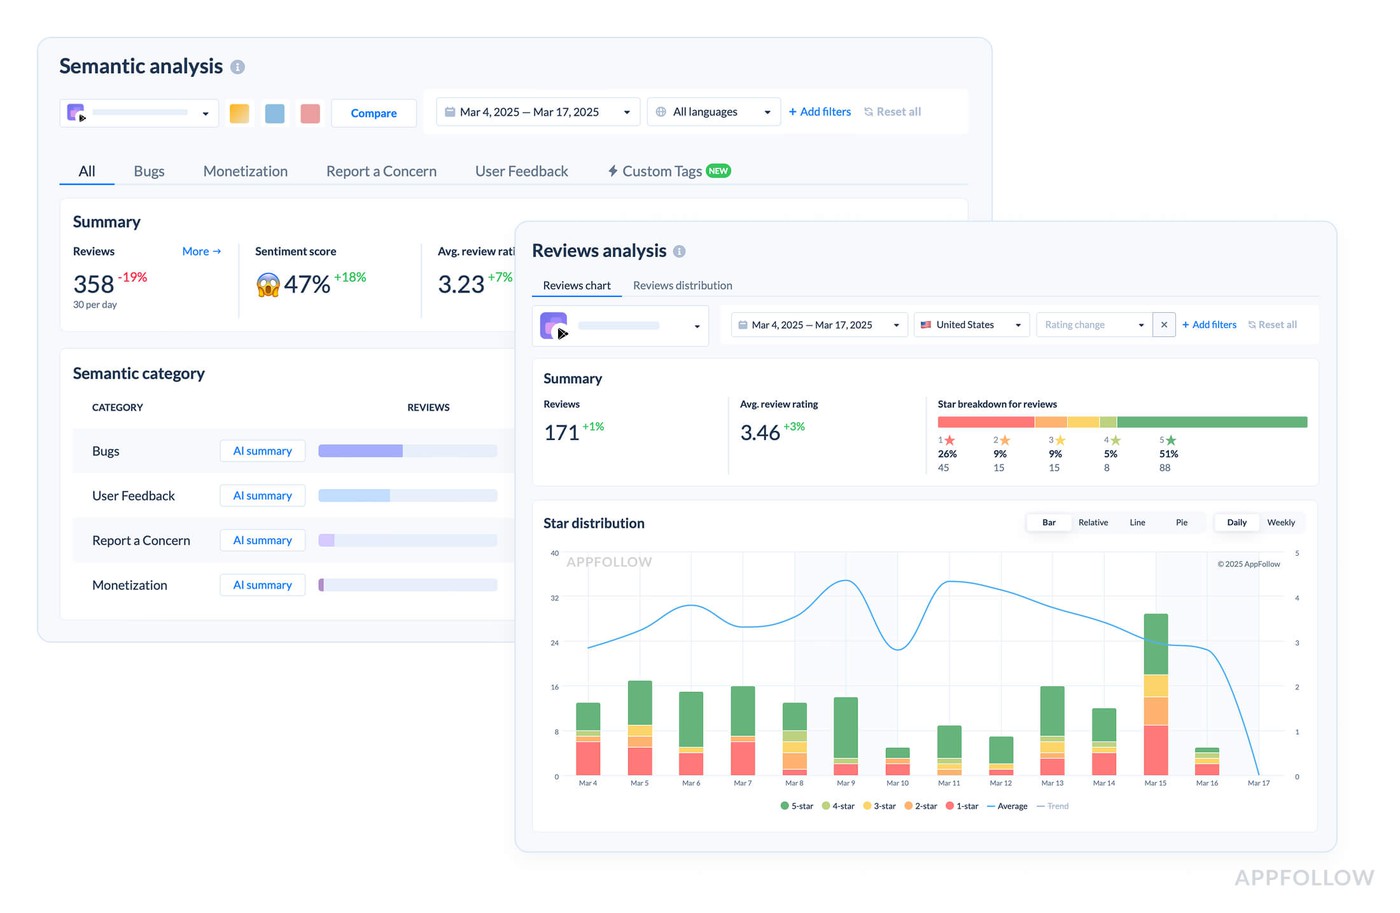
AppFollow helps users, marketers, and product managers do the real work, tracking performance, improving visibility, and responding to customers faster, all in one place.
What makes it work:
- Centralized mobile app reviews management
- Channel-based conversion insights
- Actionable ASO metrics and keyword strategies
- Review tagging, auto-replies, and customer sentiment alerts
- Competitive benchmarks and keyword gap resources
- Integrations across Slack, Help Desk, email, and more
Try AppFollow free for 10 days and see how your product grows when you give your teams the right tools.
FAQs on how to analyze app performance in Google Play
What is the analytics app in Android?
It’s any platform that helps teams track how a mobile app performs, from installs and user retention to in-store behavior and keyword visibility. It gives you the data to understand your product, your users, and your growth.
How to see app analytics?
Use tools like Google Play Console or specialized services like AppFollow. They show you real-time insights into downloads, conversions, reviews, and more, everything your mobile growth team needs to make smart decisions and increase revenue.
How do I check app stats on Android?
Head to Google Play Console. It’s your first-party dashboard where you can track user acquisition, retention, and feedback. Want deeper resources? Connect it to platforms that combine review tracking, ASO, and competitor insights in one workspace.
Can you use Google Analytics for an app?
Yes, but it’s more for in-app behavior. To truly grow a mobile app, you’ll need both internal event data and external store analytics to understand how customers discover and engage with your product before install. That’s the growth stack that really works.
Read also
- 5 Secrets of Reputation Automation in 2025: Best Tools & Tactics
- Online Review Management Reputation Software: 15 Tools Review
- Mastering Reputation Management: Strategies, Tools, and Insights to Boost Your Brand
- Small Business Reputation Management: Expert Guide for Your App
- Top 14 Online Reputation Management Tips For Your App in 2025