

Mobile App Analytics
Table of Content:
- What is mobile app analytics?
- App analytics meaning
- What mobile app analytics measures
- Key mobile app analytics metrics
- Where mobile app analytics data comes from
- Mobile app analytics tool categories
- Mobile app analytics vs. web analytics
- How AppFollow contributes to mobile app analytics
- When app teams use mobile app analytics
- Frequently asked questions
- Related glossary terms
Mobile app analytics is the process of collecting and analyzing data from iOS and Android apps to understand how users find, use, pay for and experience an app. Also called app analytics, it covers acquisition, engagement, monetization and performance data across the App Store, Google Play and the app itself.
What is mobile app analytics?
Mobile app analytics is the discipline app teams use to turn app data into product, marketing and revenue decisions. It shows where users come from, what they do after install, where they drop off, how much revenue they generate and whether technical issues affect the experience.
Unlike web analytics, which usually tracks browser sessions, page views and referrers, mobile app analytics depends on app-specific data sources: SDK events, App Store Connect, Google Play Console, attribution platforms, crash tools and store-side analytics tools.
In practice, no single platform covers the full picture. A complete mobile app analytics setup usually combines several layers of data.
App analytics meaning
In a mobile context, app analytics means the data, tools and workflows used to measure app discovery, user behavior, retention, monetization and technical performance.
A simple way to understand the app analytics meaning:
| Term | Meaning |
|---|---|
| App analytics | Data about how people discover, use and experience an app |
| Mobile app analytics | App analytics for iOS and Android apps specifically |
| Product analytics | In-app behavior, events, funnels and retention |
| Store-side analytics | App Store and Google Play visibility, reviews, ratings, rankings and conversion |
| Attribution analytics | Which channels, campaigns or sources drive installs and post-install events |
What mobile app analytics measures
Mobile app analytics usually measures four data layers: acquisition, engagement, monetization and performance. Together, these layers show the full app journey from first discovery to long-term value.
Acquisition data
Acquisition data explains how users find and install the app. It can include impressions, product page views, installs, install source, campaign performance, CPI, CAC, App Store search, Google Play search, referrals, Apple Search Ads and paid campaign attribution.
This layer helps teams answer: where do our users come from, and which sources drive valuable installs?
Engagement data
Engagement data shows what users do inside the app after install. It includes sessions, session length, screens viewed, in-app events, feature usage, push notification response, funnels, cohorts and retention curves.
This layer helps teams answer: do users understand the app, return to it and use the features that matter?
Monetization data
Monetization data tracks revenue and value. It includes purchases, subscriptions, in-app purchases, ad revenue, ARPU, ARPPU, LTV, payback period and ROAS.
This layer helps teams answer: does each user, cohort or campaign generate more value than it costs to acquire?
Performance data
Performance data measures the technical health of the app. It includes crashes, ANRs, exceptions, load time, render time, network errors and crash-free users.
This layer helps teams answer: is the app experience stable enough to support retention, conversion and revenue?
Key mobile app analytics metrics
The most useful mobile app analytics KPIs depend on the team’s goal. Growth teams usually focus on acquisition and conversion. Product teams watch activation, retention and feature usage. Monetization teams care about ARPU, LTV and ROAS. Engineering teams track crashes and performance.
| Metric | What it measures | Main layer |
|---|---|---|
| DAU | Daily active users | Engagement |
| MAU | Monthly active users | Engagement |
| Stickiness | DAU divided by MAU | Engagement |
| D1/D7/D30 retention | Share of users still active after 1, 7 or 30 days | Engagement |
| Session length | How long users stay in the app | Engagement |
| Funnel conversion | Share of users who complete a key flow | Engagement |
| ARPU | Average revenue per user | Monetization |
| ARPPU | Average revenue per paying user | Monetization |
| LTV | Estimated user lifetime value | Monetization |
| CAC | Cost to acquire a customer | Acquisition |
| CPI | Cost per install | Acquisition |
| ROAS | Revenue generated per ad-spend unit | Acquisition + monetization |
| Store conversion rate | Share of store visitors or impressions that turn into installs | Acquisition |
| Crash-free users | Share of users who do not experience a crash | Performance |
For most teams, a clear dashboard with 6–10 primary KPIs is more useful than a large report nobody checks. The goal is not to track everything. The goal is to spot the numbers that explain growth, retention, revenue and user experience.
Read also: 30 Mobile App Analytics Metrics You Can’t Ignore (Part 1)
Where mobile app analytics data comes from
Mobile app analytics is multi-source by design. App teams usually collect data from the app itself, from app-store platforms, from attribution providers and from store-side analytics tools.
In-app SDKs
In-app SDKs collect behavior inside the app. They track events such as signup, onboarding completion, checkout, purchase, subscription start, feature use or level completion.
Common tools in this layer include Mixpanel, Amplitude, Firebase Analytics, Heap and PostHog.
Platform consoles
App Store Connect and Google Play Console provide first-party store data. This can include impressions, product page views, downloads, acquisitions, store listing visitors, conversion rate and source-level performance.
These platforms are important because they show how the app performs inside the App Store and Google Play ecosystem.
Attribution platforms
Mobile Measurement Partners, or MMPs, connect installs and post-install events to traffic sources and campaigns.
Common examples include AppsFlyer, Adjust, Branch, Singular and Kochava. On iOS, attribution is shaped by privacy frameworks such as App Tracking Transparency, SKAdNetwork and AdAttributionKit.
Crash and performance tools
Crash and performance tools monitor app stability. They help teams find crashes, ANRs, exceptions, slow screens, failed requests and technical issues that can hurt conversion or retention.
Common examples include Firebase Crashlytics, Sentry, Instabug and Bugsnag.
Store-side analytics tools
Store-side analytics tools track what happens around the app listing: reviews, ratings, keyword rankings, category rankings, featured placements, store conversion and competitor performance.
This layer is especially useful for ASO, reputation management and competitor benchmarking because much of the data sits outside the app itself.
Mobile app analytics tool categories
Mobile app analytics tools fall into five main categories. Most growing app teams use more than one category because each tool answers a different question.
| Category | What it helps with | Examples |
|---|---|---|
| Product analytics | Events, funnels, cohorts, retention, feature usage | Mixpanel, Amplitude, Heap, PostHog, Firebase |
| Attribution / MMP | Install source, campaign attribution, paid acquisition performance | AppsFlyer, Adjust, Branch, Singular, Kochava |
| Crash and performance | Crashes, ANRs, exceptions, load time, app stability | Firebase Crashlytics, Sentry, Instabug, Bugsnag |
| Store-side analytics | Reviews, ratings, rankings, store conversion, competitor data | AppFollow, AppTweak, Sensor Tower, ASOdesk |
| BI / data warehouse | Combining analytics data into one reporting layer | BigQuery, Snowflake, Redshift, Looker, Tableau |

Mobile app analytics vs. web analytics
Mobile app analytics and web analytics both measure user behavior, but they use different data models. Web analytics tracks browser behavior. Mobile app analytics tracks app behavior, app-store performance and mobile-specific attribution signals.
| Dimension | Web analytics | Mobile app analytics |
|---|---|---|
| Main surface | Website pages | App screens, events and app-store listings |
| Data collection | JavaScript tags | SDKs, platform consoles and MMPs |
| User journey | Page visits and web sessions | Install, activation, retention, monetization and app usage |
| Attribution | UTMs, referrers, cookies | MMPs, SKAdNetwork, AdAttributionKit, Google Play Install Referrer |
| Store data | Not applicable | App Store and Google Play impressions, views, installs and conversion |
| Technical layer | Page speed and browser errors | Crashes, ANRs, exceptions and app performance |
The biggest difference: mobile analytics has to account for the store layer. Before users ever open the app, they may see the listing, compare ratings, read reviews, view screenshots and decide whether to install.
How AppFollow contributes to mobile app analytics
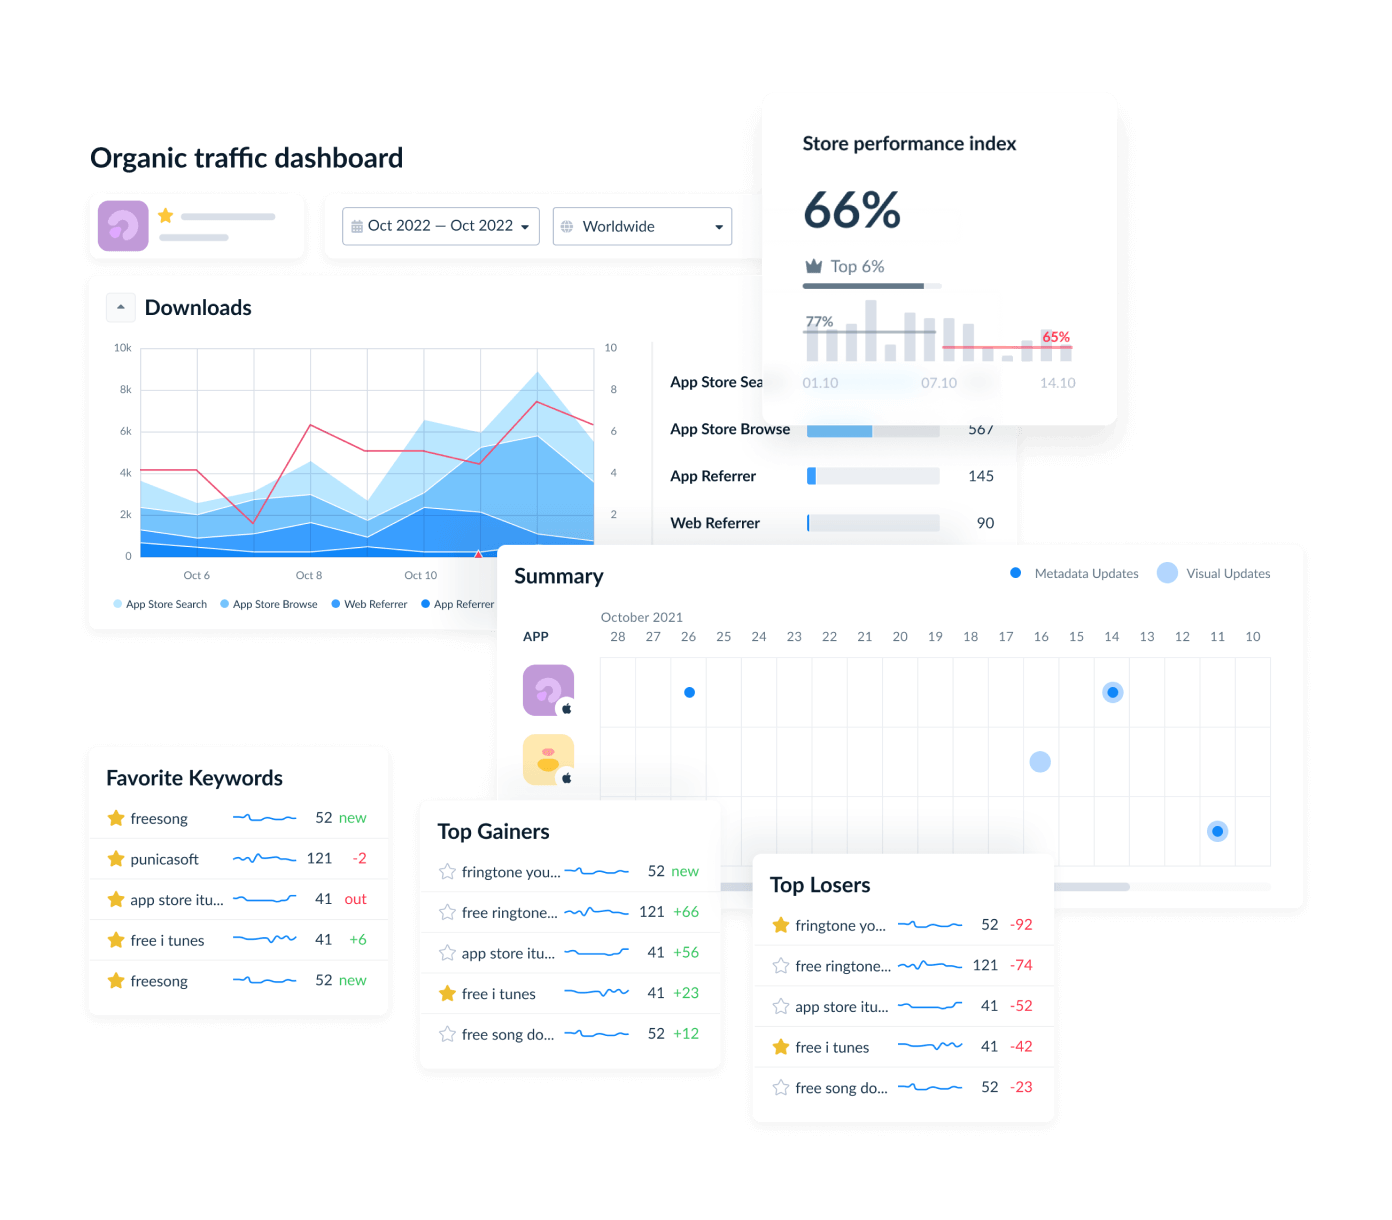
AppFollow fits into the store-side analytics layer of a mobile app analytics stack.
It does not replace product analytics tools like Mixpanel or Amplitude. Those tools show what users do inside the app. AppFollow helps teams understand what happens around the app listing: reviews, ratings, sentiment, response performance, rankings, store stats and competitor movement across iOS and Google Play.
App teams use this layer to answer questions such as:
| Question | Why it matters |
|---|---|
| Are reviews getting better or worse after the latest release? | Connects product changes to public user feedback |
| Which review topics appear most often? | Shows what users praise, complain about or request |
| How are ratings changing by country, app version or store? | Helps localize reputation and support priorities |
| Which keywords or categories are moving? | Shows visibility gains and losses |
| How do competitors compare on reviews, ratings and rankings? | Adds market context to ASO and growth decisions |
| Did store conversion change after a metadata or creative update? | Connects ASO work to acquisition performance |
When app teams use mobile app analytics
App teams use mobile app analytics whenever they need to understand growth, product behavior, monetization or user experience.
Common use cases include:
| Use case | Example question |
|---|---|
| ASO performance | Did our title, subtitle, screenshots or description update improve visibility or conversion? |
| Product decisions | Which features drive retention or drop-off? |
| User acquisition | Which campaigns bring users who stay and pay? |
| Monetization | Which cohorts generate the highest LTV? |
| Retention | Where do users disappear after install? |
| Reputation management | Are users reporting the same issue in reviews? |
| Release monitoring | Did the latest version change crashes, ratings or sentiment? |
| Competitor analysis | Which apps are gaining rankings, better reviews or stronger store conversion? |
Frequently asked questions
What is mobile app analytics?
Mobile app analytics is the process of collecting and analyzing data from iOS and Android apps. It helps teams understand acquisition, engagement, monetization and performance, including how users find the app, what they do after install, how much value they generate and whether technical issues affect the experience.
What is the meaning of app analytics?
App analytics means the data and tools used to measure how people discover, use, pay for and experience an app. In mobile apps, this includes in-app events, retention, revenue, attribution, crashes, App Store and Google Play performance, reviews, ratings and rankings.
What is the difference between mobile app analytics and web analytics?
Web analytics measures browser-based behavior, such as page views, web sessions and referrers. Mobile app analytics measures app-specific behavior, such as installs, SDK events, retention cohorts, in-app purchases, crash-free users, app-store conversion, reviews and mobile attribution.
What are the most important mobile app analytics KPIs?
The most important mobile app analytics KPIs are DAU, MAU, retention rate, stickiness, ARPU, LTV, CAC, CPI, ROAS, store conversion rate and crash-free users. The best KPI set depends on the team’s goal: growth, product engagement, monetization, app stability or ASO.
Which mobile app analytics tools should I use?
Most teams need one tool for product analytics, one MMP for attribution, one crash tool, one store-side analytics tool and, at scale, a BI or data warehouse layer. For example: Mixpanel or Amplitude for in-app behavior, AppsFlyer or Adjust for attribution, Firebase Crashlytics or Sentry for crashes, and AppFollow or AppTweak for store-side analytics.
