

What Are Top Charts?
Table of Content:
Top charts are app store rankings that show which apps are currently leading by chart type, category, country, device, and sometimes revenue model. In the App Store, users can see charts for top apps and games, while ASO teams use top charts to understand which competitors are gaining visibility, which categories are heating up, and where market demand is moving before it shows up in their own installs.
That is the simple version.
The more useful one: top charts are a public signal of app momentum.
Not the whole growth story. Not a replacement for keyword rankings. Still, if your app climbs from #42 to #11 in Finance in Spain, something changed. Maybe downloads accelerated. Maybe a campaign landed. Maybe a competitor dropped. Maybe the category got weird after a seasonal spike. The chart will not explain the cause on its own, but it tells you where to look.
Top charts meaning
Top charts meaning depends on the store and chart type.
In Apple’s public App Store charts, users can browse top iPhone apps and games, with country-specific pages showing ranked apps in categories such as top free and top paid. Apple’s public charts page, for example, lists ranked iPhone apps by storefront and chart type.
In AppFollow, Top Chart Rankings show the most popular apps in the App Store at a selected moment.
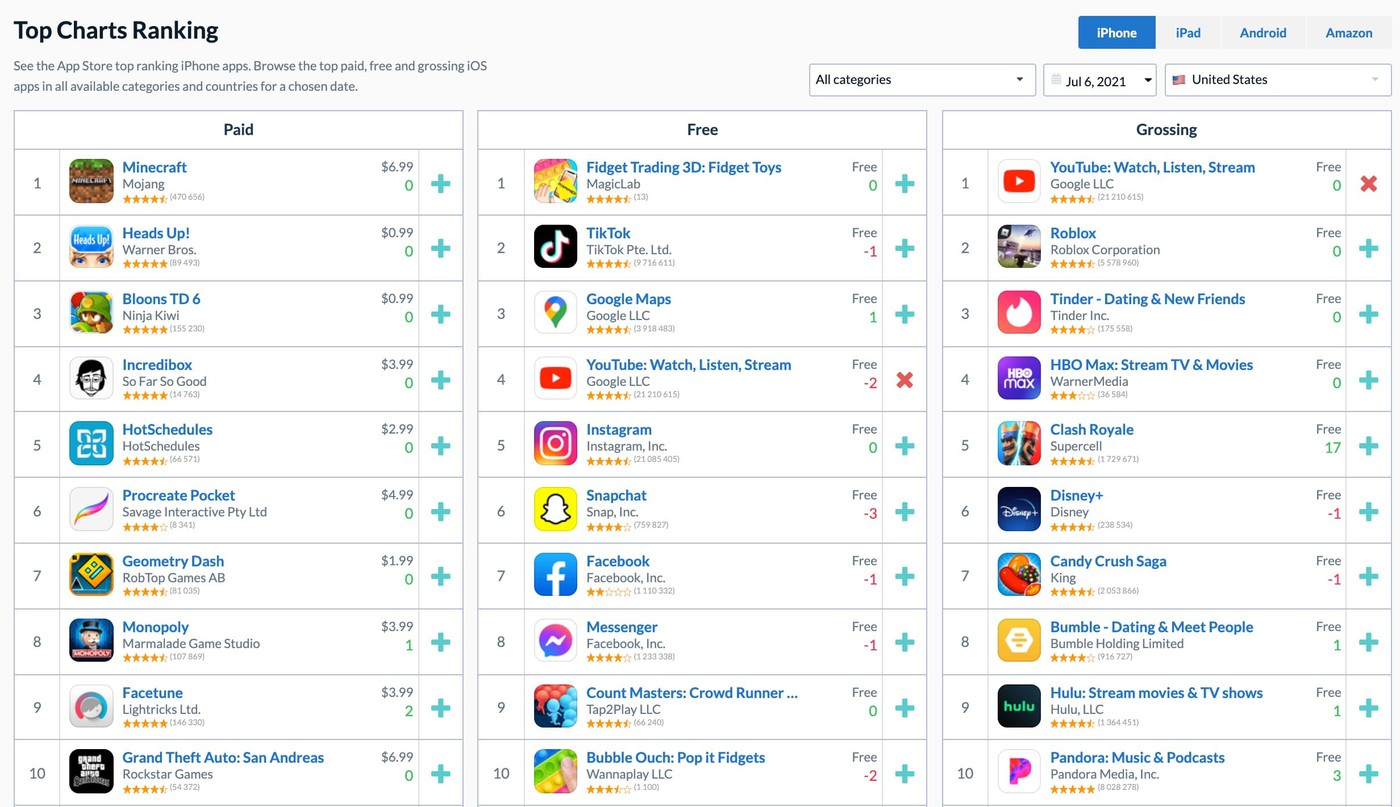
The chart includes Paid, Free, and Top-Grossing apps. Teams can choose the date, category, country, and switch between iPhone and iPad. AppFollow also notes that ranks are updated once a day at night in UTC, while live store positions can change several times during the day.
So when app teams say “we need to track top charts,” they usually mean:
where does our app stand against the market, not only against our own past performance?
Why top charts matter
Top charts matter because app stores are crowded, and ranking visibility compounds fast.
Apple reported that the App Store ecosystem facilitated $1.3 trillion in developer billings and sales in 2024, with more than 813 million average weekly visitors worldwide. That is the business context to place near this argument: even a small visibility lift inside a high-intent store environment can matter because the audience is already there, browsing, comparing, and downloading.
- For app developers, top charts help answer a blunt question: are we gaining category momentum, or are we just celebrating isolated install spikes?
- For app marketers, top app charts show which apps own attention in a specific country and category. That helps with ASO messaging, screenshot positioning, competitor monitoring, and launch timing.
- For app publishers, charts help spot portfolio opportunities. A sudden climb in Health & Fitness, Games, Education, or Finance can reveal seasonal demand before a keyword report explains the full pattern.
How top charts work
Top charts rank apps inside a specific store environment. The important words are specific store environment.
A top free app in the United States is not automatically a top free app in Spain. A high-ranking iPhone app may not rank the same on iPad. A game may dominate free charts while a paid productivity app wins a different list entirely.
That is why one chart screenshot is weak evidence. You need the country, category, device, date, and chart type.
A proper top charts view should answer:
- Which country are we checking?
- Which device matters, iPhone or iPad?
- Which category are we in?
- Are we looking at free, paid, or grossing?
- What date are we comparing?
- Did the rank move after a release, campaign, featuring event, pricing change, or review spike?
AppFollow’s public rankings pages also let teams browse top paid, free, and grossing iOS apps across available categories and countries for a chosen date, which is exactly the kind of historical view teams need when chart movement becomes part of ASO analysis.
How to see top charts on App Store
If you want to know how to see top charts on App Store, there are two practical ways.
First, from the App Store itself. Open the App Store, go to the Apps or Games section, then look for chart sections such as top free, top paid, or top games. Apple also has public web chart pages for iPhone apps and games by country, where you can browse ranked apps directly.
Second, use an ASO or market intelligence tool when you need more than a quick look. The App Store shows what is ranking now. A tool like AppFollow helps teams check chart type, country, category, device, and date, then compare changes over time.
Top Chart Rankings can be filtered by date, category, country, and device, with Paid, Free, and Top-Grossing charts available.
The difference is simple.
The store view is for checking.
The analytics view is for understanding.
Top charts vs keyword rankings vs category rankings
Metric | What it shows | Best use | What it does not show |
Top charts | Which apps rank highest in a store chart by country, category, device, and chart type | Tracking market momentum, competitor movement, category leaders, and visibility spikes | Why the app moved or which keyword caused discovery |
Keyword rankings | Where your app ranks for a specific search term | Measuring ASO search visibility for target keywords | Overall category strength or paid/free/grossing chart position |
Category rankings | Where your app stands inside a category | Understanding category-level competition and market position | Search intent behind individual keywords |
Search visibility | How visible the app is across a keyword set | Seeing whether ASO work improves discoverability | Whether the app is a top chart leader |
Conversion rate | How many listing visitors install | Measuring store page performance | Public market rank or competitor chart movement |
Here is the mistake: treating app store top charts as if they explain everything.
They do not.
Top charts tell you who is winning visible momentum. Keyword rankings tell you how users may find you through search. Conversion rate tells you whether the listing earns the install. Reviews and ratings tell you whether users trust the app after the promise.
Use them together and the picture gets useful.
Example of top charts in ASO
Let’s say you manage a language learning app. Your downloads look stable. Nothing dramatic. Then you check the Education top charts in Brazil and see a competitor jump from #28 to #6 in top free apps.
Now the work starts.
Did they launch a Portuguese campaign? Did they change screenshots? Did they get featured? Did their rating improve? Did they add a free trial? Are they climbing for “learn English,” “Spanish lessons,” or “language practice”?
A chart jump is not the answer. It is the alarm bell.
Smart ASO teams investigate the movement, compare metadata, watch review sentiment, check keyword rankings, and look at whether the competitor’s rise affects their own impressions or category position.
That is how top charts move from “nice screenshot for Slack” to actual competitive intelligence.
How app teams should track top charts
Track top charts the same way you track revenue or retention: consistently, not randomly.
A useful workflow looks like this:
- Monitor your main category in priority countries.
- Separate free, paid, and grossing charts.
- Watch your direct competitors, not only your own app.
- Mark release dates, metadata changes, campaigns, and pricing tests.
- Compare chart movement with keyword rankings, product page views, conversion rate, ratings, and review volume.
- Look for country-specific patterns instead of assuming one market explains all markets.
One small note for managers: the lower the app position, the more noisy movement can feel. AppFollow mentions that lower chart positions may show more noticeable changes, while store positions can shift during the day even though AppFollow updates rankings once daily in UTC.
So do not panic over one dip.
Look for patterns across dates, countries, and competitors.
cta_get_started_purple
Related terms
- What Is an App Subtitle?
- Featured Apps
- What are app reinstalls?
- What Is App Size?
- What Is Keyword Density?
- What Is App Store Connect?
- What is an App Store?
FAQs
What are top charts in app stores?
Top charts are ranked lists of apps in an app store. They usually show leading apps by country, category, device, and chart type, such as free, paid, or top-grossing apps. App teams use them to monitor market momentum and competitor visibility.
What is the top charts meaning for ASO?
For ASO, top charts meaning is simple: they show which apps are gaining visible traction in a store category or chart. They help teams understand market movement, competitor growth, category demand, and whether their app is becoming more or less visible over time.
How to see top charts on App Store?
Open the App Store and check the Apps or Games sections for chart lists such as top free or top paid. You can also use Apple’s public web chart pages for country-specific iPhone rankings, or an ASO tool when you need country, category, device, and historical tracking.
Are app store top charts the same as keyword rankings?
No. App store top charts show leading apps inside a chart, category, country, and device context. Keyword rankings show where an app appears for a specific search term. A top chart position can improve while some keyword rankings stay flat, and the reverse can happen too.
Why should app teams track top app charts?
Top app charts help teams spot competitor movement, market demand, category shifts, and campaign impact. They are especially useful when tracked alongside keyword rankings, conversion rate, ratings, reviews, downloads, and revenue.
