Gitopser: how our developers deploy to EKS right from their repository

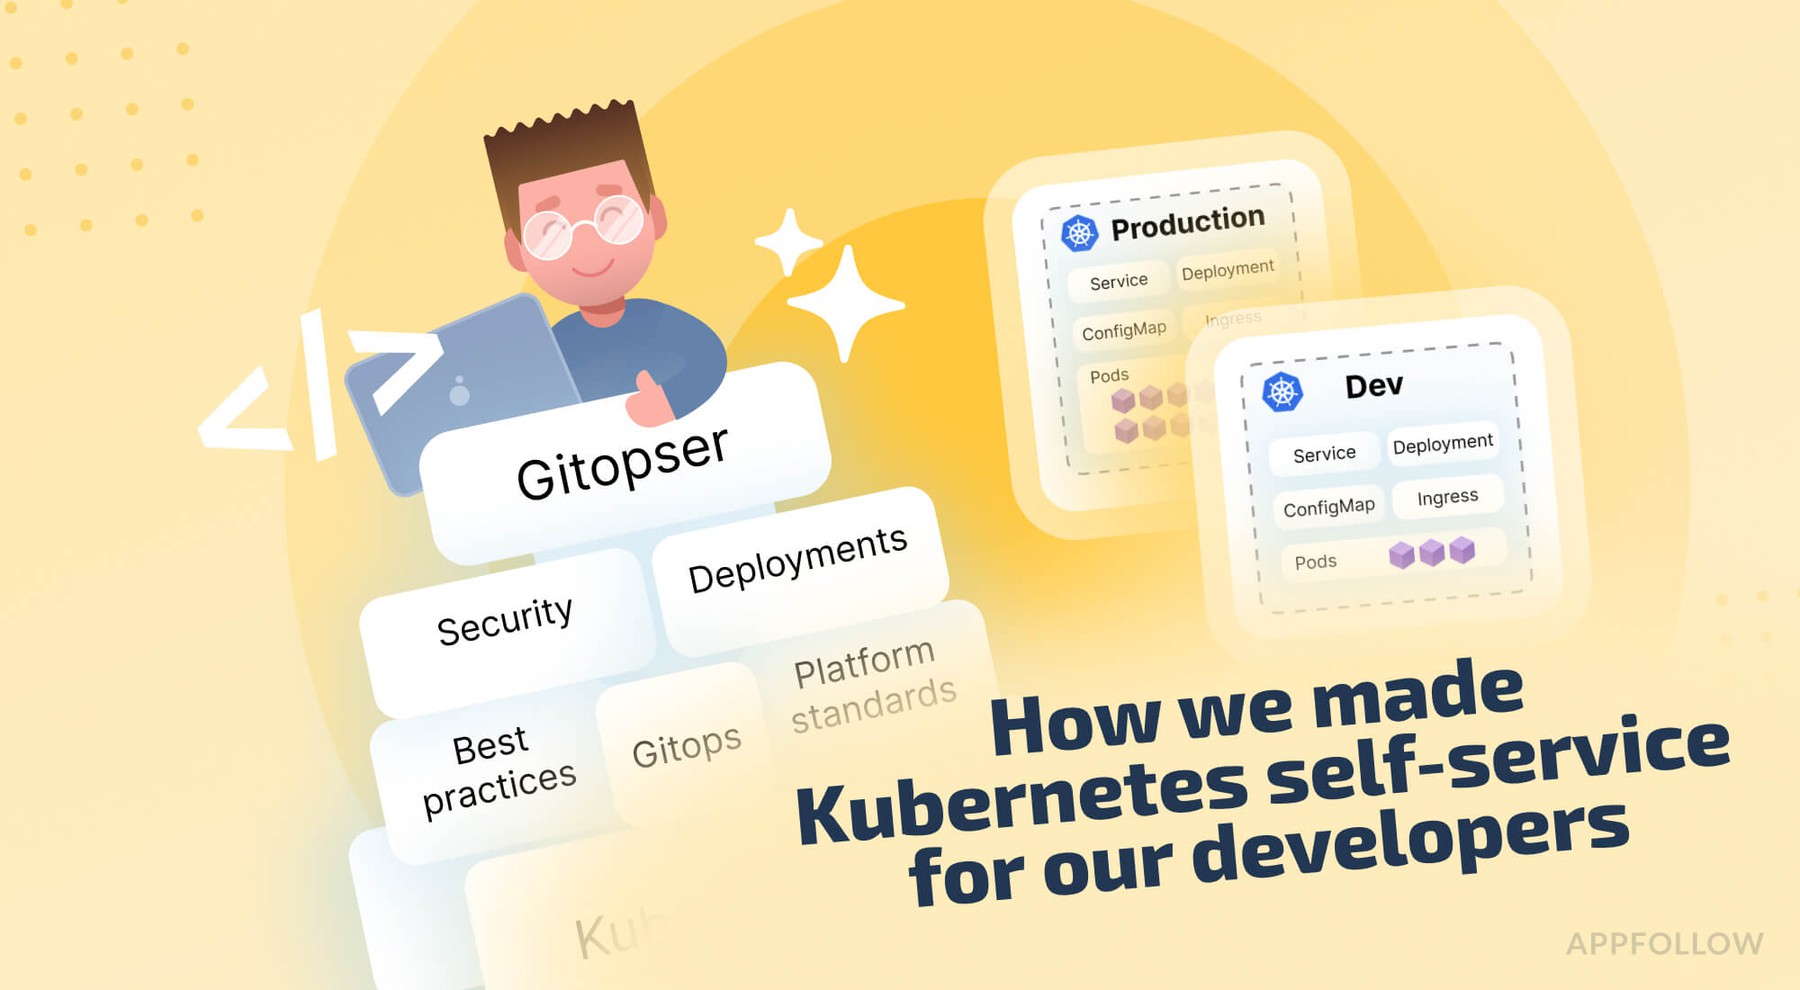
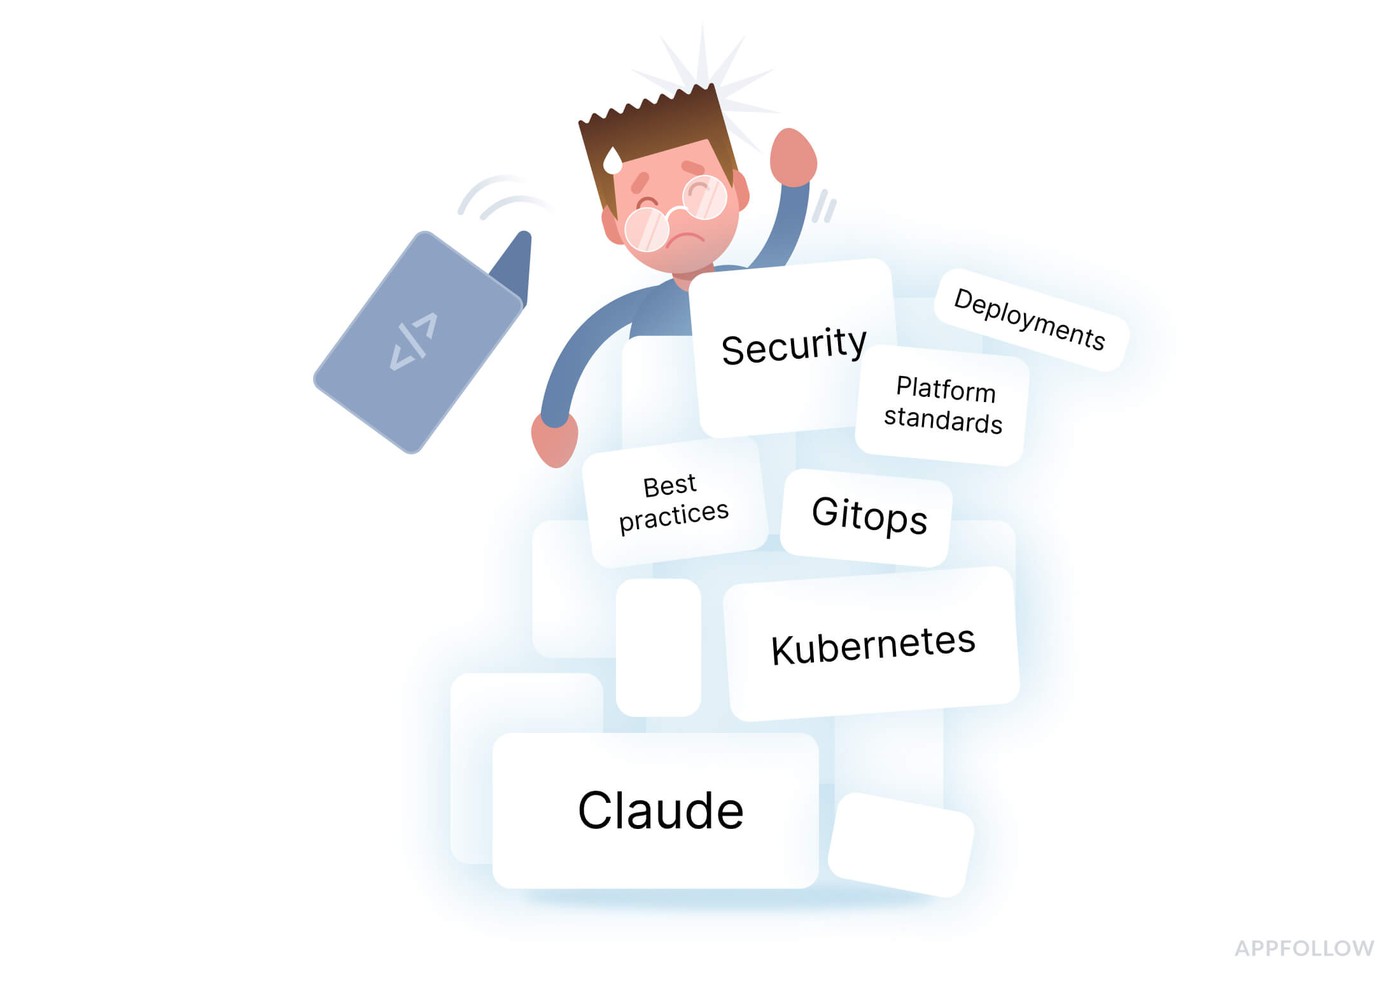
After the move to EKS, our development teams kept pushing copy-pasted Kubernetes resources to the main GitOps repository with wrong configuration and bad labels, and we caught some of those mistakes way too late.
The new stack was EKS with Kustomize and a set of GitOps standards, and each tool had its own rules and conventions. Our engineering org, meanwhile, was used to the old sysadmin model, where a developer hands a deployment problem to ops and waits for a fix. We asked those same developers for self-service on a stack most of them barely knew (which, looking back, was asking a lot). We ran webinars and wrote docs, and people kept copy-pasting manifests with bad config regardless.
Anyone who deployed before containers probably has a version of this story: a Friday evening, an SSH session, Table 'mydb.users' doesn't exist in the logs, and a colleague whose migration touched the users table. Friday deploys are still a bad idea, for the record. Today's stacks have far more moving parts than that one server, so a deploy has more ways to fail now.
How Gitopser got its start
We wanted developers to handle deployment config from their own app repo, with our platform defaults enforced every time and much less Kubernetes knowledge needed on their side.
The idea came up in a meeting where a teammate and I were going through the latest batch of dev mistakes in the GitOps repo. I said we needed a way for devs to make changes easily with platform-approved configuration. He suggested something like a templating engine, and he already had a name for it: Gitopser.
What goes in the .gitopser directory
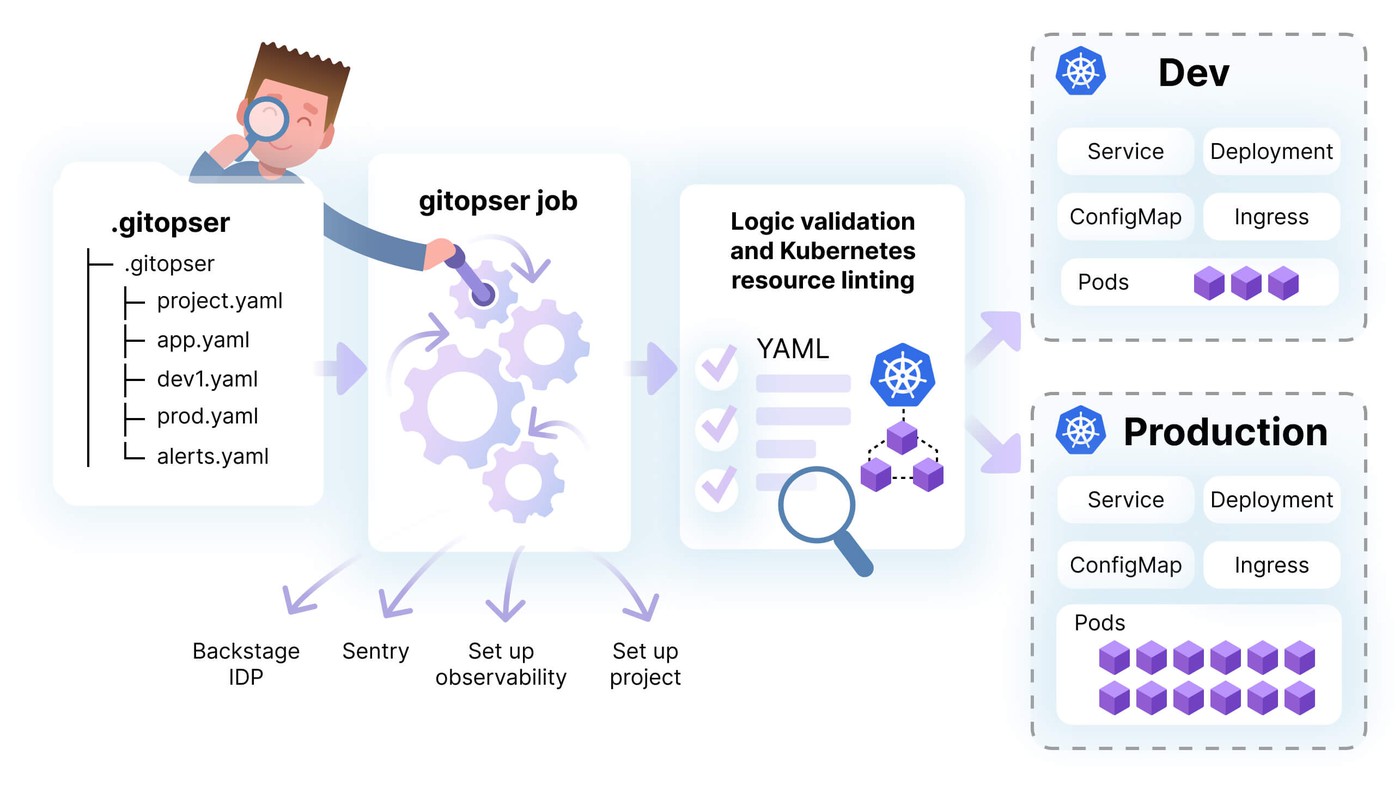
Every app repo gets a .gitopser directory with these files:
.gitopser/
├── project.yaml
├── app.yaml
├── dev1.yaml
├── prod.yaml
└── alerts.yaml
Gitopser itself is a stateless Python CLI with its own Pydantic-based schema. It parses every YAML file into Pydantic objects and validates each object before rendering any Kubernetes resources, so a bad field value fails with an error in the CLI and never ends up in a manifest.
project.yaml for Backstage and Sentry
yaml
---
apiVersion: gitopser.appfollow.io/v1alpha1
kind: Project
spec:
backstage:
system: auto
sentry:
name: auto
project.yaml registers the service in our Backstage catalog automatically, so every new service gets listed there with no extra work, and it connects the service to Sentry for error reports.
app.yaml, the required file
app.yaml has kind Application in the Gitopser schema, and every repo needs one. It describes each component Gitopser deploys to EKS, plus the app's dependencies.
yaml
---
apiVersion: gitopser.appfollow.io/v1alpha1
kind: Application
metadata:
name: awesome-project-name
team: bananas
overlays:
- devA
- prod
spec:
components:
- name: app
kind: api-external
api:
gatus: true
slo:
availability:
objective: 99
alerting: true
latency:
objective: 95
bucket: 2000
alerting: true
port: 8000
healthcheck: /healthcheck
metrics: /metrics
resources:
requests:
cpu: 100m
memory: 512Mi
limits:
memory: 768Mi
autoscaling:
minReplicas: 6
maxReplicas: 12
triggers:
- type: cpu
metricType: Utilization
value: 60
nodeSelector: spot
podAntiAffinity:
toItself: true
pdb:
minAvailable: 80%
- name: trigger-something-to-get-bananas
kind: cronjob
# ...
- name: worker-type-load
kind: worker
replicas: 1
# ...
dependencies:
- name: postgresql
kind: postgresql
- name: redis
kind: redis
metadata.name becomes the Kubernetes instance label, and each component name gets added to the application label, so searching logs for a whole app or a single component is easy. The kind field sets whether a component has any exposure and what kind, with values like api-external, api-internal, and worker, plus cronjob for scheduled jobs.
Monitoring and SLOs
gatus: true adds the component to our Gatus probes, the last line of defense for our on-call rotation. The slo block sets availability and latency objectives through Sloth, based on Prometheus metrics, and each objective can have its own alerting. We treat those SLOs as internal targets with no formal uptime promise attached, and we still watch every dip.
Resources, autoscaling, and dependencies
Developers set their own requests and limits, KEDA autoscaling triggers, node selectors, pod anti-affinity, and PDBs. One app can include several components (an API, a couple of CronJobs, some workers) and declare dependencies like PostgreSQL and Redis. We use Opstree's operator for Redis, which keeps maintenance pretty minimal.
Overlays for each environment
The environment files in the directory (dev1.yaml, prod.yaml, whatever environments a team has) are of kind Overlay. An overlay overrides app.yaml values for one environment, like more memory in prod or an extra component in dev. Teams write app.yaml once for dev and prod and mostly leave it alone after that, with day-to-day tweaks done in the overlays.
Team alerts in alerts.yaml
yaml
---
apiVersion: gitopser.appfollow.io/v1alpha1
kind: PrometheusAlert
spec:
slackChannelName: alerts_some_team_prod
rules:
- name: SomeServiceCheckQueueSize
description: Queue size is too big ({{ $labels.queue }})
severity: warning
expression: rabbitmq_queue_messages_ready{queue="some.queue"} >= 10000
for: 10m
Anyone on a dev team can add PromQL rules here, and the alerts go to the Slack channel in slackChannelName, where the team's on-call rotation handles them.
An escape hatch for the platform team
Gitopser doesn't lock the main GitOps repository. If production needs a fix at 11 p.m. on a Friday, the platform team changes the GitOps repo directly, and someone updates the Gitopser config afterward.
What changed for developers
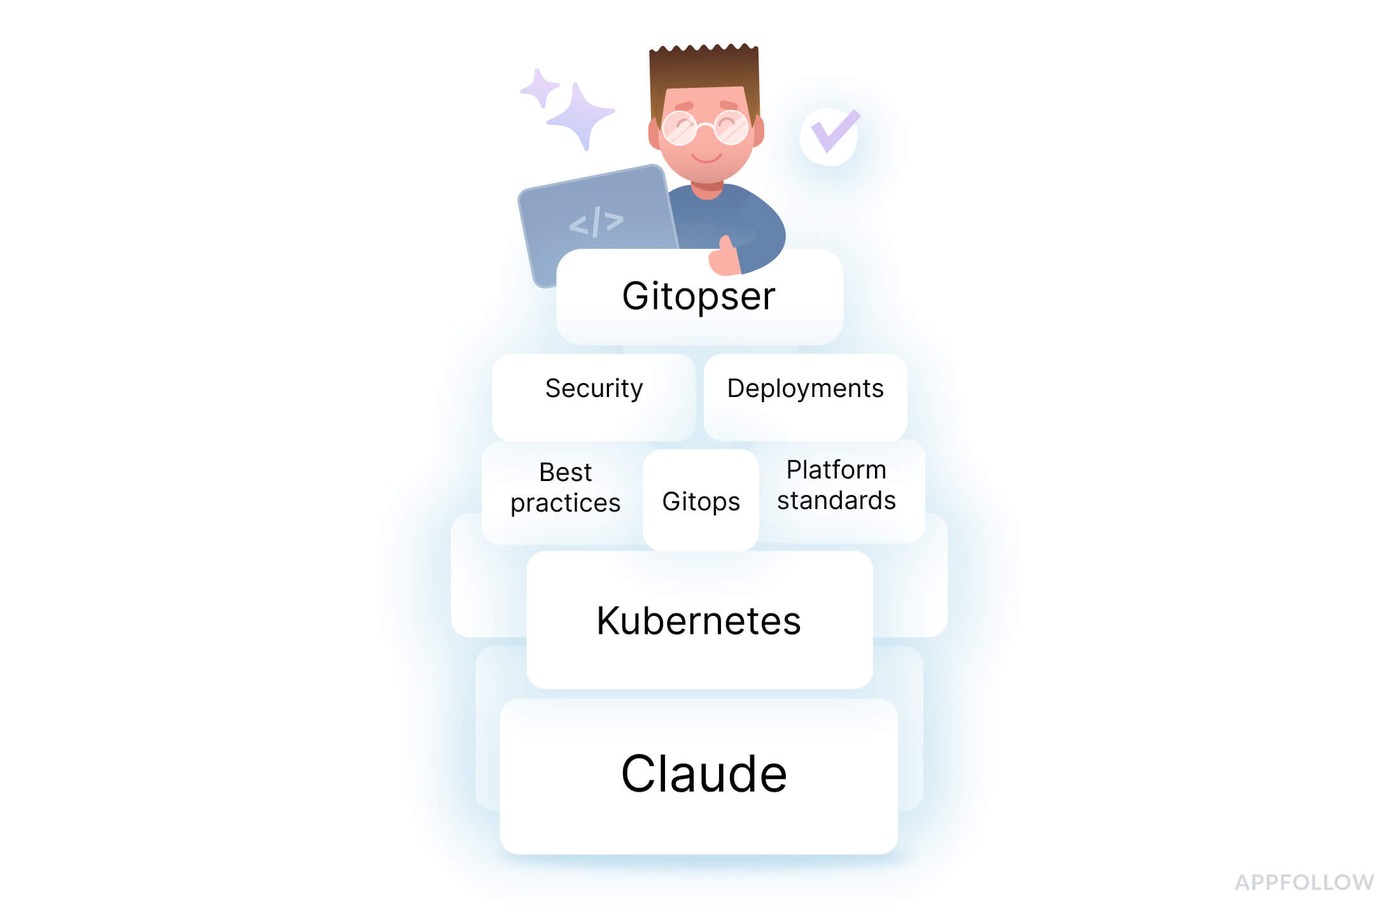
Developers own their deployment config in their app repo now, and Gitopser validates every change against its schema and adds our platform defaults for labels and monitoring. AppFollow engineering also spent a lot of time standardizing our tools, so with Gitopser a brand-new service is live in production after a single build. AI is probably the next thing we try in this workflow, with no promises on specifics yet.
Frequently asked questions
What is Gitopser?
Gitopser is an internal CLI the AppFollow platform team wrote in Python. Developers describe their service in a few YAML files in a .gitopser directory inside the app repo. Gitopser validates that config against a Pydantic schema and renders Kubernetes resources for our EKS clusters, complete with our defaults for labels and monitoring.
Why not have developers write Kubernetes manifests themselves?
We tried that, with docs and webinars for every team. People kept copy-pasting manifests with wrong configuration and bad labels, and we caught some of those mistakes way too late. EKS, Kustomize, and our GitOps conventions are a lot to learn in addition to product work, so Gitopser's schema and defaults handle most of that for them.
What files are in the .gitopser directory?
A typical setup has project.yaml for Backstage and Sentry, app.yaml for components and dependencies, one overlay file per environment (like dev1.yaml and prod.yaml), and alerts.yaml for Prometheus alert rules. app.yaml is required, since it describes what Gitopser deploys to EKS. The overlay files change app.yaml values for a single environment.
How do overlays work in Gitopser?
Each overlay is a YAML file of kind Overlay, usually one per environment. An overlay overrides values from app.yaml, so a team can give prod more memory or add a component that only runs in dev. Shared config for all environments lives in app.yaml, with the per-environment differences kept in the overlay files.
Can the platform team still make production changes without Gitopser?
Yes. Gitopser doesn't lock the main GitOps repository, so during an incident the platform team can commit a fix to the GitOps repo directly. Someone updates the Gitopser config afterward. Nobody waits on a Gitopser template change during a 2 a.m. outage.
What monitoring comes with Gitopser?
Any component can get a Gatus probe with one flag in app.yaml, and Gatus is the last line of defense for our on-call rotation. Sloth handles availability and latency SLOs based on Prometheus metrics, with optional alerting. Teams write their own PromQL rules in alerts.yaml for their Slack channel, and project.yaml connects every service to Sentry.
What is Gitopser's tech stack?
Gitopser is a stateless Python CLI with a Pydantic schema. It generates config for Amazon EKS clusters, which we manage with Kustomize and GitOps. The rest of the setup: KEDA for autoscaling, Opstree's operator for Redis, Gatus and Sloth for monitoring, Backstage as our developer portal catalog, and Sentry for error tracking.