How to count ROI for your ASO

Table of Content:
Intro
“If you build it, they will come”.
That’s the mindset of many entrepreneurs, devs, and beginner studios out there. And it has to be the truth, right?
Wrong.
To shine among countless competitors on the app stores, you must get every reasonable advantage out there and capitalize on it.
That’s exactly what App Store Optimization does as a part of your marketing team strategy. It helps your users-to-be see your app and give it a go, among other revenue-boosting things.
But enough talk. Let’s look at the numbers instead, and see things for what they are.
Case 1: Reaching a set KPI on user count
What do we have?
Enter the X mobile hyper-casual game developer company (can’t name the names, sorry). The preferred monetization channel for this niche is the in-app advertisement. That means the challenge is in keeping the Daily Active Users (DAU) number keep on growing. The more people keep seeing the ads, the better.
Let’s assume the company makes X $ in revenue with a 1000 DAU. To keep the DAU level, +750 new installs must occur every day. To grow, there must be more. Currently, 93% of traffic is bought through Facebook/Google AdWords/etc. 7% of the traffic is achieved through organic growth.
What should we do?
Boost the new app install rate by any and all available means.
What did we do in the end?
In short, an ASO specialist performed text optimization, improved conversion rate (by updating graphic images, short descriptions) and Google Play tags optimization.
Let’s take a look at the full scope of work:
Organic reach
- Search channel: optimized text metadata, improved relevance, and visibility of the app. The app install rate originating from search grew from 15 installs/day to 45 installs/day. That is not the main traffic channel, hence it’s a positive byproduct of our efforts.
- Browse channel: optimized relevant app tags to better work with app store algorithms and improved visibility of the app in categories (charts). The “Similar Apps” list reflects the change by showing more relevant apps. Organic growth from this channel increased from 37 installs/day to 149 installs/day.
Paid reach
- Graphic content optimization yielded a +9% increase in conversion and increased install rate across all available channels (including organic). Average Cost Per Install (CPI) decreased.
Grand total
Paid traffic acquisition now more affordable, organic reach is more effective and brings in more revenue.
Overall, our efforts yielded $7590 saved monthly.
While the set KPI to have 750+ installs a day didn’t change, the way it is achieved has been greatly improved. Instead of 2% of organic installs, we now have 26%. Paid traffic acquisition now only needs to cover 556 installs as opposed to 698. With the average CPI of $1, the company now saves $142 daily, and $4260 monthly. Considering that the Lifetime Value (LTV) of organic traffic is on average higher than paid traffic, there are without a doubt extra diminishing returns.
Improved conversion affected the paid channels and reduced the average CPI by 20%, from $1 to $0.80. That is another $3300 saved a month.
What next?
Reinvest the saved money into product development or extra traffic to grow the user base further, experiment with extra monetization options, profit.
demo_organic_strategy
Case 2: App Store Optimization + Apple Search Ads
What do we have?
Enter the app developer company Y. It has published a grocery delivery service app. The app is only available in the UK, with some regional restrictions - metropolitan areas only and such. The challenge is to grow the app’s ranking in the app stores based on relevant keywords and outshine the countless competition. If you're building for iOS, there's no way around the ios app store review guidelines - they're a must!
What should we do?
Undergo metadata text optimization to maximize growth and sustain relevant keyword rankings. Build up market intel on each relevant keyword and use it later on for further ASO optimization efforts. Use Apple Search Ads traffic buying based on brand keywords to capitalize on our competitor’s brand and protect our own.
It is a rather unique user acquisition channel; the traffic buying happens right in the app store and is based on keywords. This results in a wide assortment of advantages based on what you know about your audience and helps to achieve rapid growth.
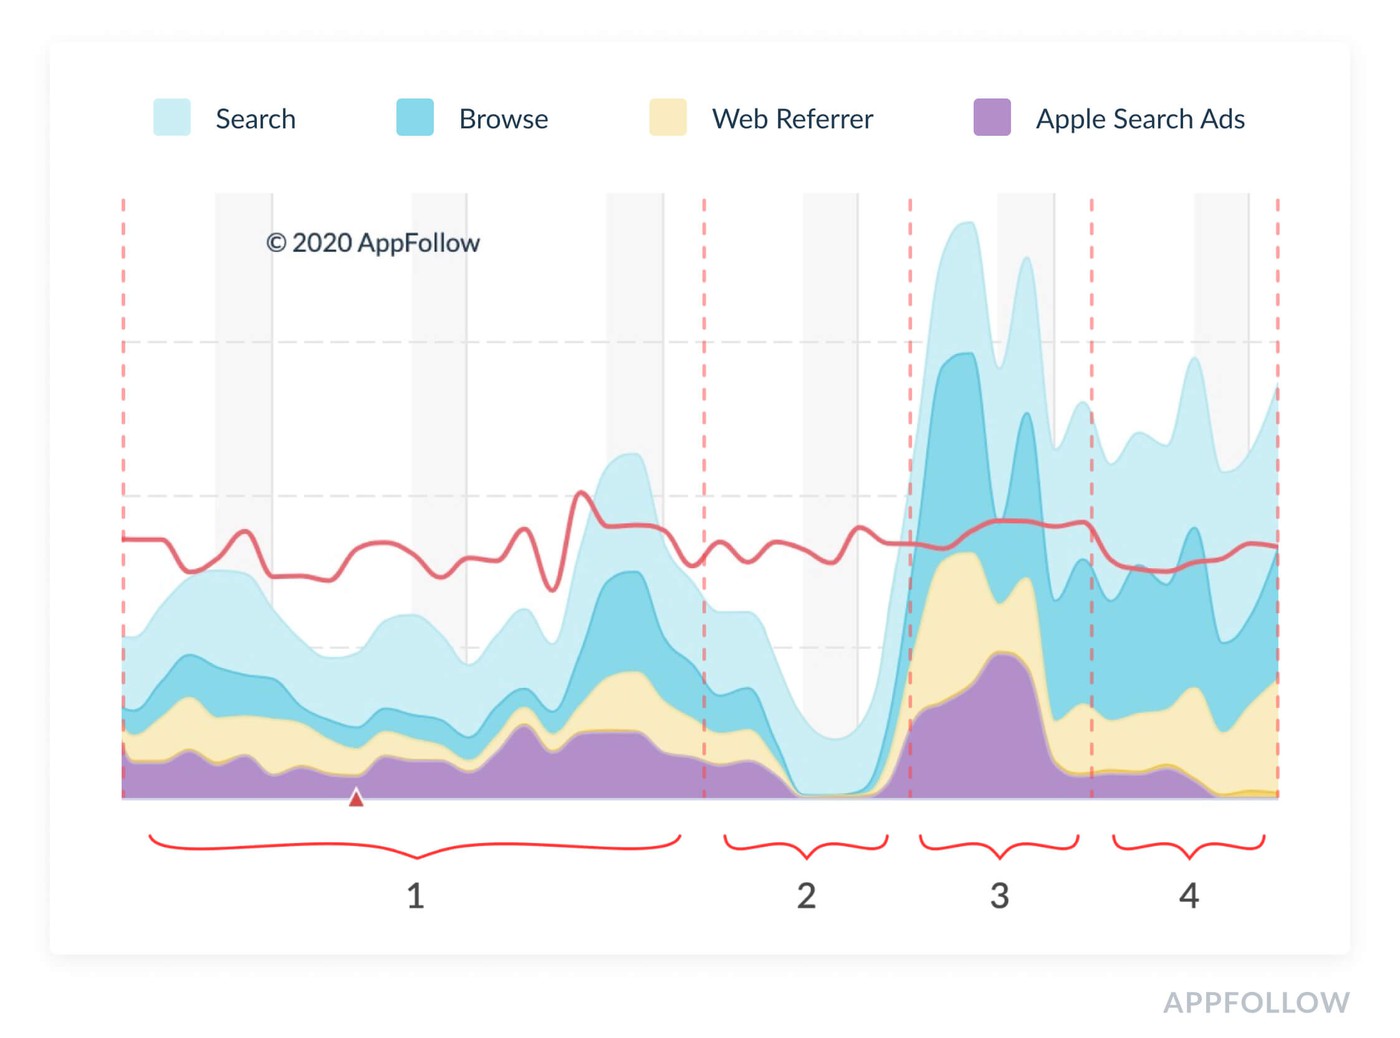
Witness the peculiarities in ASA’s adoption:

Timeframe 1: chaotic traffic buying in ASA
Timeframe 2: campaign on hold, improvements underway
Timeframe 3: ASA traffic buying in sync with ASO
Timeframe 4: Reduction in ASA traffic buying and organic growth
What did we do in the end?
- Complete restructuring of the ASA traffic buying campaign based on performance data gathered on every keyword after the first traffic buying.
- Evaluation of Cost Per Action, ROI, and Lifetime Value metrics of every keyword (based on Mobile Measurement Partner data)
- Introduced changes based on acquired data. Some keywords were removed, some long-tail keywords were enhanced and updated for relevancy.
- ASO text metadata updated to contain every important keyword from the buying list.
Grand total
Overall money saved: $9820 a month.
Thanks to traffic buying and Mobile Measurement Partner (here we used AppsFlyer’s stats) data, the install price for each particular keyword is available to you and the data on every cohort can be worked with. ROI, LTV, and Retention rate can be calculated accordingly.

Source: AppsFlyer, Apple Search Ads configuration
Every keyword’s meaning and effectiveness can now be measured and used to improve ASO. The user acquisition campaign has been shortened and there was almost no dip in traffic. The app maintained the positions and the reduction of paid traffic has been compensated by an increase in organic traffic.
The coordination between ASA and ASO increased organic traffic growth by 21% during the active users acquiring (see timeframe 1 and 3 above, the install rate grew from 720 a day to 876 a day). The app’s ranking on many keywords grew as well. All this, in turn, allowed to lower the active users acquiring from ASA and compensate less paid installs with more organic installs (see again timeframe 4 on the graph above).
Natural boost in-app ranking resulted in 131% growth for organic traffic (see timeframe 1 and 4, 720 daily installs rose to 1665 daily installs). Daily paid traffic acquisition saving now stands at $316.8 and $9820 a month. If we are to consider the additional organic growth (+945 installs/day) within potential spending on traffic buying, we get a possibility to save $46872 a month.

Dynamics
Timeframe 1:
- Search - 720 installs/day
- ASA - 303 installs/day
Timeframe 2:
- Search - 660 installs/day
- ASA - 0 installs/day
Timeframe 3:
- Search - 876 installs/day
- ASA - 1293 installs/day
Timeframe 4:
- Search - 1665 installs/day
- ASA - 105 installs/day
Bonus
ASA campaigns also allow you to test app screenshots and affect your conversion rate.
Summary
Should it come to pass that your ASO specialist does nothing but try new keywords out, it could be you’re not letting them do their job or you’ve got a wrong person on board. Optimization is a joint effort within the marketing department, and must not be taken lightly. Boost your product reviews with the right amazon product review software. And don't forget to unlock the power of a high application rating!
Still think ASO is a waste of time? Shoot us a message to aso@appfollow.io and let’s chat about it.


