The Guide to using a Competitive Matrix for Mobile Apps


Table of Content:
It’s often spoken about the app stores becoming increasingly competitive marketplaces. It’s getting harder for apps to differentiate themselves from others in their category and gain market share, or simply keep what they have. As with any space that’s growing exponentially, it’s silly to try and develop solutions whilst blind. The app stores are definitely spaces seeing exponential growth — with the total number of apps in the Apple App Store increasing by 1.2 million in just 4 years.
To either keep your share of or enter an app category now, you need to have a good understanding and view of the other players in your space. Conducting market research is a good first step in understanding the industry, but it isn't enough.
So what step do you take next to achieve this knowledge? You need to use a competitive matrix.
What is a competitive matrix?
A competitive matrix allows you to unpick your competitors' strengths and weaknesses, or new opportunities for you to get an edge and find differentiation. The ideal way to visualize the competition in your market is by putting it in a competitive matrix. It can be used, for example, by marketing teams to figure out differences in visibility and reach for market players or by product managers wanting to find differentiation between features and product performance.
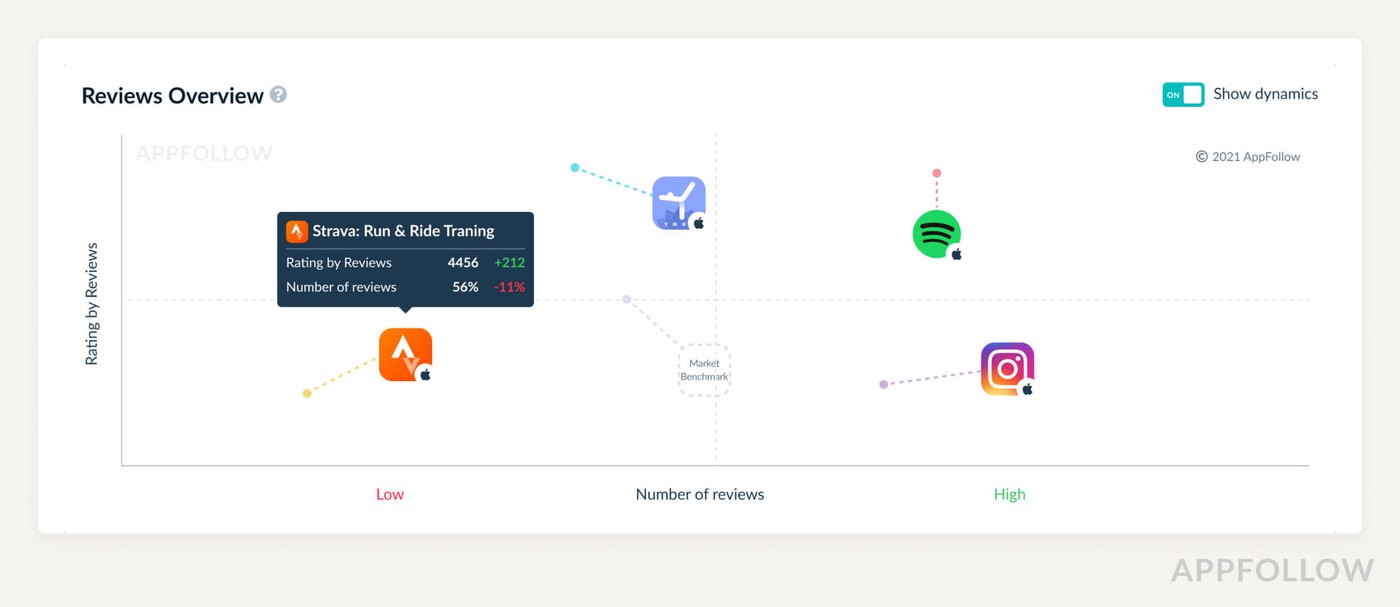
Of course, there are a variety of competitive matrices, from the simple chart comparing features to more sophisticated frameworks that map the positions of each product or company for a particular aspect of the market. For apps, you could, for example, have a competitive matrix on the visibility of all the leading apps in the market, or on rating by reviews (as shown above).
Platforms like AppFollow provide matrix charts for a variety of factors, including one which shows where both you and your competitors' apps sit in regards to search visibility and total ranked keywords on the app stores.

This example from AppFollow's Compare discovery dashboard is what's called a Competitive Landscape Matrix — The positions of the apps here are determined by how visible they are through organic search. Based on their total ranked keywords and Search visibility, an app on this matrix can either be a 'Visibility Leader' or 'Not Visible in Search'. The ideal is for your app to be at the top right of the matrix, which will be when you’ve been the most successful in your market at being visible and you rank for the most keywords.
Of course, you can also create your competitive matrix on programs like Google Sheets or Excel. This may be useful to do if you're aiming for something like a Feature Comparisons Matrix. However, the process is very time-consuming — not only do you have to spend time manually putting data into the sheet, but you have to source all of it too. Manually choosing data for matrices may also fall into the cherry picking trap and become too subjective and warped — thus, not showing the true state of the landscape.

Software like AppFollow sources all the data you need to tell the true story in an easy-to-use interface. It also provides you with various competitive landscape matrices created automatically from your data, so you can focus your time on the analysis, as seen above.
What is the use of a competitive matrix?
The value you get from using a competitive matrix is potentially huge. It provides you and your team a helicopter view of the market landscape — who sits where and why. The result? You'll have a clear picture of where you stand compared to your competitors and understand what needs to be prioritized in your strategy.
The value for product
Let's say you have an app with a user base, and it's doing well in some areas. However, you've lost some customers to a competitor and are struggling to figure out what features or improvements you can make to differentiate your app and win back that portion of the market. You also want to improve the app usage of your current user base — to keep them longer in the app or return more often.
A competitive matrix can help you figure out the strengths and weaknesses of both your app and your competitors regarding performance and features. This will allow you to pinpoint where you should be putting your time and efforts into the product roadmap.
But where do you find the insights needed to fill a competitive matrix? One rich source is user feedback for you and your competitors. Alongside this is of course social listening, which can be done via products like Brandwatch, that allows you to monitor what is being said about your product across the internet. These methods used in parallel will provide you with more than enough insights to build out your competitive matrix. But to get the most out of them, you first need to conduct a competitive assessment (or competitor analysis).
Performing a competitive assessment in product strategy
To start a competitive assessment, begin with the research and planning phase, which involves:
- Defining what you want to find out from the assessment.
- Figuring out what data you require to assess accurately.
- Choosing your main competitors — who you want to beat.
Then go on to the next phase of the assessment:
- Collecting & categorizing key product-related data.
- Creating competitive profiles for each competitor.
- Analyzing and deciding what to prioritize for the roadmap.
You need to know how your product's performing compared to competitors and what users are saying about them. Their user reviews are a great source of insights and when analyzed correctly, can provide those crucial revelations which you can put into the competitive matrix.
But how do you monitor and collect this data effectively?
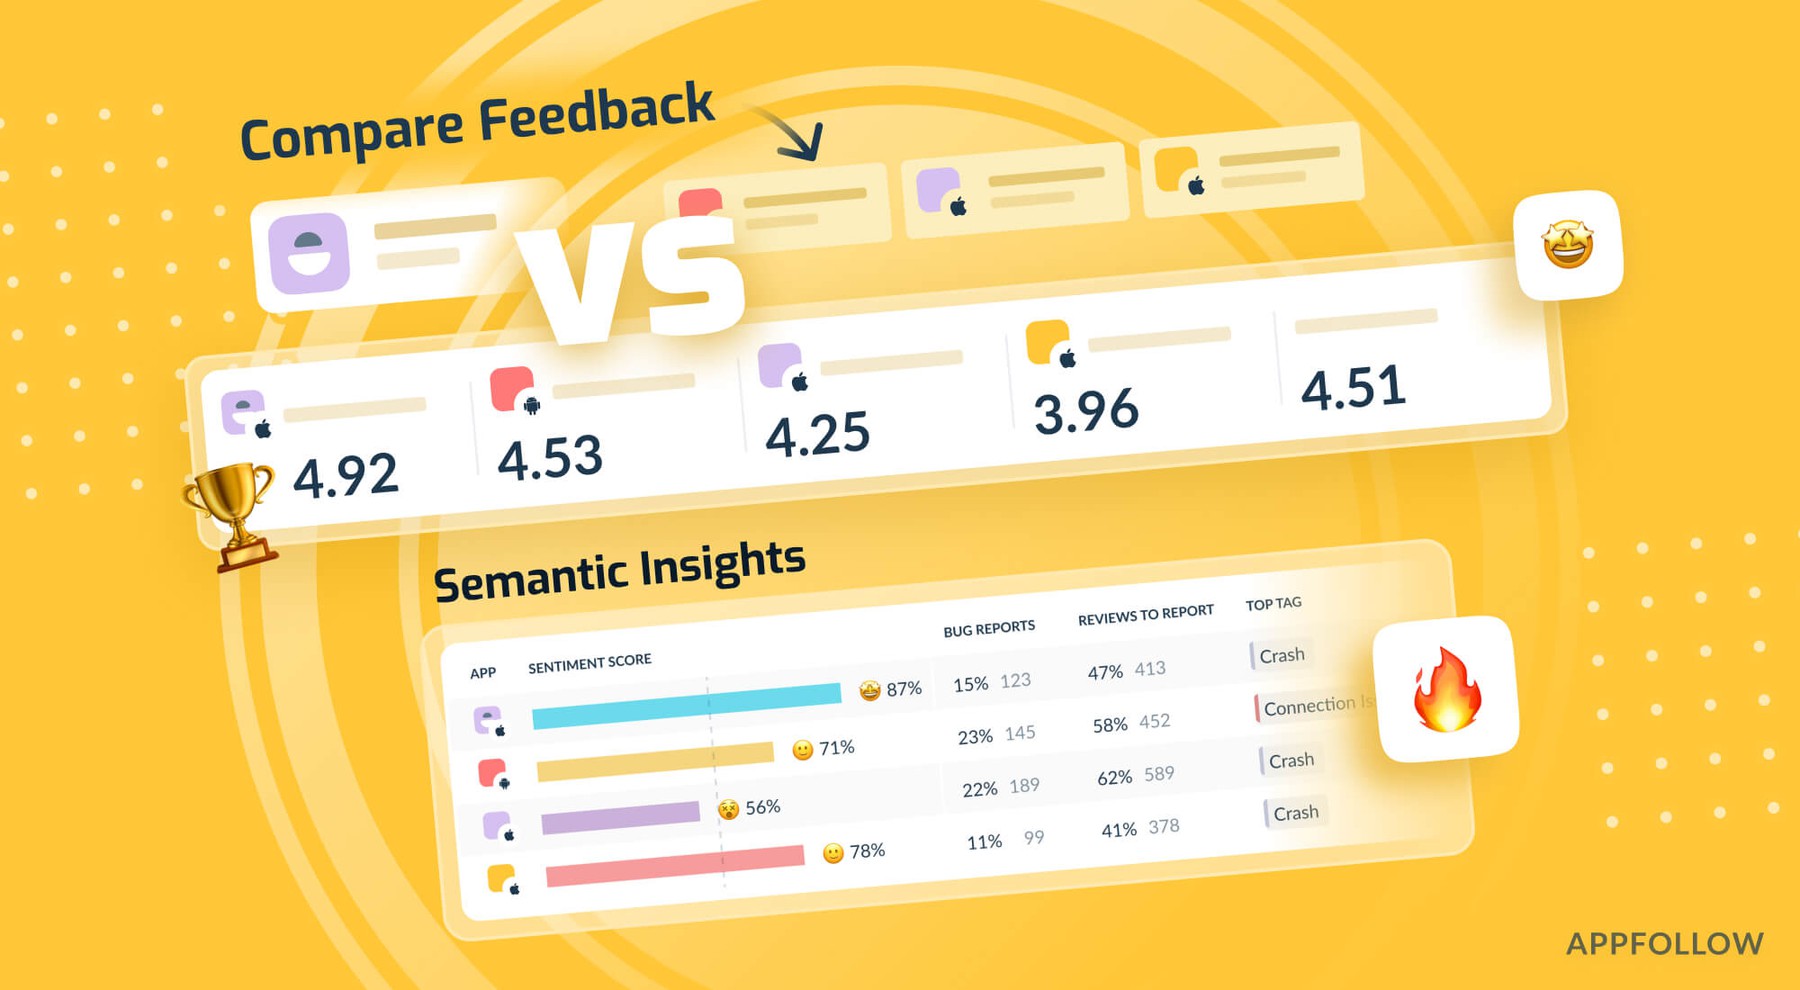
Solutions like AppFollow's Compare feedback tool gives you access to industry benchmarks for app reviews and your market position, as well as how they compare to those of your competitors. But most importantly, it allows you to effortlessly compare across your market differences in:
- sentiment scores
- satisfaction levels
- bug reports

You can also compare user feedback and customer experience across markets and regions. It helps you better understand the competitive app landscape and is the perfect tool when performing a competitor analysis. You'll have the ability to understand responses to competitors' features releases, common feature requests, and the types of bugs reports. This helps you to develop the things which your competitors' users are seeking. Learn more about Compare feedback here.
The value for marketing
As a marketer, you're responsible for developing and executing a strategy to cultivate growth. But it's not always easy to target users and compete without having an understanding of where things stand in regard to market share. This is what you need to find out through a market competitor analysis.
Competitive assessment checklist for your app’s growth strategy:
- Who the market leaders are across geographical markets.
- How impactful the brands are in attracting organic traffic (brand power).
- Brand store performance— Search visibility, Ratings & Reviews, featuring & updates.
- Traffic distribution & reach across non-branded Search.
These factors can be tracked and compared through competitor analysis. With tools like AppFollow's Compare discovery, you can analyze your app's market regarding performance insights and uncover market trends.
At the same time, by using AppFollow’s Compare feedback tool, you’re able to find insights about competitor apps from their users in reviews which you can leverage in your marketing campaigns and advertising.
For example, let’s say during your competitor analysis, you find that several of your competitors have many users complaining about poor customer support in reviews. This is a key opportunity to put into your competitive matrix and compare competitor profiles. If possible, you can harness what you find by including it in your marketing messaging — that your company offers stellar customer support, which may encourage some users to switch over to your app.
What makes up a competitive profile matrix (CPM)?
A competitive profile matrix - or CPM for short - is the construction of the market landscape based on the strengths and weaknesses of each company profile. It's a great way for a company to learn about the external factors that could impact their growth and the state of rivals in the industry. But what do you include in a CPM?
- Critical Success Factors: though these factors will change according to industry/market, they are the key things that a company has to excel in to be classed as a market leader. What does your company need to do better than competitors to achieve growth? Include those here.
- ‘Importance’ Weighting: not all factors are equal. Some will have more of an impact on a company’s success or failure. Weighting works quite simply — the total weight of all factors must come to 1.0 and range factors in weight from 0.0 (very low importance) to 1.0 (significantly important).
- Success Rating: this is how well each company in your matrix is doing for each factor. If a company is really strong in a certain factor, they’d get a rating of 4 on a scale where 1 means a factor is a major weakness. The best way to figure out success or failure is to mix your common sense of the industry standard with market benchmarks that can solidify an average.
What to include in your competitive benchmarking analysis
For mobile apps or digital products generally, there are a variety of metrics to keep in mind for benchmarking or to closely track while conducting a competitor analysis for your app’s market. What you choose depends on what you want to find out.
Competitive benchmarking examples for online brand reputation
Does your app give a good impression to prospective customers? This involves how well a company deals with issues, bugs, or feature requests and communicates changes to customers. The 'reputation' of an app is determined by reviews, ratings, and levels of satisfaction of its customers. So the metrics to track for you and your competitors regarding this factor are:
- Average rating by reviews: your rating average for those with reviews only.
- Average rating: the average rating of your app.
- Sentiment score: overall user sentiment: correlation between your negative and positive reviews. The higher the score, the happier users are.
- Reply Effect: the change to a review after it gets support.
- % Updated: the share of reviews that were updated.
All of these metrics can be measured and compared to competitors right from AppFollow’s Compare Feedback tool.
Competitive benchmarking examples for product development
You need to know how your competitors are doing in regards to dealing with product performance, what their customers are saying and feeling, and what their strengths and weaknesses are. The crucial metrics for these purposes are:
- Bug reports: the share of reviews with the Bug topic tag.
- Sentiment score: overall user sentiment: correlation between your negative and positive reviews.
- Most common review topic: the topic most commonly tagged in reviews.
- Average rating: the average rating of your app.
- % Updated: the share of reviews that were updated.
All of these metrics can be measured and compared to competitors right from AppFollow’s Compare Feedback tool. There may be value in setting benchmarks for some of these in order to set clear goals for your team to hit as a progress milestone.
Competitive benchmarking examples for growth marketing
To increase organic traffic and user acquisition, you need to be able to show what’s unique or special about your product or service. In highly competitive spaces like the app stores, communicating unique selling points is crucial to marketing success. You need to also keep your finger on the pulse of category ranking and keyword positions for both your and your competitors.
In regards to comparing growth rates, there are some metrics you need to keep in mind for tracking or benchmarking during your competitor analysis:
- Store Performance Index: a combined calculation of visibility, ranking, average rating, and review response for each app. The benchmark provided is the 'industry standard' for your market.This is automatically measured by AppFollow for your easy monitoring and tracking, as shown below.
- Brand Power: the goal is to have a high percentage of brand power, as this indicates a lot of branded traffic and a strong brand. The benchmark provided can be used as the 'industry standard' for your market.
- Search Visibility Score: how well apps are optimized for organic traffic and how visible they are in search.
- Ranked Keywords: the total number of ranked keywords for each app. This is used in AppFollow’s Organic Discovery Performance matrix.
- Category Rank: changing in ranking for apps in a specific category over a period of time.
- Gross Ranking: changes in ranking according to revenue gain.
- Organic Discovery Performance: a calculation of Search Visibility alongside total Ranked Keywords for each app. This measurement forms the Matrix from the AppFollow platform below:


No matter what metrics you pick, they can help you figure out how to populate your matrices to get an accurate picture of the competitive landscape. You can also use AppFollow’s performance matrices to understand differences in customer experience and store performance for you and your competitors. By being able to leverage this information about competitors, you’ll have a clear image of the road ahead in becoming an app leader for your market.
Want to find out more about AppFollow's Competitive Matrix tools?
Feel free to book a demo with our sales team, and they’ll be happy to give you the tour. If you’re already one of our clients, please reach out to your dedicated success manager.