Ratings & Reviews performance provides an overview of what users think of your app. Here are the key metrics to help you identify how your app is rated by users and how successful is your review management strategy.
User reviews affect conversion to installs and app rating. Featured and helpful reviews are the first to be noticed by users and in case of no response can affect download rate.
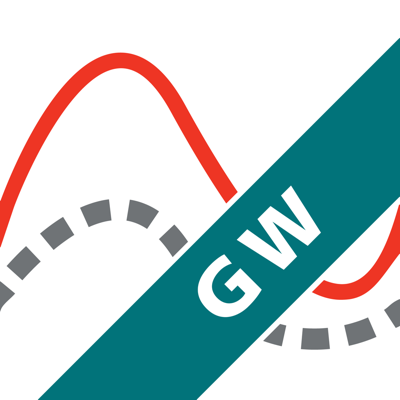
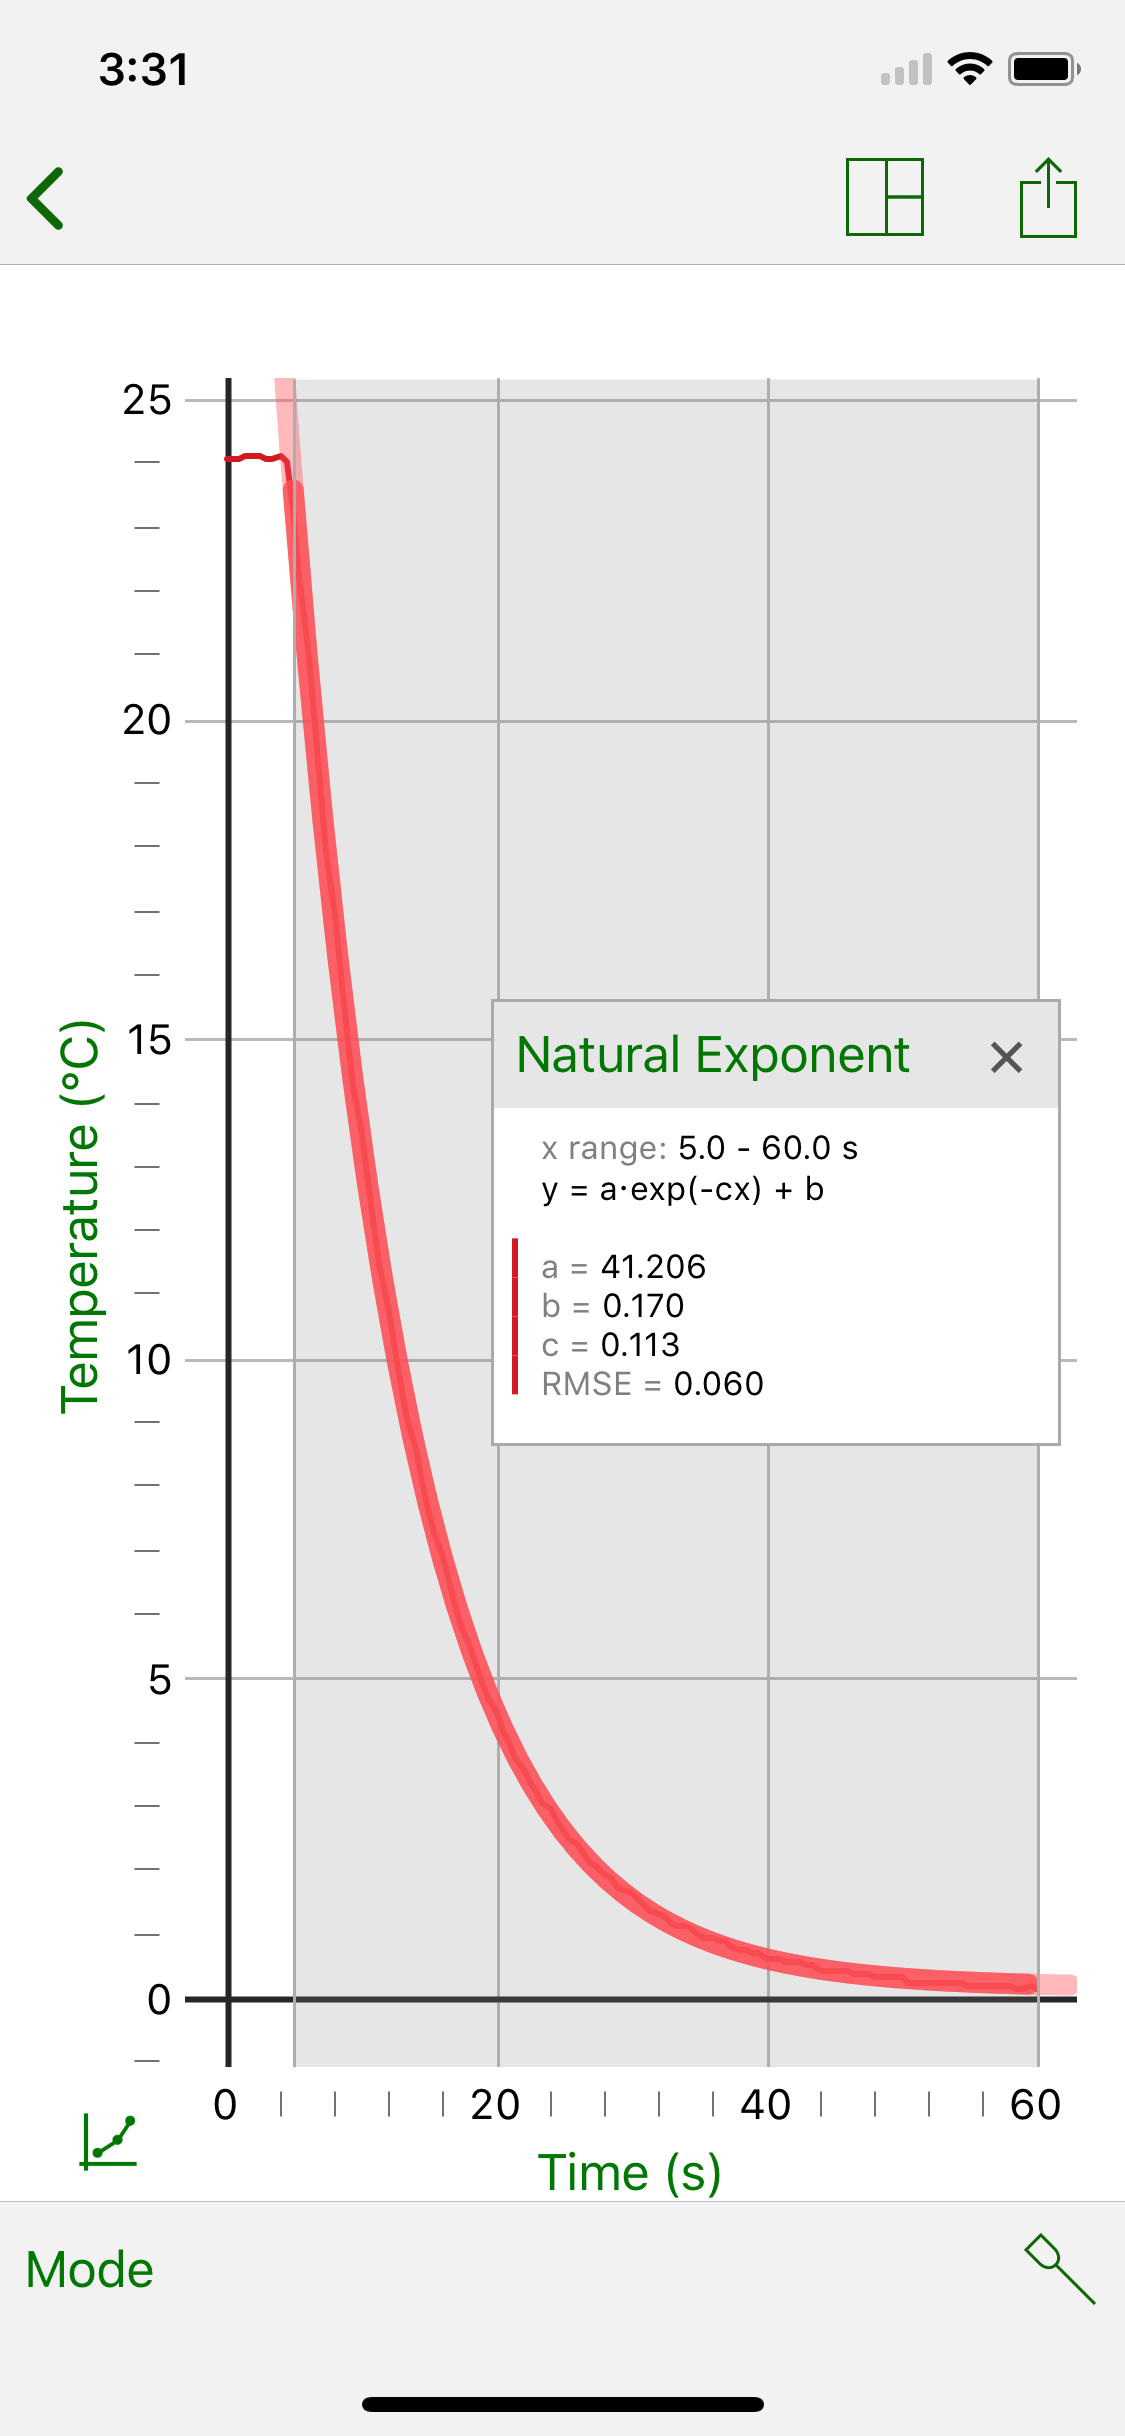
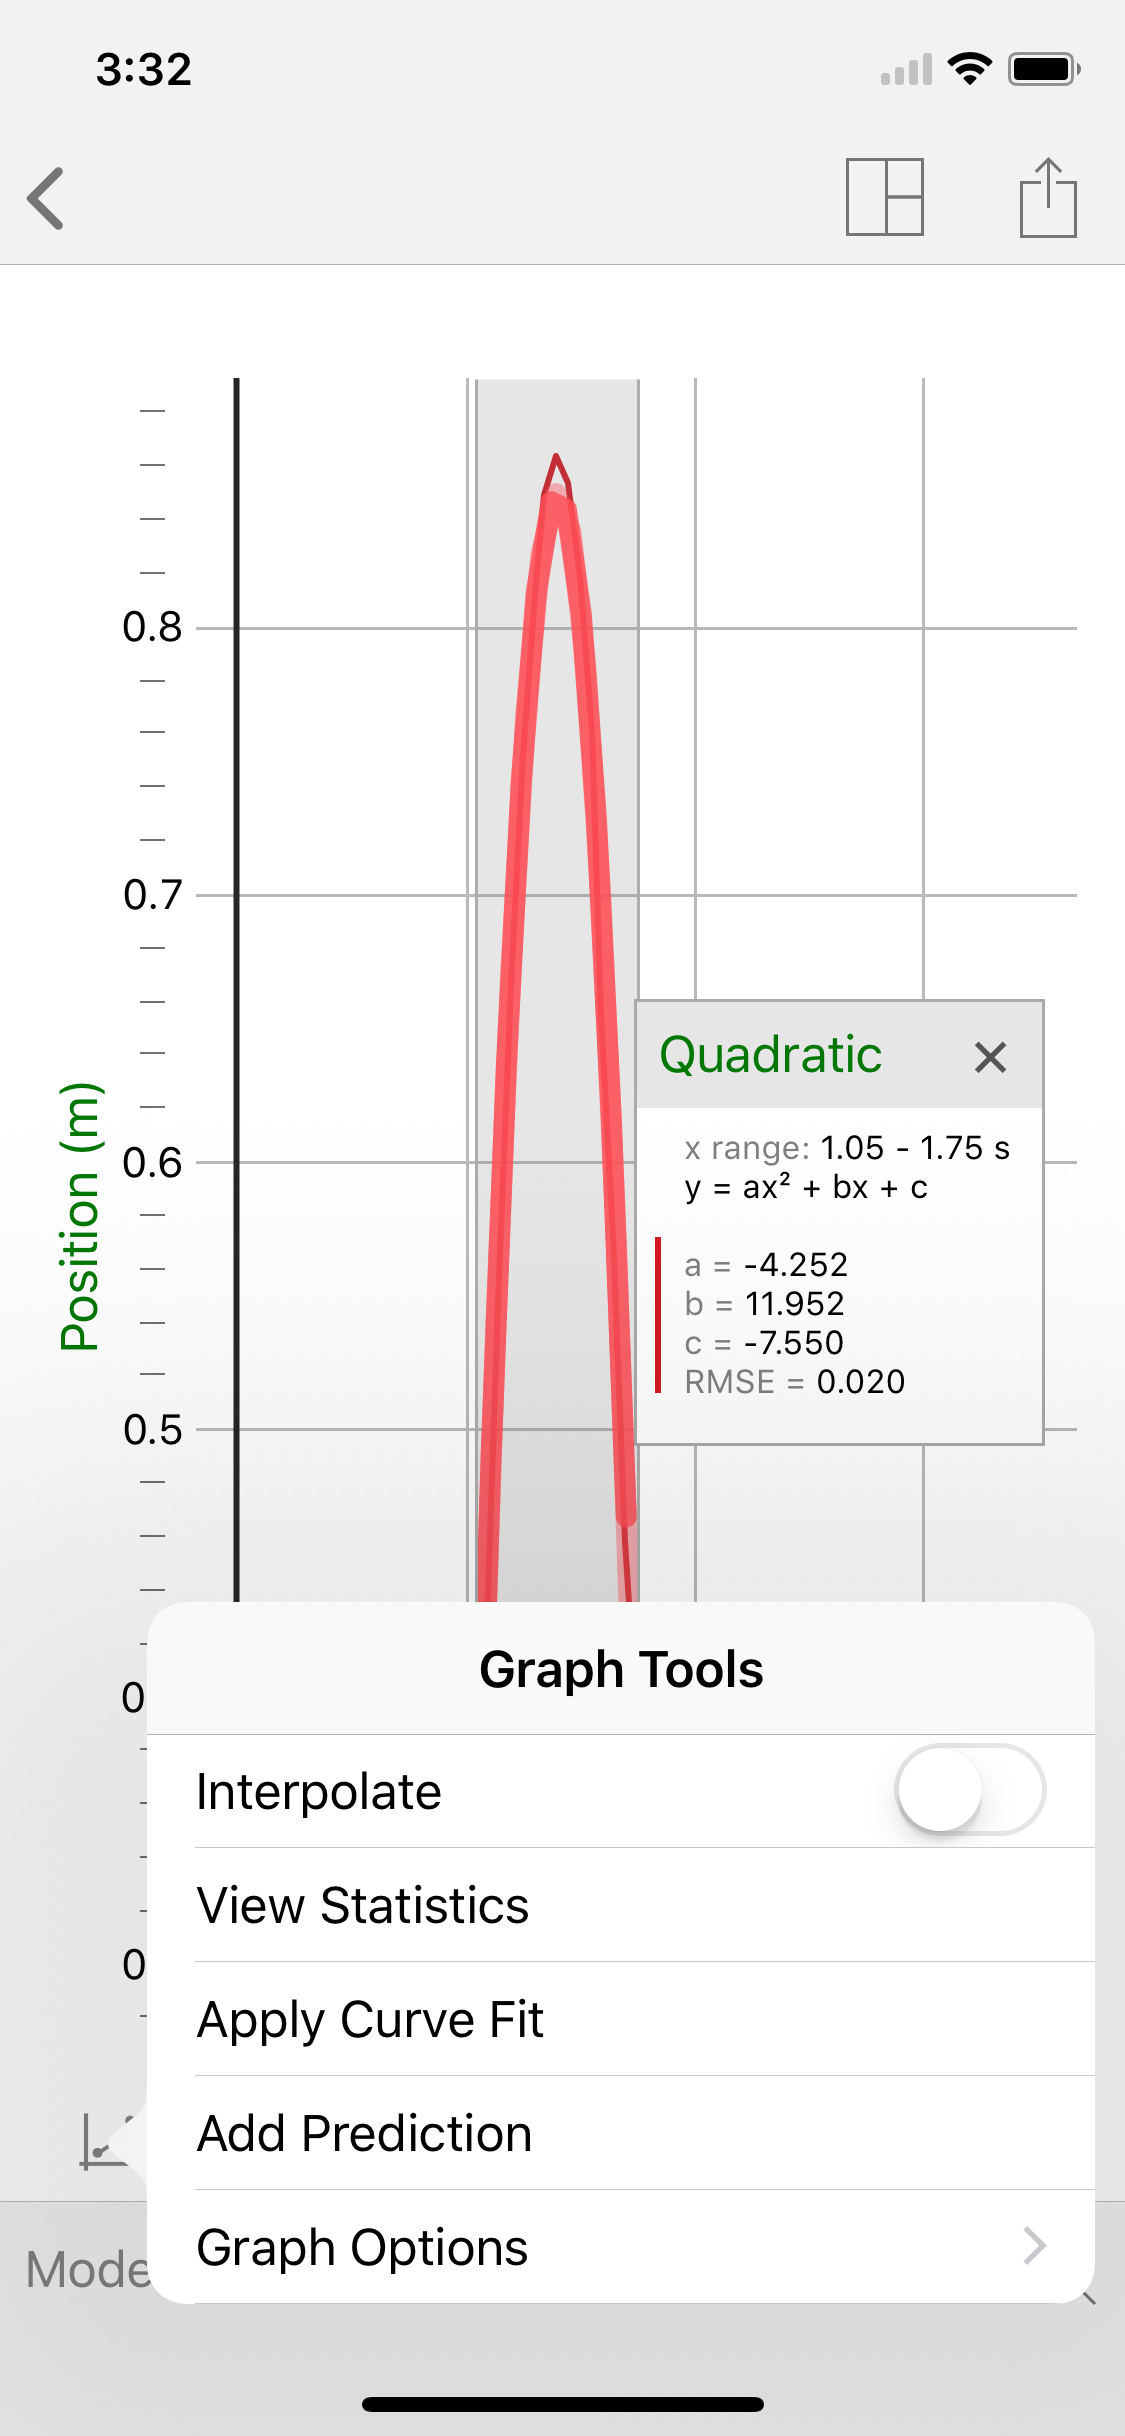
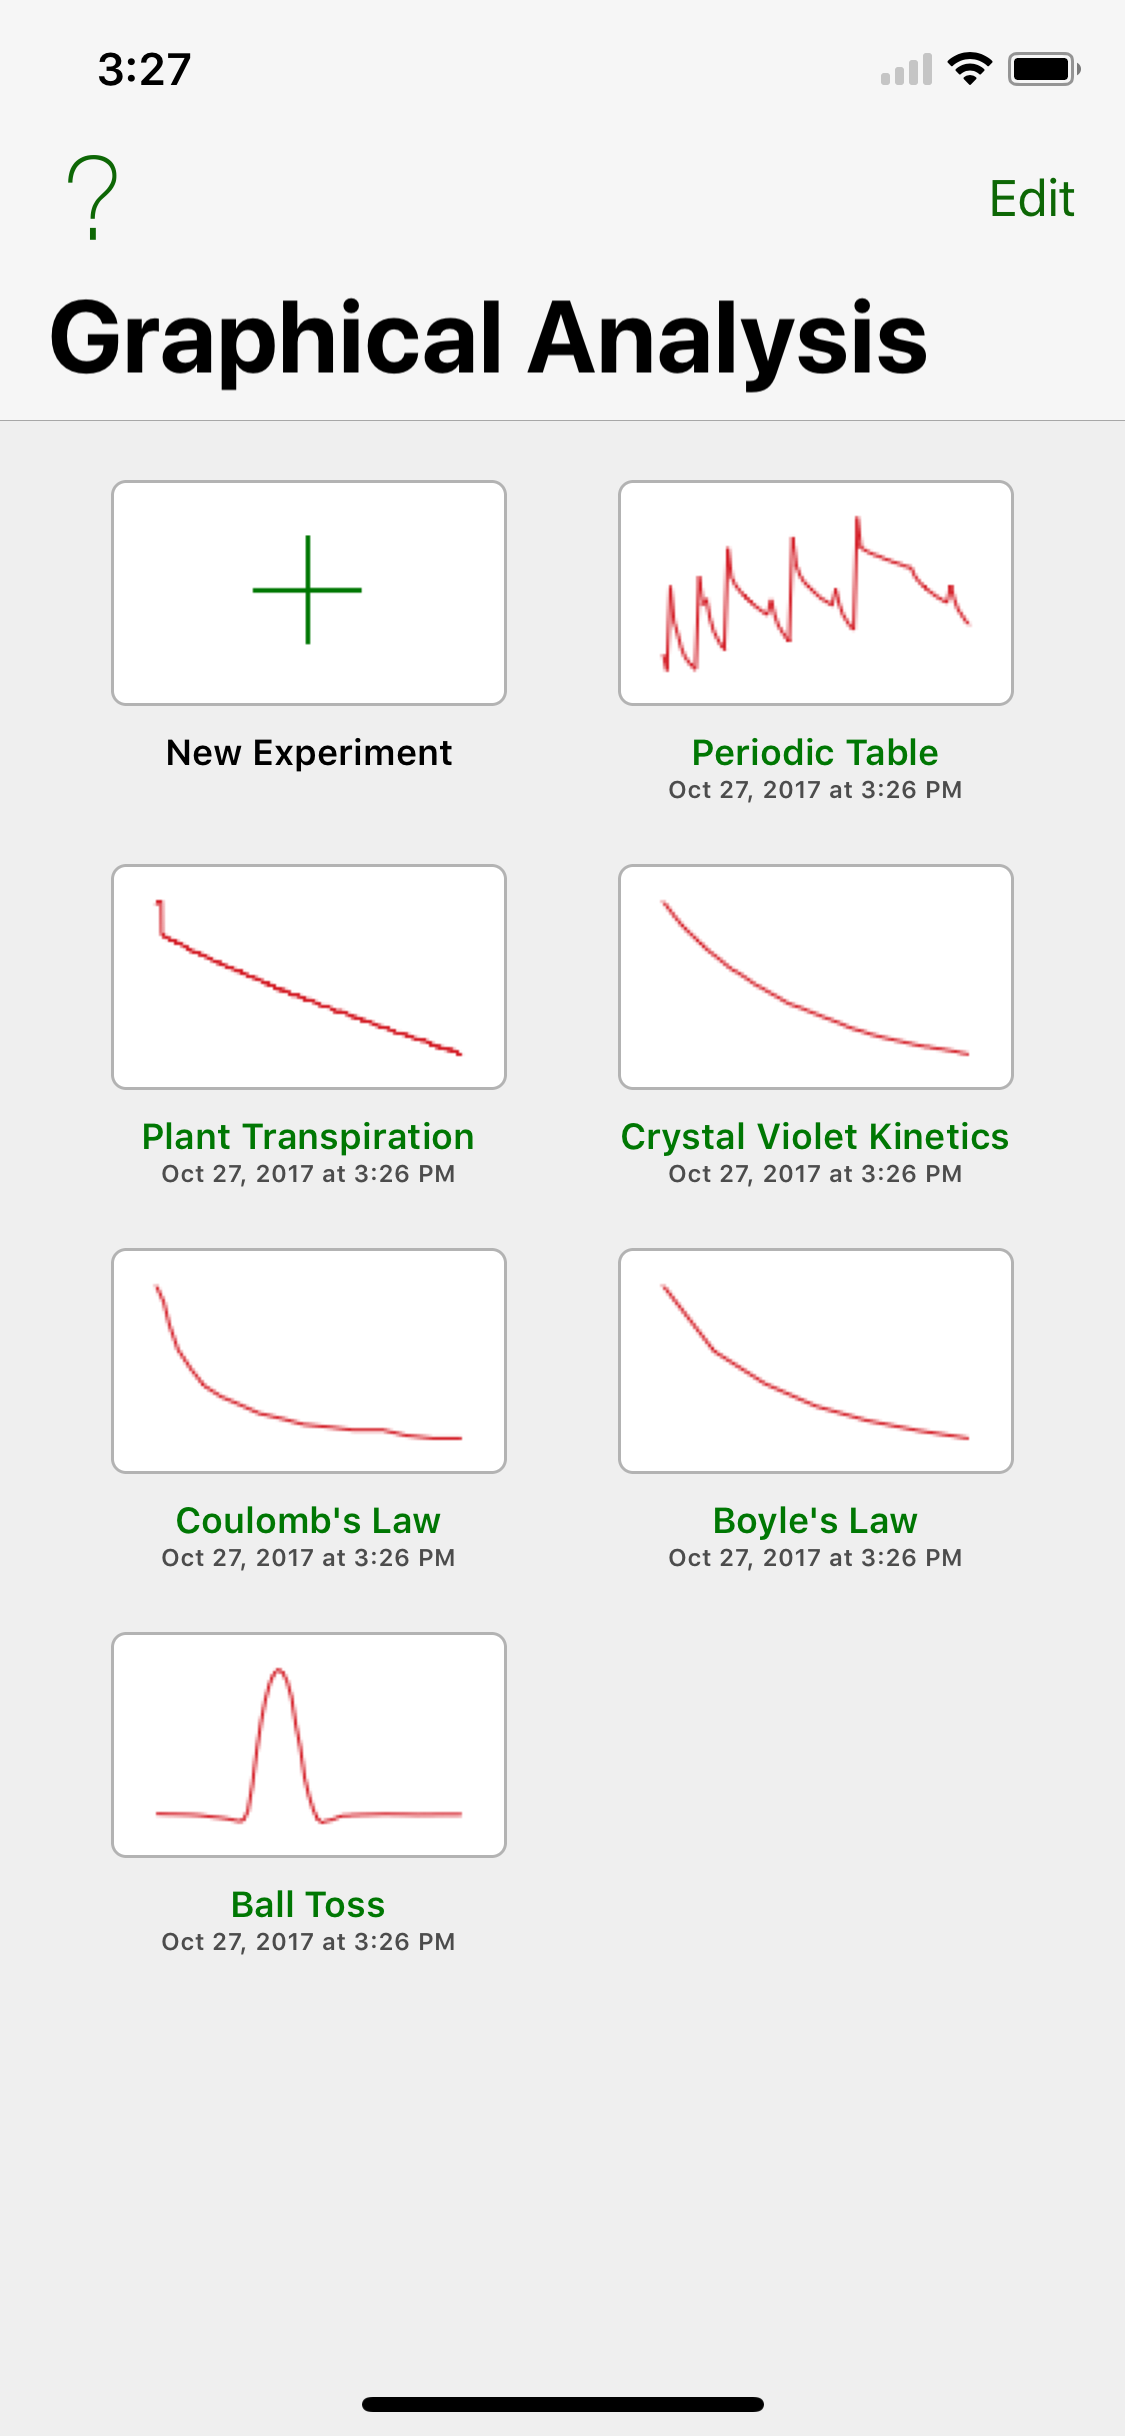
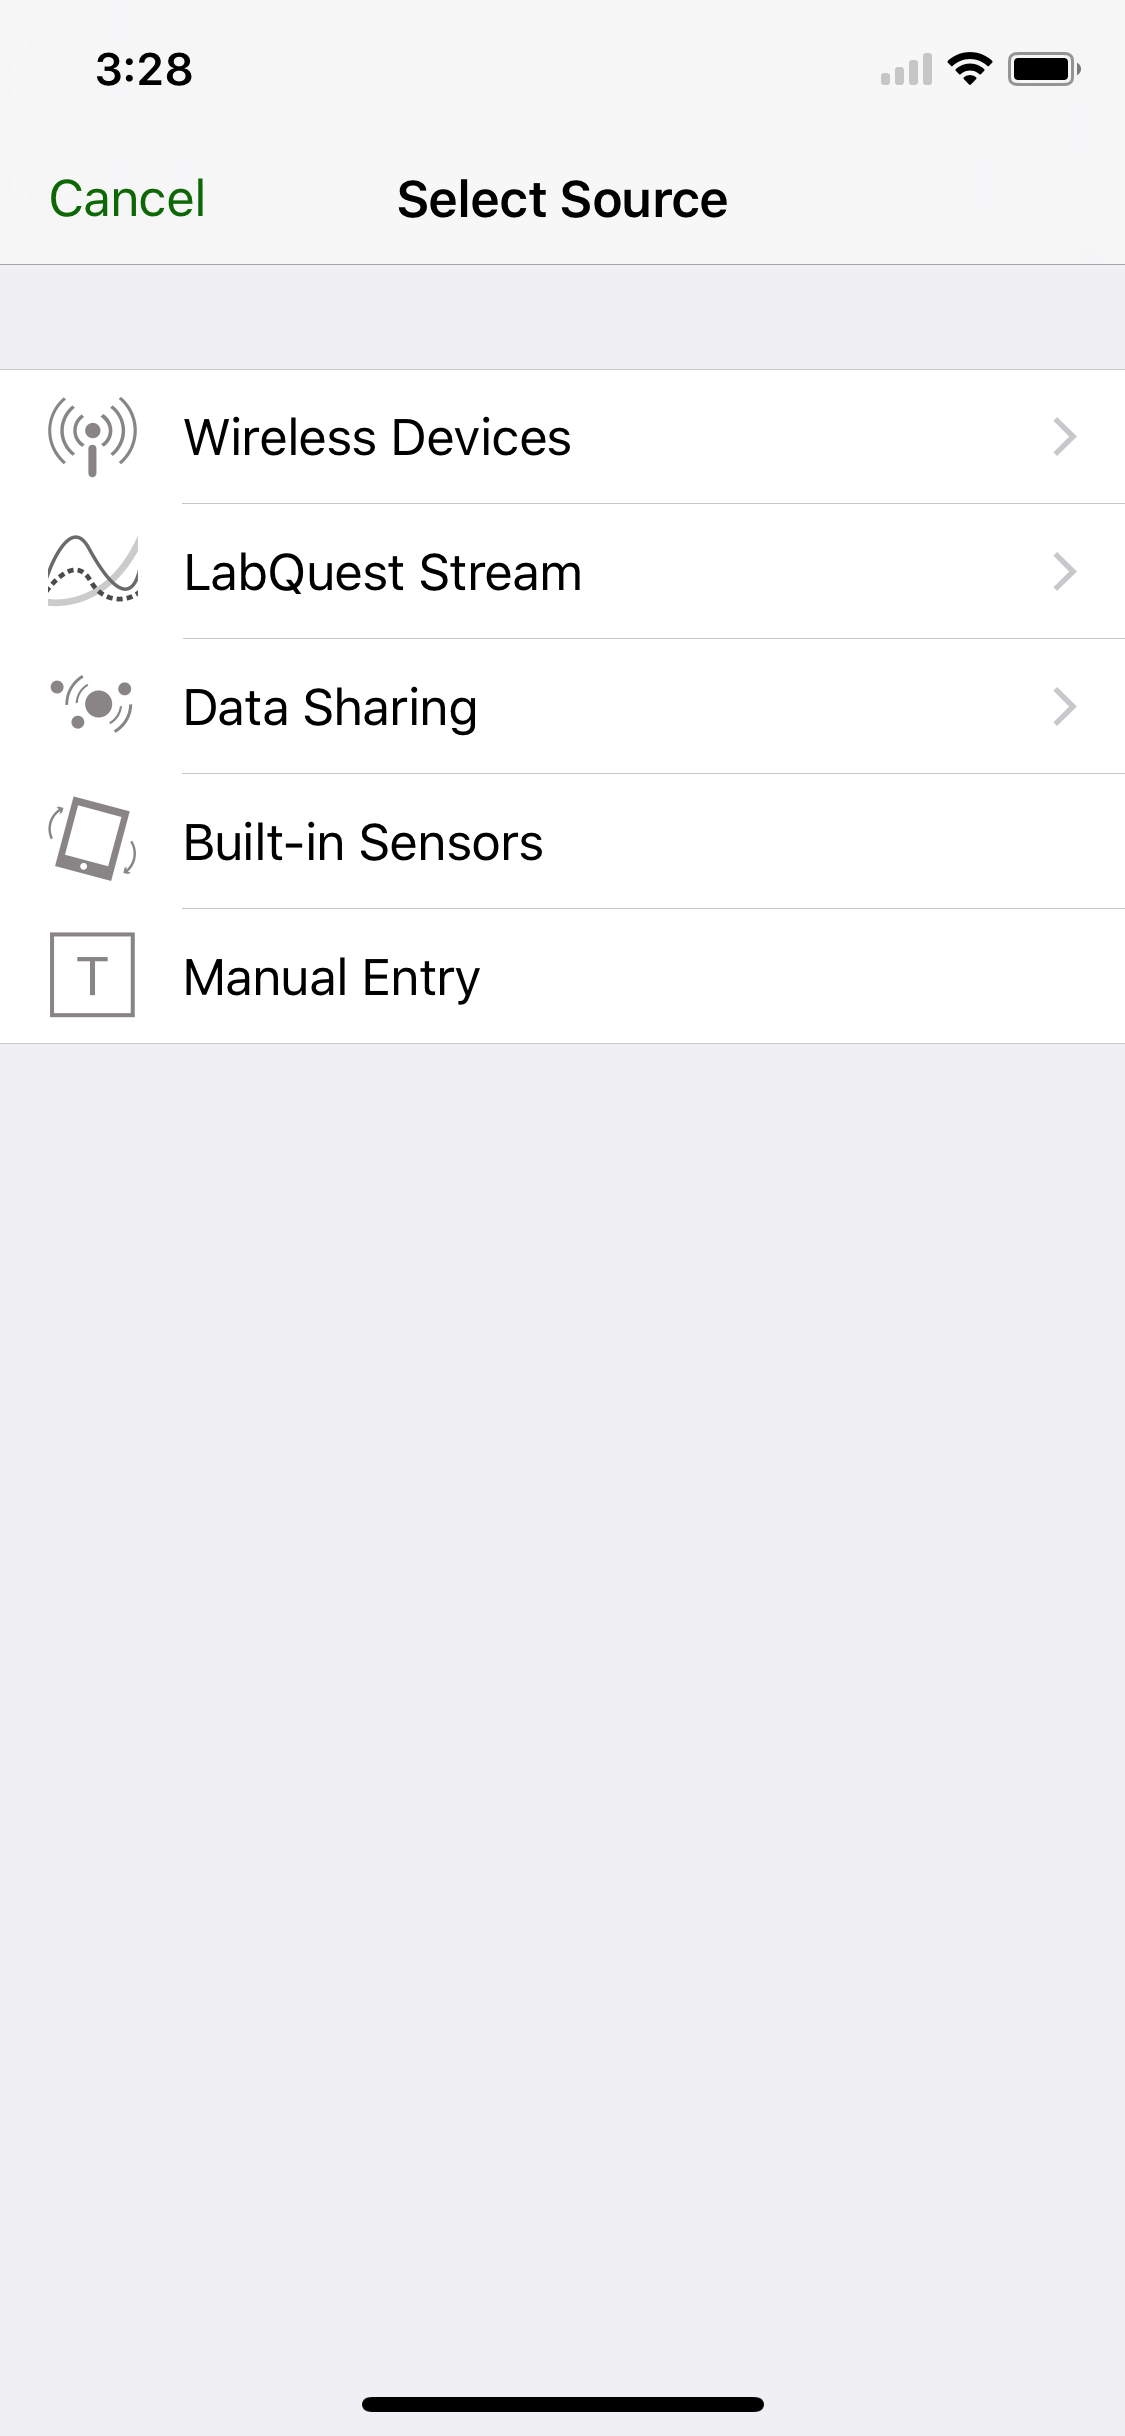
Graphical Analysis™ GW is a tool for science students to collect, graph, and analyze data from Vernier Go Wireless® sensors. Sensor data-collection support: • Vernier Go Wireless® Temp and Go Wireless pH sensors • Vernier Go Wireless Heart Rate and Go Wireless Exercise Heart Rate monitors • Vernier LabQuest® sensors used with Go Wireless Link or LabQuest Stream interfaces • Basic support for some Vernier Go Direct® Sensors • NODE (by Variable Inc.) sensor support Additional experiment options: • Data Sharing via Wi-Fi connection to LabQuest 2 or Logger Pro® 3 • Built-in Sensors (accelerometers) • Manual Entry Note: Sensor data collection and Data Sharing require the purchase of hardware from Vernier Software & Technology. Built-in sensor and manual entry of data can be performed without a hardware purchase. For more information on Data Sharing, visit http://www.vernier.com/css Key Features - Data Collection • Multi-sensor data-collection support • Time Based, Event Based, and Drop Counting data-collection modes • Configurable data-collection rate and duration for time-based data collection • Sensor calibrations • Option to zero and reverse sensor readings • Graph match feature for use with motion detectors • Manual entry of data from keyboard and clipboard Key Features - Data Analysis • Display one, two, or three graphs simultaneously • View data in a table or show a graph and table side-by-side • Draw Predictions on a graph to uncover misconceptions • Examine, interpolate/extrapolate, and select data • Apply Statistics calculations to find mean, min, max, and standard deviation • Perform curve fits, including linear, quadratic, natural exponent, and more • Add calculated columns based on existing data to linearize data or investigate related concepts • Pinch to scale graphs Key Features - Collaboration and Sharing • Add graph titles • Export graphs and data for printing and inclusion in lab reports • Export data in .CSV format for analysis of data in spreadsheet software such as Excel®, Google Sheets™, and Numbers® Vernier Software & Technology has over 35 years of experience in providing effective learning resources for understanding experimental data in science and math classrooms. Graphical Analysis GW is a part of the extensive system of sensors, interfaces, and data-collection software from Vernier for science and STEM education.