Ratings & Reviews performance provides an overview of what users think of your app. Here are the key metrics to help you identify how your app is rated by users and how successful is your review management strategy.
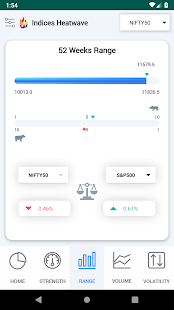
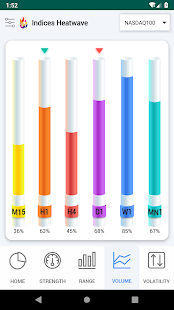
Indices Heatwave Stock market index tool analysis and meter Indices Heatwave Stock market Index trading tools is a financial markets app and AI analysis tool that focuses on the traders tools and parameters that are important for trading as much as the basic movement of the Indices Instruments itself. These complex parameters are simplified in a graphical format and heat map to help traders in split decision making on buying or selling Indexes. The Indexes performance meter app has 5 screens covering 4 important aspects of trading that is Indexes performance, Strength, Range, Volume and Volatility. Home Screen This screen projects the performances meter in an innovative fashion. The live cylindrical tubes movements projects best index performer live at the given time in one glance. Strength Screen The Indexes strength indicator screen of Indices Heatwave app shows the strength and weakness of the Indices in meter format. Range screen This screen shows the current price in comparison to 1 year high and 1 year low. It also shows the bull power and the bear power of the particular index. Volume Screen This screen projects the highest to lowest volume timeframe wise of the Indexes in cylindrical volume format. The highest and lowest volume denotes the maximum and least contracts traded for the Indexes at a particular moment. The green arrow denotes the highest volume from the lot and red arrow denotes the least volume from the lot. Volatility Screen This screen of Indexes heatwave app projects the highest and lowest volatility of the Indexes in the Yo-Yo format. The highest and lowest volatility denotes the maximum and least volatility movements for the Indexes at a particular moment.The green arrow denotes the highest volume from the lot and red arrow denotes the least volume from the lot. Use Indexes stock market tools wisely for maximum gains. Take advantage of this smart Indexes trading stock market tool. Download Indices Heatwave: Stock market indexes tools and analysis meter for FREE!