Ratings & Reviews performance provides an overview of what users think of your app. Here are the key metrics to help you identify how your app is rated by users and how successful is your review management strategy.
User reviews affect conversion to installs and app rating. Featured and helpful reviews are the first to be noticed by users and in case of no response can affect download rate.
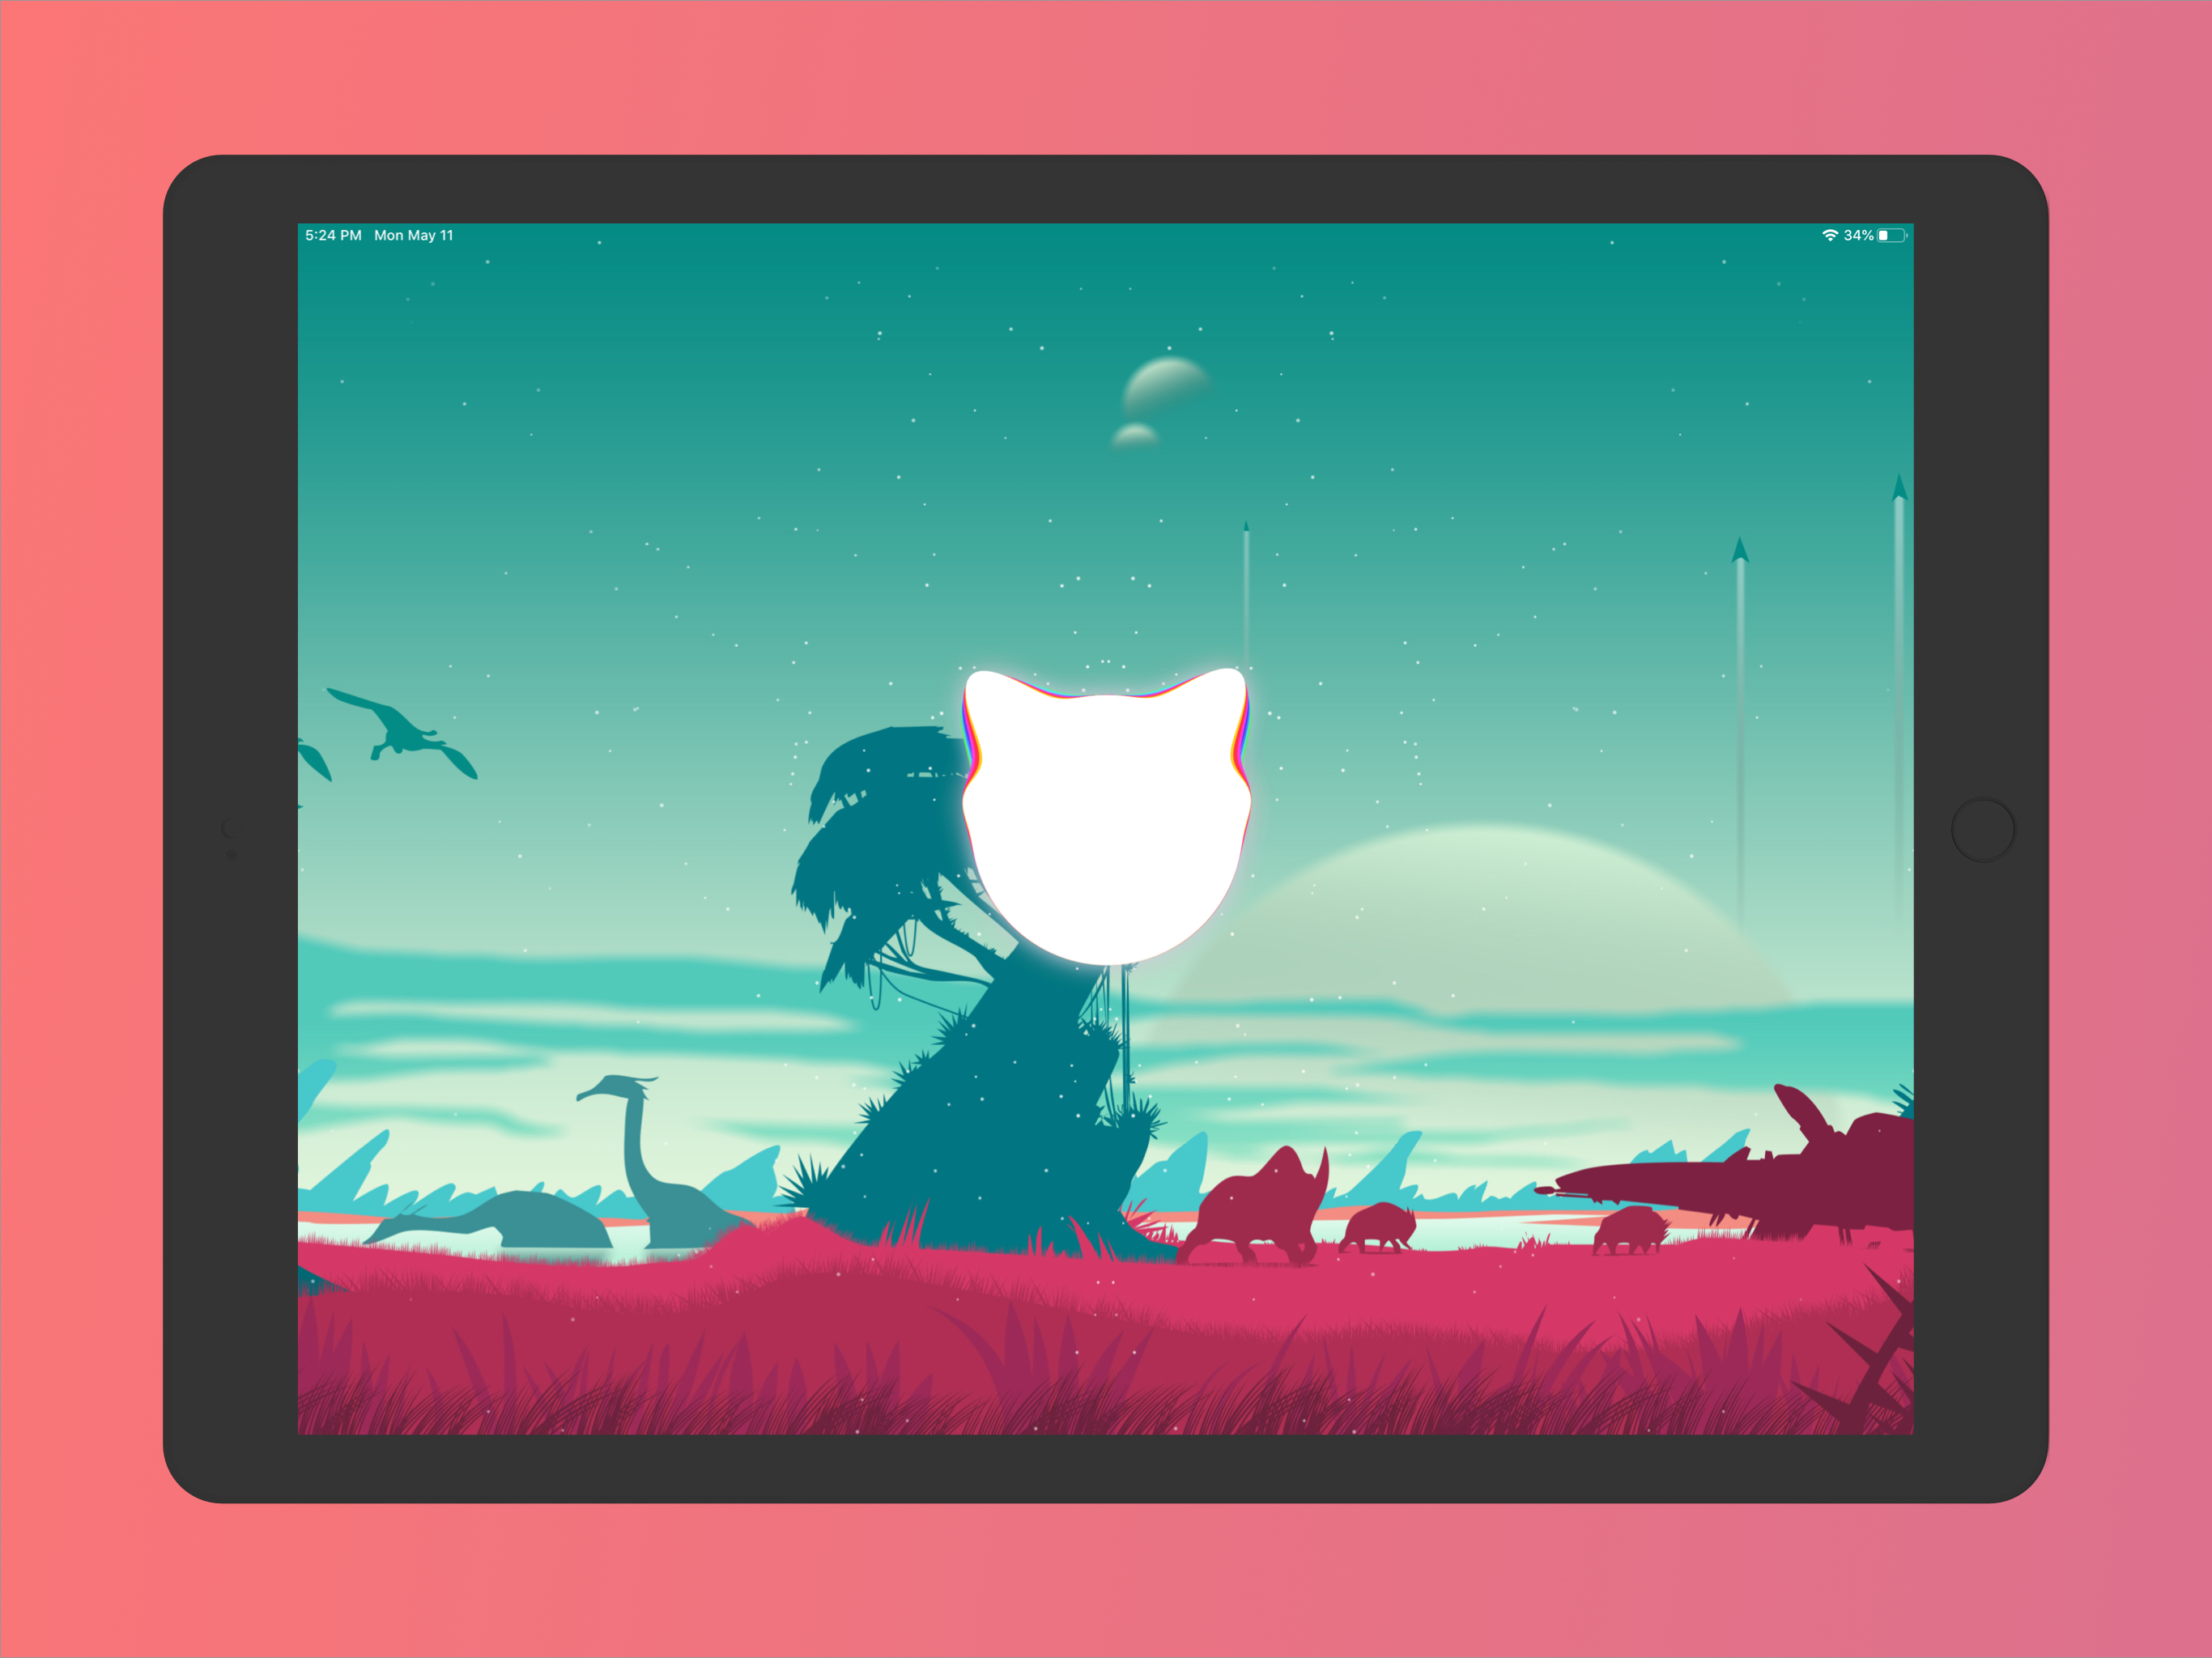
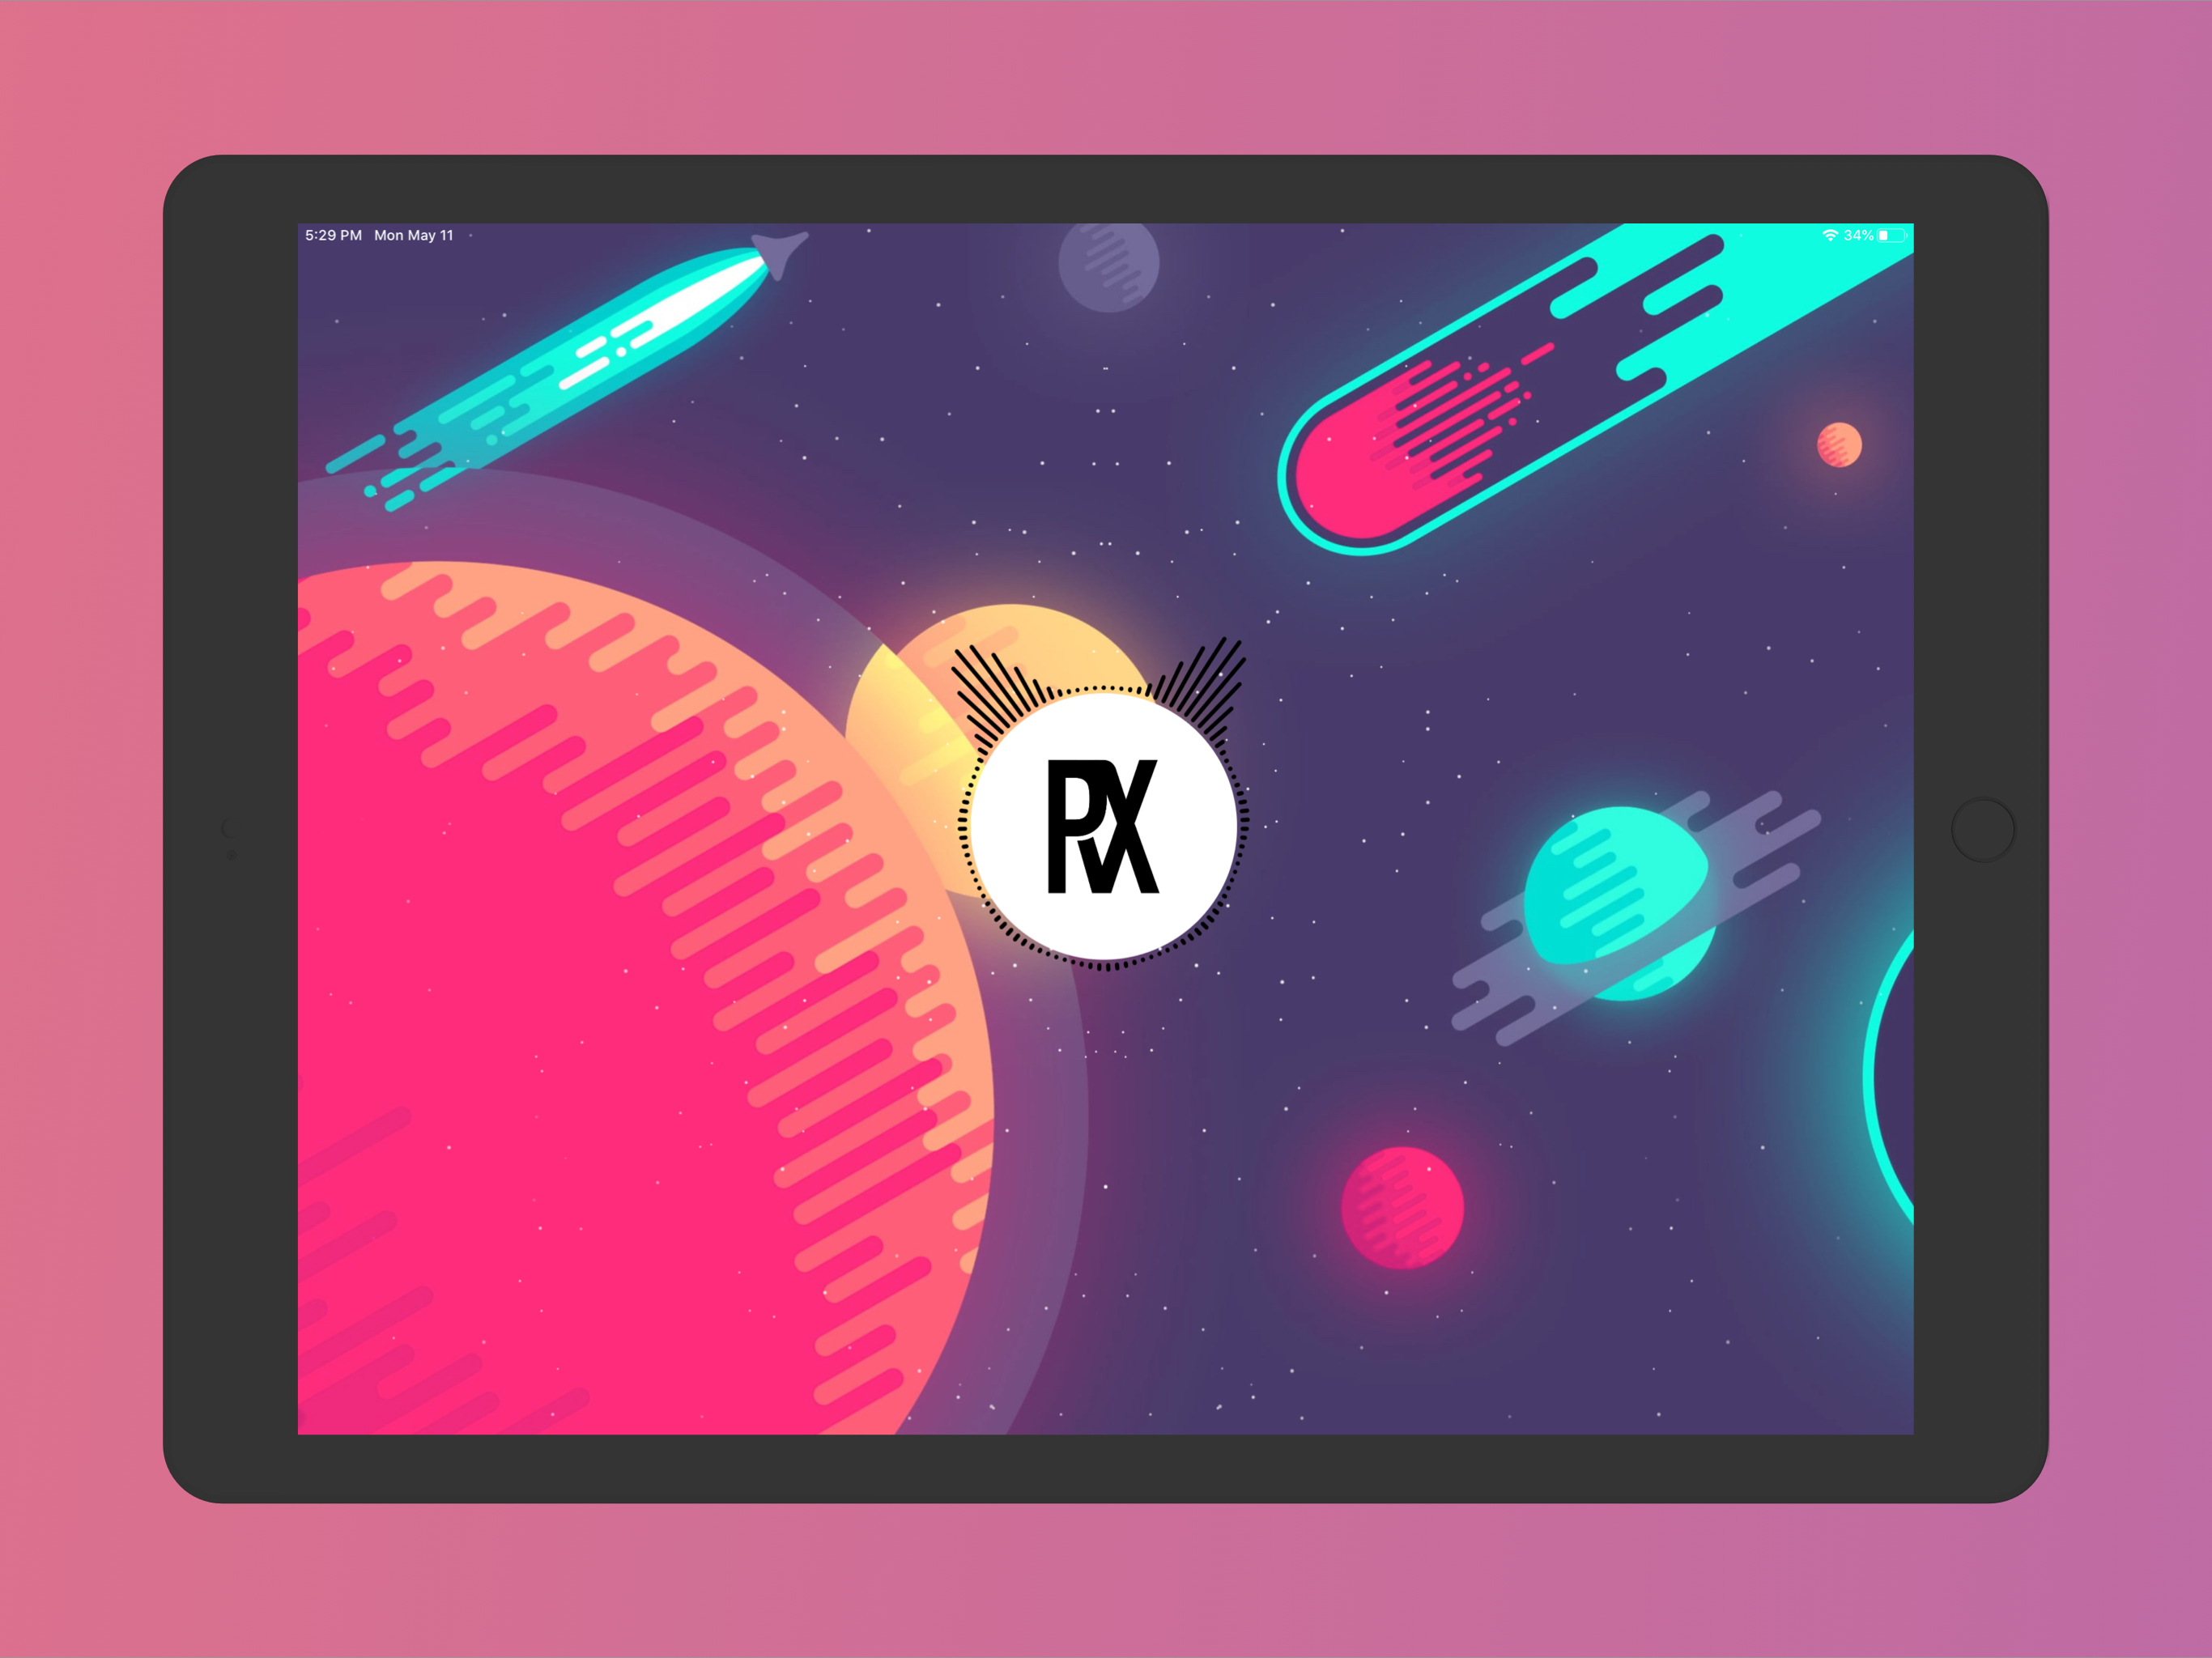
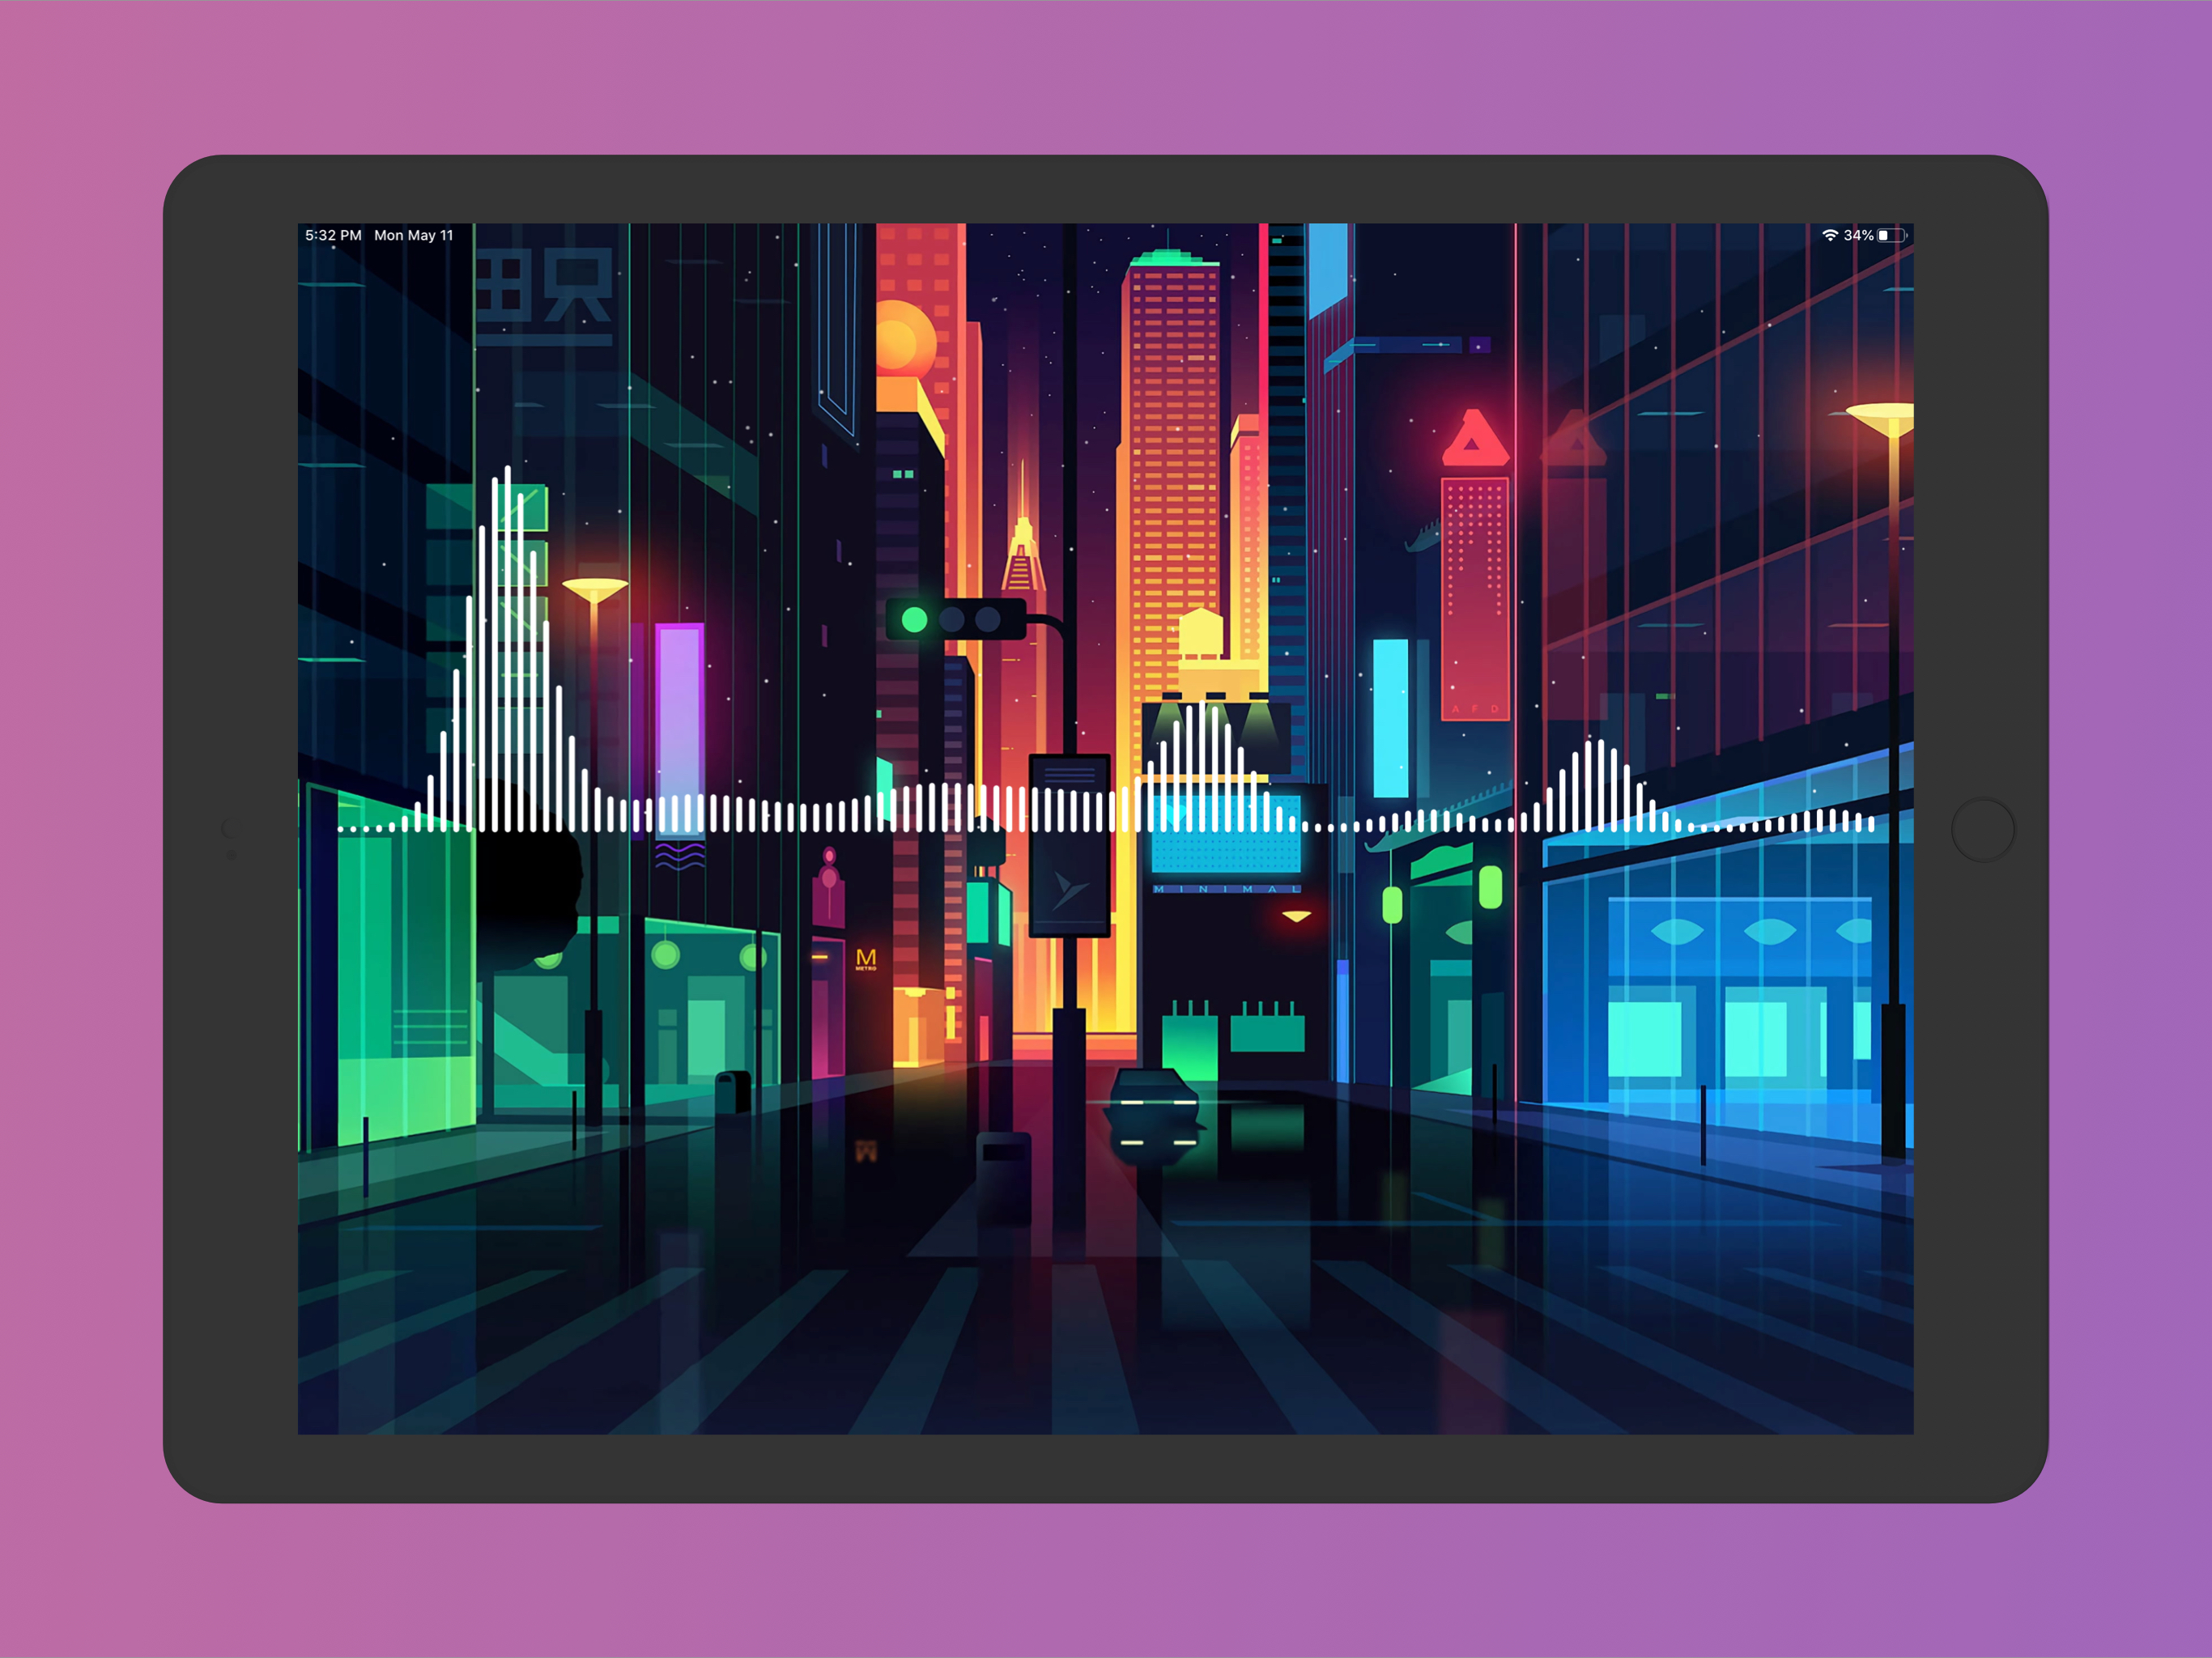
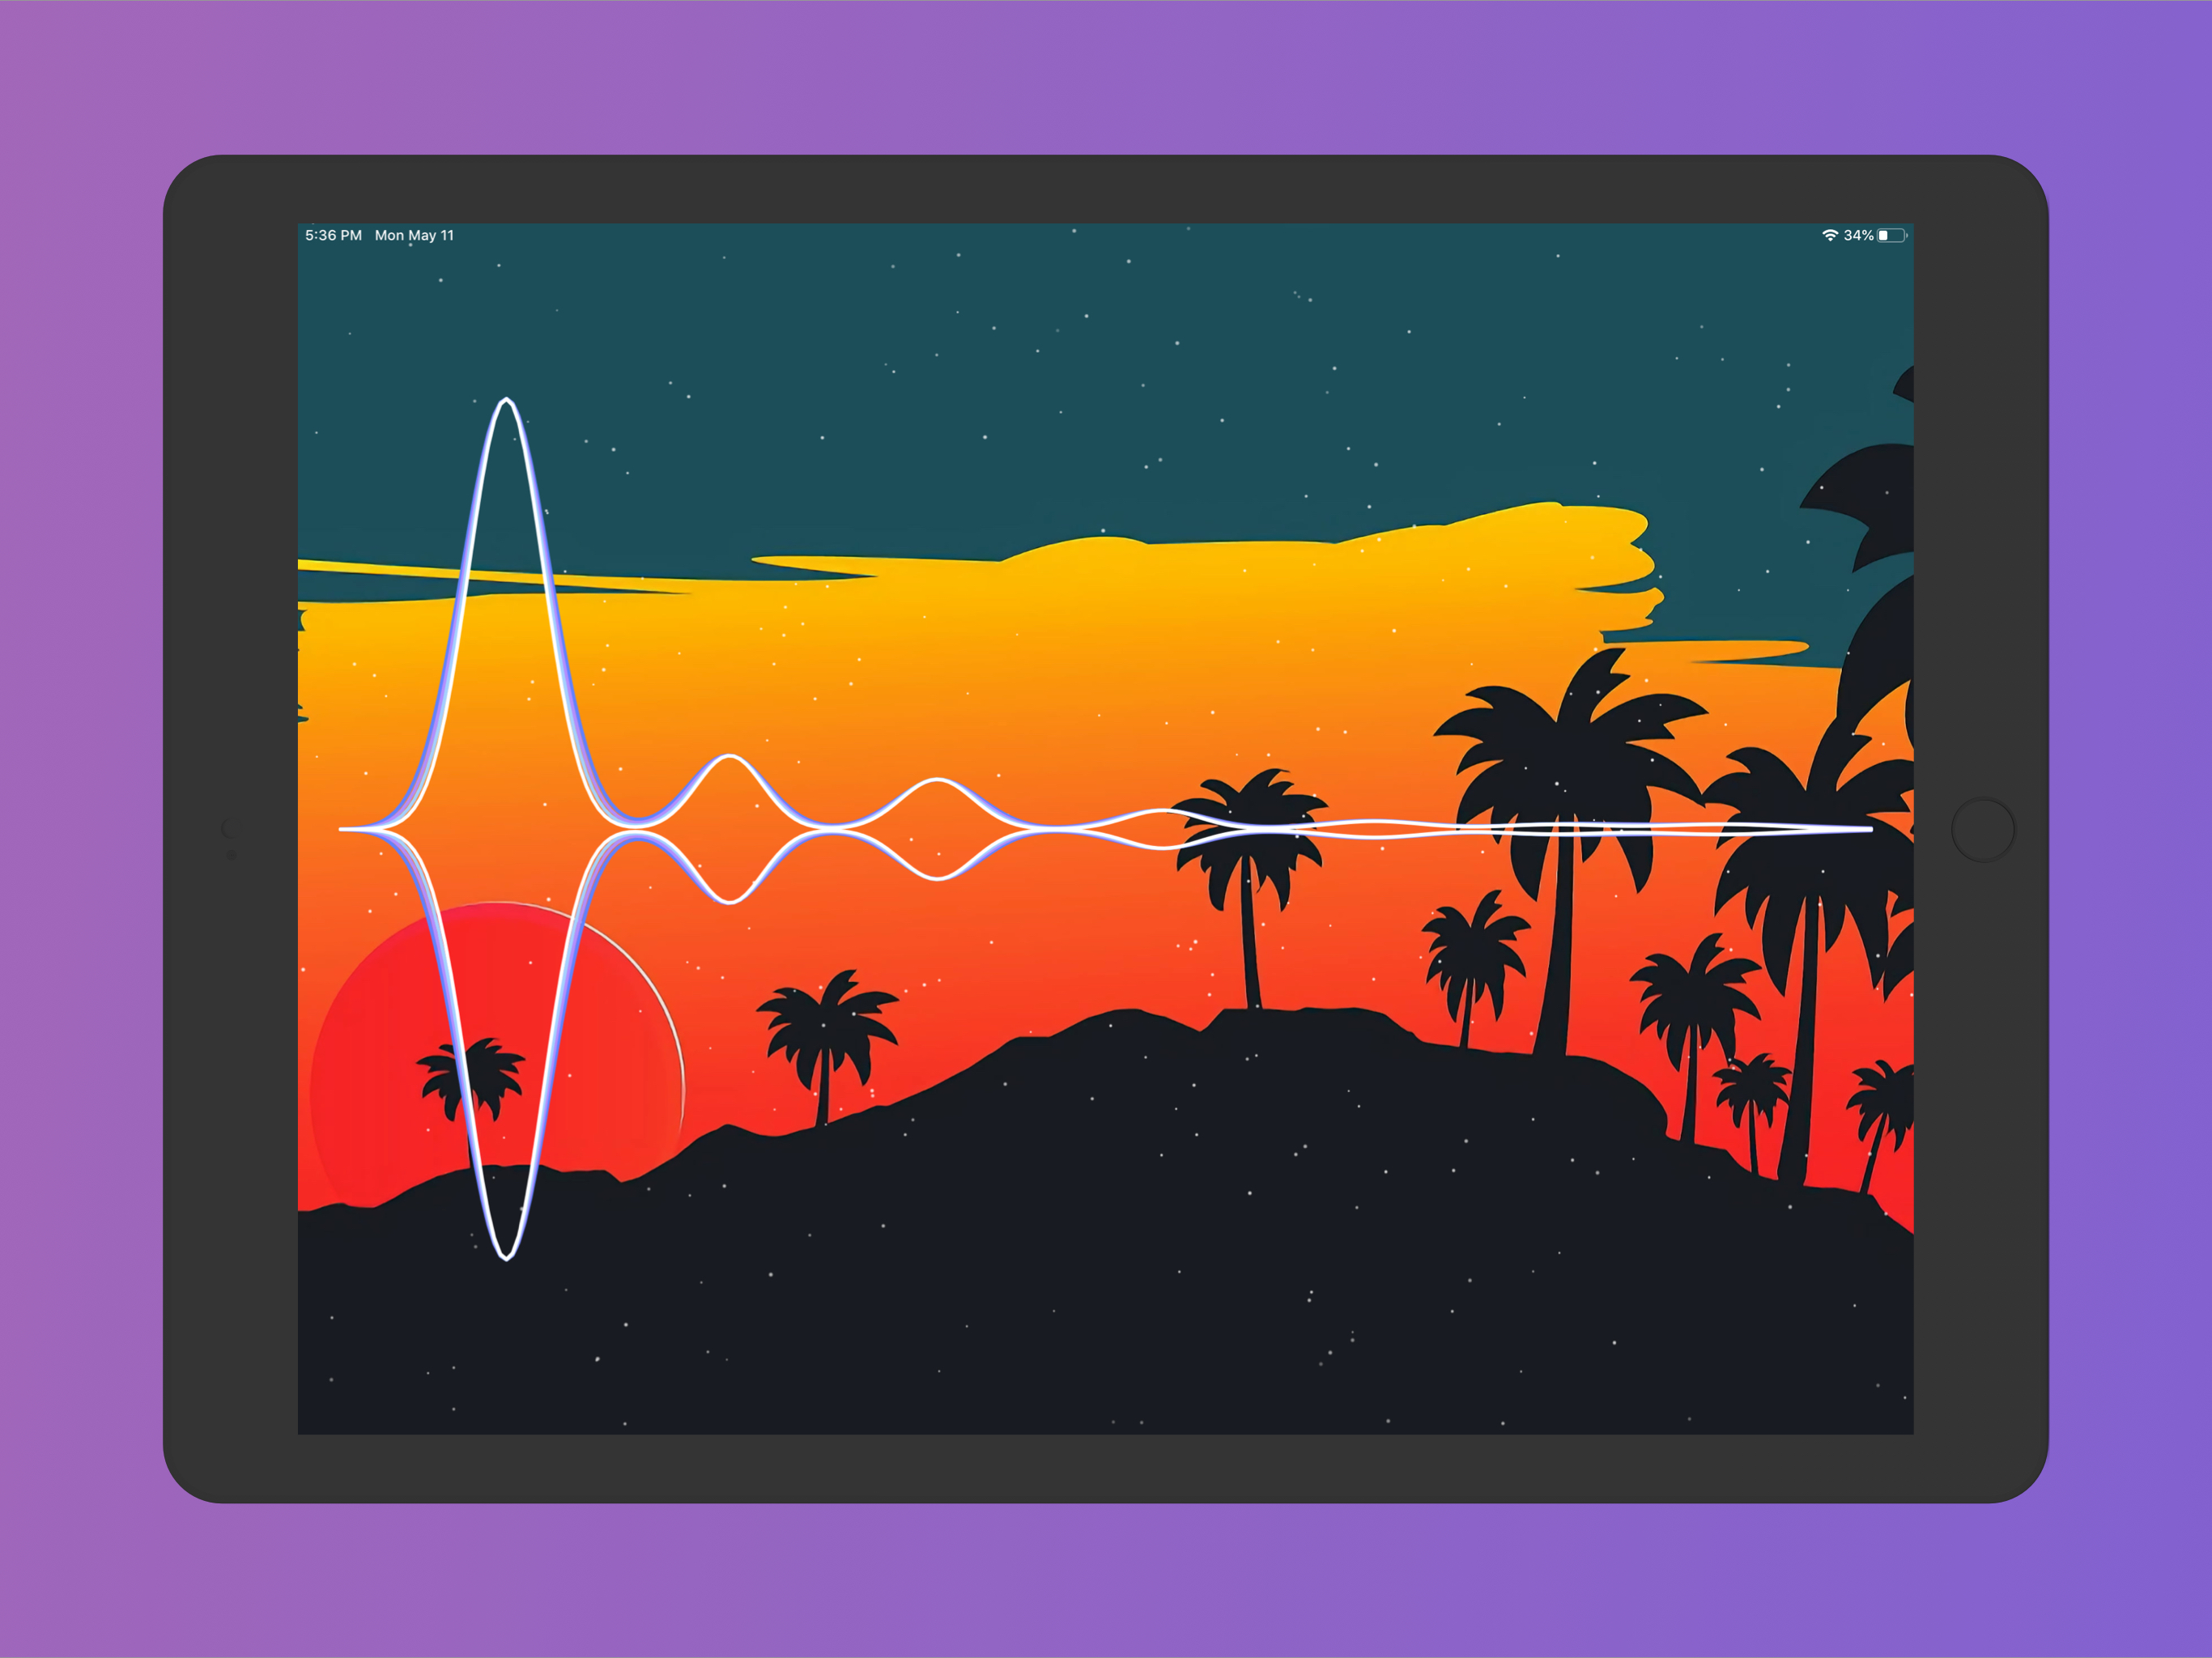
Enjoy music at a deeper level with realtime visualization! Spectra is a lightweight music & audio visualizer app that allows you to select and visualize audio in realtime, right on your phone or mac. Want to export your visualization? We have you covered. Simply click the "Create Video" button from within the app. No longer do you need expensive software to create those beautiful animations you've seen on the internet. Want to customize the background image or put a logo in the center? We made that available as well. In fact, you can customize just about all aspects of the visualizer. You can even import audio files from apps like iMessage or Mail using the share sheet. We want to keep improving the app so If you have any suggestions, be sure to leave a review and tell us what feature you're missing! The features: • Amazing, 60fps realtime visualization for any audio file or iTunes music (not Apple Music) song • Video exporting of your audio visualization • Custom background image • Background presets • Background effects • Custom logo image • Visualizer customization • Particle customization • Video export settings • Video animation options • Presets • More to come!!! Here's how it works: The sound we hear is made up of many frequencies. The visualizer decomposes the audio input into its frequencies and displays the lower frequencies at the top/left of the audio spectrum and the higher frequencies at the bottom/right of the spectrum. This can create some cool-looking shapes that all correspond to the currently-playing audio track! Whether you're a producer that wants to see the frequency range of their song, an audiophile, or someone who wants to take a deeper look into their music, this app is definitely for you.