Ratings & Reviews performance provides an overview of what users think of your app. Here are the key metrics to help you identify how your app is rated by users and how successful is your review management strategy.
User reviews affect conversion to installs and app rating. Featured and helpful reviews are the first to be noticed by users and in case of no response can affect download rate.
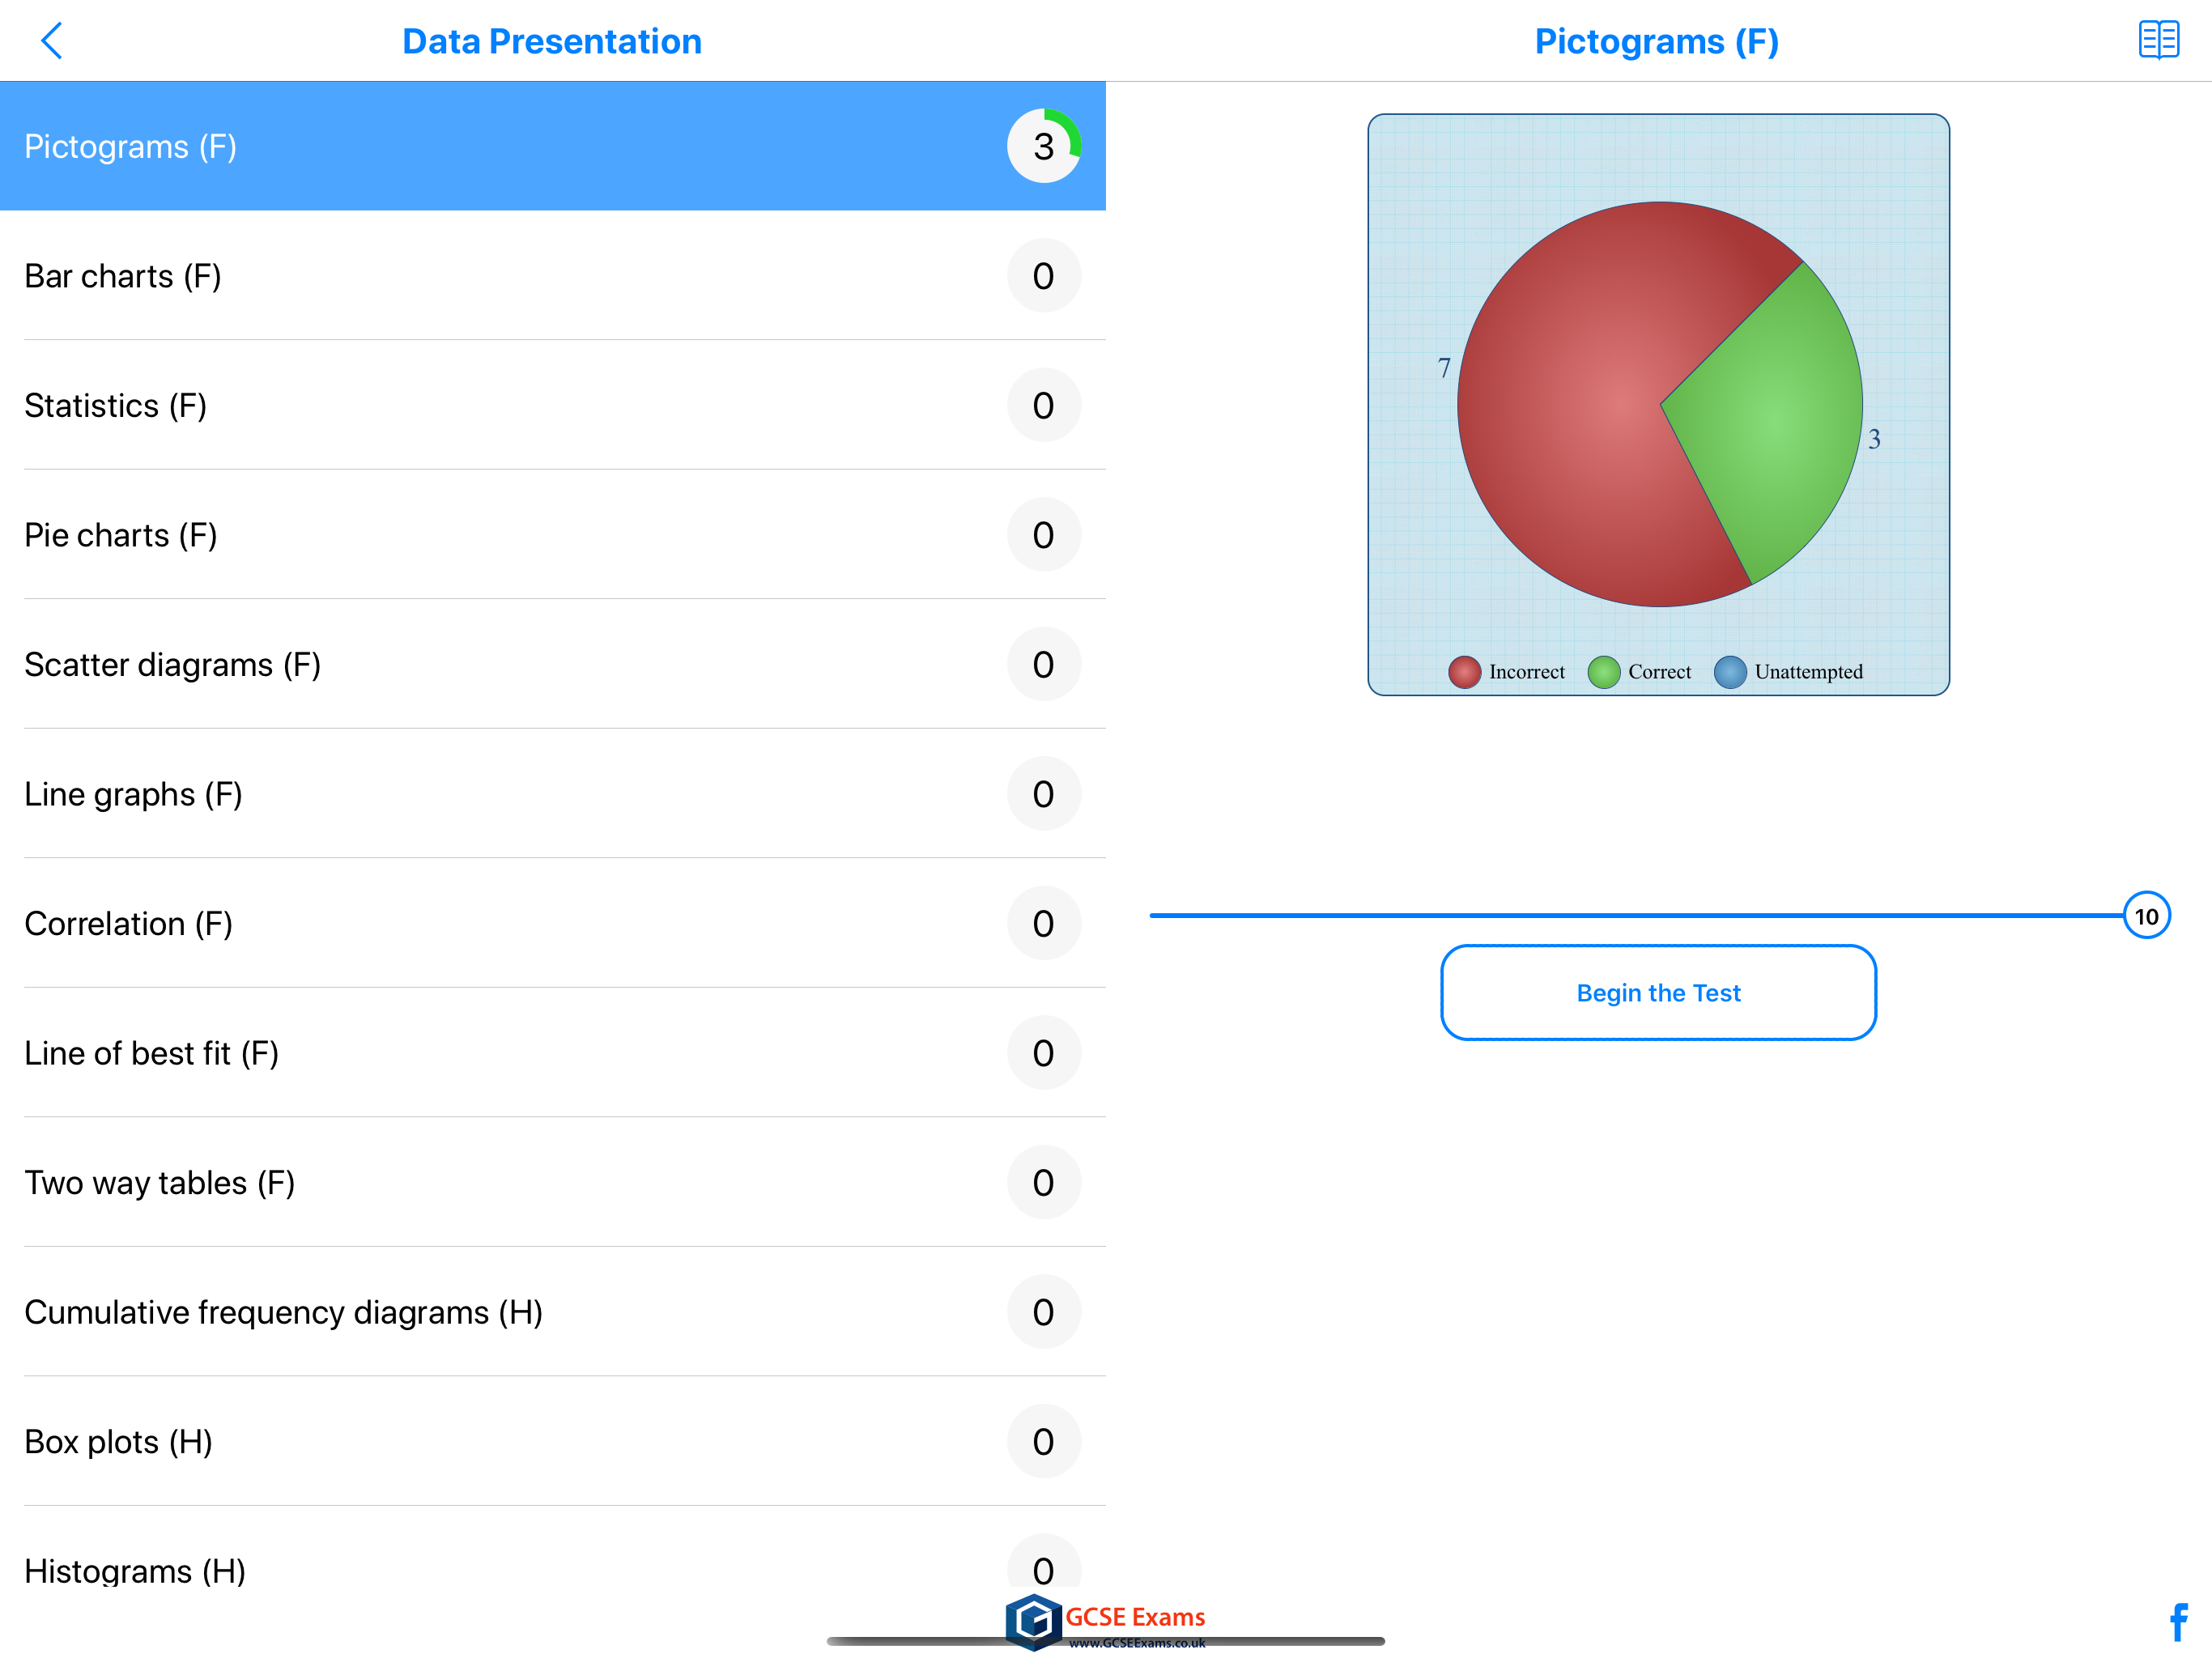
Here comes the most comprehensive GCSE Maths- Statistics app. Includes syllabus covered by all exams boards including OCR, EDEXCEL,AQA,WJEC,CCEA etc. Features include: * Highest quality & quantity : 380 questions and 38 revision notes in all just for Stats!. High quality content written by experienced Mathematician. * Revise by topic : Data Collection, Data Processing, Data Presentation, Probability. * Mock test : Mixed questions from all topics. * Instant feedback : Know instantly if your answer was right or wrong. * Review with explanation : Review each question at the end of the test. Know the right answer with detailed explanation for each question. * Progress Meter : With our unique progress tracking feature, you know you are ready to take on the real test at the board when your progress meter says 100%. More details on topics: 1. DATA COLLECTION: Collection data (F) Data and data collection (H) Surveys (H) Sampling (H) 2. DATA PRESENTATION: Pictograms (F) Bar charts (F) Statistics (F) Pie-charts (F) Scatter diagrams (F) Line graphs (F) Correlation (F) Line f best fit (F) Two way tables (F) Cumulative frequency diagrams (H) Box plots (H) Histograms (H) 3. DATA PROCESSING: Mode (F) Median (F) Mean (F) Range (F) Which average to use (F) Frequency tables (F) Grouped data (F) Stem and leaf diagrams (F) The data handling cycle (F) 4. PROBABILITY: The probability scale (F) Probability of not an event (F) Addition rule for mutually exclusive outcomes (F) Relative frequency (F) Combined events (F) Additional rule for events (F) Calculating probabilities (F) Expectation (F) MUtually exclusive and exhaustive events (F) Tree diagrams (H) Independent events (H) At least problems (H)