Mobile Game Metrics Benchmark: Key Metrics & KPIs to Analyze


Table of Content:
What makes a mobile game successful at the moment of its release? What makes people play it once and then come back for another go? With hundreds of thousands of game titles out there, you can only sit and wonder. Unless, of course, you command a treasure trove of mobile game metrics and analytics data and you’ve got a knack for distilling it into crystal-clear insights.
Good thing we had just the person speak at Mobile Online Conference - Ioana Hreninciuc, CEO of Game Analytics - a kickass mobile analytics platform. This article will share her insights (and her awesome slide deck - click on pictures to enlarge) into the odds of success in the first month after launch, as well as other crucial key types of mobile game metrics and stats to keep in mind. In case you’d like to watch the original video with Ioana, it’s right at the bottom of this article.
We’re looking at a data slice of 100,000 games produced by 60,000 developers across the world. The player base spans over 3,000,000,000 (yeah, three billion) users and it is distributed around the world by ½ in the US and EU, ½ in the rest of the world.

Day 1: User Retention on Game Launch
When you launch a mobile game, you naturally expect that your users will come back to it to play it again. On day 1, the retention is around 25% on average, which is pretty low. Games that reach 35% retention on day 1 draw more attention from publishers interested in the game's future - but not all too much. At 45% and higher a lot of people become interested in the game and everyone wants to get a slice of it in a likely case of it becoming a success.
The top 5% of the games on Day 1 launch have around 46% retention.

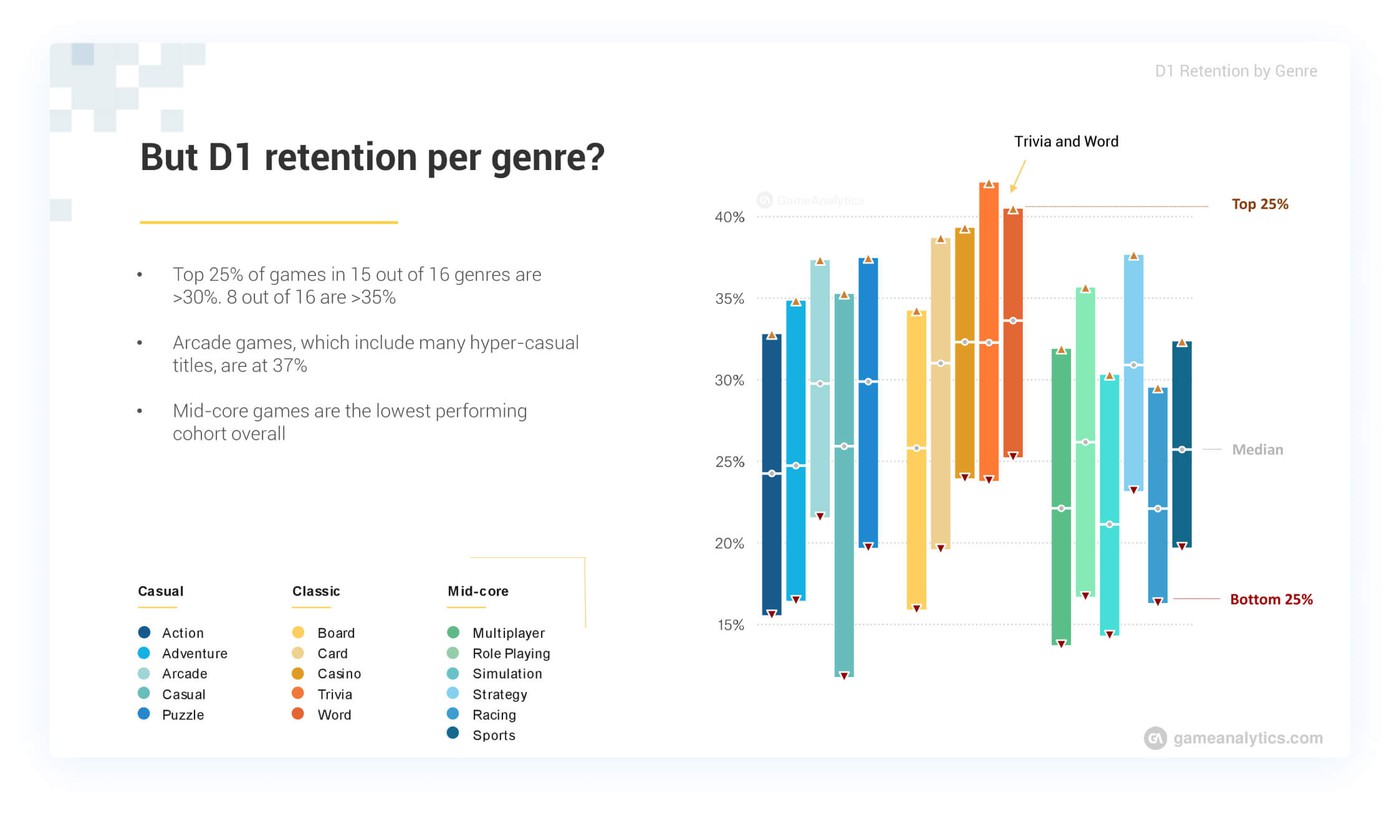
What’s the Day 1 retention per genre?
The top 25% of games have no significant difference, but the top 5% have a real lead - that’s Trivia and Word game genres. These two beat everyone else when it comes to retention.
Arcade-type games come as a close second - about 35% - a reasonable success. The puzzle genre is the most competitive genre. Introducing puzzle mechanics in a game tends to improve its retention.
Day 7: User Retention a Week After Launch
Let’s look at what happens with an app after a week of its release.
The leading top 5% get double the retention rate of their second forerunners. Based on yearly observations, the overall retention rate is slowly dropping. That’s generally associated with high competition and game title saturation on the market.
An interesting observation: people play a lot more during Christmas and New Year celebrations, but once the holidays end, they don’t necessarily return to the games they’ve played.

So if you launch a mobile game on holidays you’re going to see higher traffic but lower retention - because users try out tons of different games and only a few of them stick.
Keep in mind that if you launch your game during a holiday, you should take your numbers with a grain of salt - no telling what kind of a decline you’ll see once the holidays end.
After the holidays are over, the drop that follows hits the top performers harder as opposed to the average apps. Tens of hundreds of users may suddenly vanish, and thus it’s going to be an expensive procedure to keep the numbers up, as well as your app in the #1 spot in the app stores.
What’s the Day 7 retention per genre?
In terms of genres, by day 7 the previous leaders - Word, Trivia, Card, and Casino keep going strong. People tend to come back to them because they don’t require a lot of time to get into. The puzzle games also begin to retain users much better at this mark, with an overall 64% increase. The rest of the games don’t perform at all, with only the strategy games making an improvement. These underperforming genres require more time to get into and people that try them either love them and stick around or they never come back again.

Day 28: User Retention After a Month
So what happens a month after the game launch? The highest-performing games see the biggest drop overall, and this seems to happen when new major games are released, and thus, new competition rolls in. People are used to many new games coming out and that’s why even the best high-performers are not safe from retention drops. The gap between the top 5% and the top 10% is pretty steep as well.
Average performers keep on trucking though, without any significant change in the retention rates.

What’s the Day 28 retention rate per genre?
Now, when it comes to genres, the best performers appear like most game’s great day 7 mark. Again, notice the major performance difference between the top 5% and the top 10%. The majority of genres take a steep dive and only a few genres manage to grab the spotlight. These genres are Puzzle, Board, Card, and Word. Racing, Action, and Sports lag behind.

Overall, returning players spend less time in the game now, with the average time spent slowly decreasing. The top 5% of performers see the biggest dip in the time spent in-app as opposed to the top 10%.
What Is the Average Session Length?
How long do users spend time in the app? The top 25% of performers have a total average session length of around 7 minutes now.
In terms of genres, Card, Multiplayer, and Strategy have an average session length of 50+ minutes, which is double that of the top 25%. Puzzle genre is around 40 min on average, and the retention-masters like Card, Trivia, and Word genres have around 10-12 average session lengths.
That means long game users stick around and play for a while, and less time-intensive games are easier to come back to without a certain time commitment necessary to enjoy them. Whatever your game genre might be, make sure it attracts the right people with its features and thus it will retain your target audience.

Mobile Game Monetization Statistics
You would probably think that average games make around 50-60 percent less money than the top-performing games, but that’s not the case at all. The top performers earn about 10 times as more. $60 on average as opposed to $6. Even comparing the top 5% to the top 20% there is a 2-3 times difference. Here’s the 10x effect embodied:

Just in case these acronyms are giving you a hard time:
IAP - in-app purchases
ARPPU - Average revenue per paying user
ARPDAU - Average revenue per daily active user
All the more reason to aim for the #1 spot, right? The winner takes it all.
Revenue Per Genre
To categorize, there are two types of users (or rather key metrics) we’re looking at here: Daily active and Per paying user.
Check here how to choose the best mobile monetization strategy.
Daily active games - like RPGs - have folks buy a ton of stuff within the game all the time, but all of these micro-transactions are usually not expensive. Only RPGs are really viable for this monetization scheme since other games can’t even come close. You could say it’s something that we’re now accustomed to - RPG’s value delivered via micro-transactions and a lot of small in-app purchases.
Per paying user scheme accounts for lifetime purchases made and has Casino and Card games as the absolute leaders. Despite the fact that these genres don’t have a lot of traffic, their users pay tons of money. Casual games like Action and Arcade are also well-performing in this monetization scheme.

The takeaway here is that the leaders in almost any genre manage to bring the bank in, all you have to do is optimize for the monetization scheme your game is suited for best. Sometimes betting on a volume strategy is a good approach.
Speaking of conversion, the top 5% of performers take the bank and gain a paying audience, unlike everyone else who is on a steady decline.

The other genres have a very low conversion into the buy rate at around 1-2%, with Arcade and Word at an absolute worst spot below 1%. No one is paying for that because these games are simply not optimized for sales.

The Ad Revenue Statistics
It’s not all about the in-app purchases that bring the money home - the ads are a whole different approach to app monetization. What can we learn on this front?
The countries that make the most revenue with ads are the US and China, with at least twice as much revenue compared to everyone else. The median cost per impression is at around 30 cents. Interestingly, China ads are not expensive to run, while the profits from ad revenue are on the level of the US, which is notorious for its expensive ad buying.

Just in case again:
eCPM - effective cost per mille, or rather how much bang you get out of your buck for a thousand impressions on the ad.
Key Takeaways
Let’s summarize what we have learned from our data and metrics so far:
- Superstar games make 10 times as much bank compared to average games
- Retention is dropping across the board for all games and genres, the top performers suffer twice as much as everyone else
- The bite-sized games (Word, Trivia genres) have fantastic retention but are notoriously difficult to monetize
- Harder to enter games (RPG, Card, Casino), on the contrary, have the potential to make bank with a handful of regulars making tons of purchases
- China looks great for localization and is profitable to advertise in
And that’s about it. Pay attention to important game metrics and optimize your monetization to fit your genre. Thanks for reading!
Afterword
Watch the full video interview on our YouTube channel to learn more from Ioana's speech on the mobile game and app metrics at the Mobile Online Conference by AppFollow:
FAQ
How can game developers improve Day 1 user retention?
To improve Day 1 user retention, focus on creating engaging content that encourages players to return to the game. Analyze mobile game metrics to understand player behavior better. A proactive approach in responding to app store reviews and making necessary adjustments based on feedback will help too. Reply to App Store reviews and respond to Google Play reviews to show that your developers value player feedback.
How to keep user engagement a week after launching a mobile game?
Games that offer quick and easy gameplay, like Trivia and Word, tend to keep players coming back. Reply to Google Play reviews and App Store reviews to ddress any concerns fast. App store review management software—like AppFollow—will help in changing the game to meet user expectations.
How to monetize mobile games while ensuring player satisfaction?
Choose the right monetization model that fits the game genre, whether through in-app purchases or ads. Engaging with players through App Store Connect or replying to reviews on Google Play provides insights into player preferences. App review responses that address player feedback will positively influence player satisfaction.
What role does responding to player reviews play in the success of a mobile game?
Answering the questions of how to reply to App Store reviews, how to respond to Google Play reviews, and how to see Google Play reviews in other languages will help in managing player feedback. By replying to App Store reviews and Google Play reviews, you can address concerns, thank players for their support, and highlight upcoming changes or improvements.