6 Steps To Improve Your Conversion Rate: ASO audit that anyone can do — Part 2

In our previous article we conducted an ASO audit based on keyword and graphics optimization. We analyzed titles and descriptions, found new keywords, and suggested ideas for improvement of screenshots and promo banners. Those steps are the foundation of any ASO strategy, but they aren’t always enough.
Let’s get back to our initial plan:
- Keyword optimization: Analyze the title, subtitle, and description of your app. Do your research and find what keywords will get you higher ranks and what your competitors use.
- Graphics optimization: Search for whether there is anything you can change in your visual assets such as the app icon, screenshots or promo banners, and what can be improved in order to attract more users.
- Click-to-install conversion rate: Evaluate your current ASO indicators, user acquisition channels, and conversion rates, and compare them with the average in the market and in your app category.
- Monitoring of ratings and reviews: Examine your ratings and reviews, your featured reviews, and your competitors’ apps’ reviews, and work on how to improve yours.
- Uninstall rates: It’s important to know how and why your users deleted the app, and what actions you can take in these cases. Come up with ideas on how to encourage them to reinstall it.
- Final report: Summarize everything that has been conducted, what KPIs need to be increased after each step of ASO, and where to get extra traffic from.
In this part, we will analyze the click-to-install conversion rate, ratings, and customer reviews. We will also discuss customer retention and find new organic traffic channels.
To conduct these steps we used Google Play Console, App Store Connect and AppFollow Benchmark. We analyzed our customers’ data, so our examples will be unpersonalized. The data was collected from March to August 2018.
3. Click-to-install conversion rate
Various factors affect the click-to-install conversion rate, such as texts, graphics, ratings, popular reviews, traffic quality, etc. Moreover, conversion rates can vary significantly in different traffic acquisition channels. It’s the most complex constituent of ASO, but it’s also the foundation for the highest possible install rates.
Let’s take a job search app as an example and analyze how it attracts and retains customers in Google Play.
We took the install rates, the average click-to-install conversion rate, and the average retention rate in Google Play Console (User Acquisition):

Around a quarter of users uninstalled the app on the same day they purchased it (Column R1). Both external and internal factors are at fault here. External factors are seasonality, irrelevant traffic purchase, unsuccessful text optimization, or getting into Featured Apps (when a user downloads the app out of curiosity). Internal factors are related to product errors or malfunctions.
The install and conversion rates differ every month. Let’s take a look at the reasons behind this tendency:
Getting into Featured Apps
We noticed a sudden spike in the app’s install rate from October to November. This happened when the app got featured. At first, the app was featured in its category and then got over 1 million installs, which could have affected the app’s ranking and customer engagement. In addition, the recommendation algorithms in Google Play can influence the install rates, although this type of traffic is hard to track. As a result, the app ranked among the top 5 apps in its category and remained in the top 10 for 4 months.

Dreaming of getting featured? Learn how to be featured on the main page of the App Store, and how to prepare for it correctly.
Reviews
The highest amount of traffic came in November. In December the conversion rate dropped suddenly to 34.3%, and the install rate was about the same as in October. Such a decrease can often be caused by a major update or redesign: Users aren’t used to it, so they rate the app low or request the old design back. Just look at Twitter hashtags after a big release, or Instagram or WhatsApp reviews — some customers will never be satisfied.
The app from our example had no major updates, and furthermore, it got more 5-star reviews than usual:

Such a drop in the install rates (from 41.5% in October to 35% in December) could have been affected by any of the following:
- Seasonality: People are less likely to search for a job in December.
- Lower traffic quality: The app’s team may have started buying incent or irrelevant traffic.
- The app’s competitors may have optimized their apps’ pages.
- External factors related to the app (average rating, popular reviews), or internal ones (uninstalls, crashes).
If you have noticed a drastic change in your conversion and install rates, pause your advertising and promotional campaigns to look at what might be the problem. It might be something you or your users have done.
Tip: The average conversion rate depends on your app’s category. Let’s say your app’s conversion rate is 3.5% — you may be worried that it’s too low, but if the average rate in your category is 3.8%, then you’re among the top-ranking apps. You can track the market trends and conversion rates by category using AppFollow Benchmark.
Benchmark
In December 2017 the app’s conversion rate was 10% higher than the average market rate in its category:

Keep track of the errors, malfunctions, and crashes in the app, because they lead to uninstalls and negative reviews. If you monitor customer reviews, you can encourage users to change their negative review into a better one (provided you’ve fixed whatever they were complaining about). An app or a game with a high rating and positive reviews has better chances of being Featured and attracting new customers.
Tip: ‘Like’ your positive reviews — the more likes a review gets, the more likely it is to become a Featured one and thus be seen by all visitors to the app page.
The algorithm is the same for the App Store. The only difference is that App Store Connect analyzes data on returned users. For the audit, you will need the retention rate. Apple calculates it based on those users who consent to their data being shared (that’s 20–30% of all users). Make sure to use product analytics software for your audit, e.g. Amplitude. And again, AppFollow Benchmark will work just fine for calculating the average conversion rate.
4. Monitoring of ratings and reviews
The average ratings and reviews directly influence the click-to-install rate. To learn how to improve your app’s rating through reviews.
Want to know why app user reviews are crucial to your ASO strategy? Find out here.
Let’s analyze how a popular messenger from the Top 10 deals with users and their reviews:
Average rating
In Google Play: 4.1, which is lower than that of the app’s competitors (e.g. a direct competitor’s rating is 4.3).
In App Store: 4.3, which is good here — very few competitors have a higher rating here.
The solution: keep focusing on Google Play: Respond to all reviews, especially the negative ones, report your concerns in the event of spam, and do whatever you can to increase the rating to 4.3.
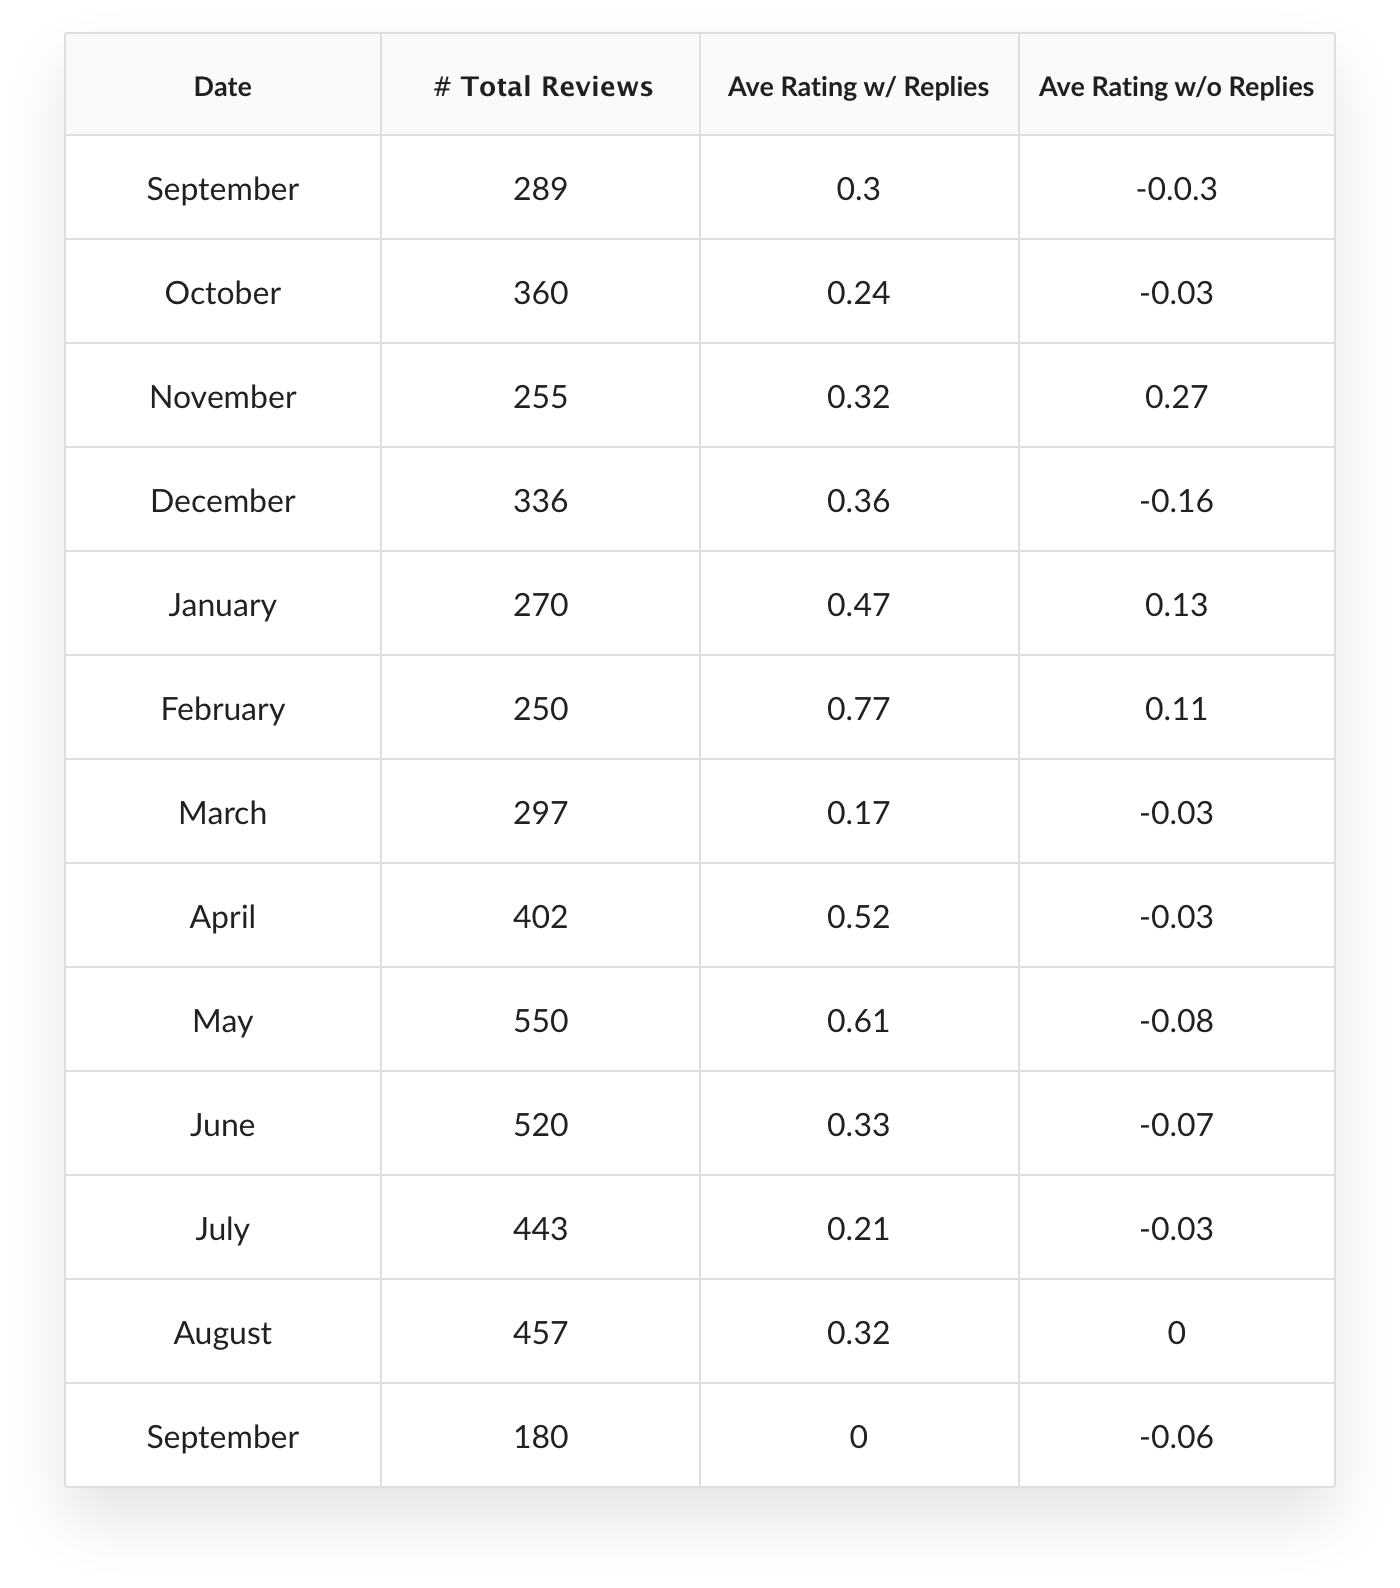
Collect and analyze current reviews:
- How people rate the app;
- How the support team responds to the reviews;
- How often users update their reviews;
- How users rate the app after changing their reviews.
Tip: AppFollow provides this data for every app, and you don’t even have to have access to Google Play and App Store consoles to get it. Simply add the competitors you want to analyze to a collection and go to ‘Reviews’ > ‘Reviews Analysis’.
Featured reviews
Featured reviews are the ones that a user sees on the app’s homepage in the store. The number of featured reviews differs between the App Store and Google Play. The former displays four popular reviews on mobile devices and six in a browser, and the latter three and four respectively.
The Featured reviews of the messenger have a lot of negative feedback in both Google Play and the App Store. This could turn off potential customers and decrease the conversion rate.
Google Play
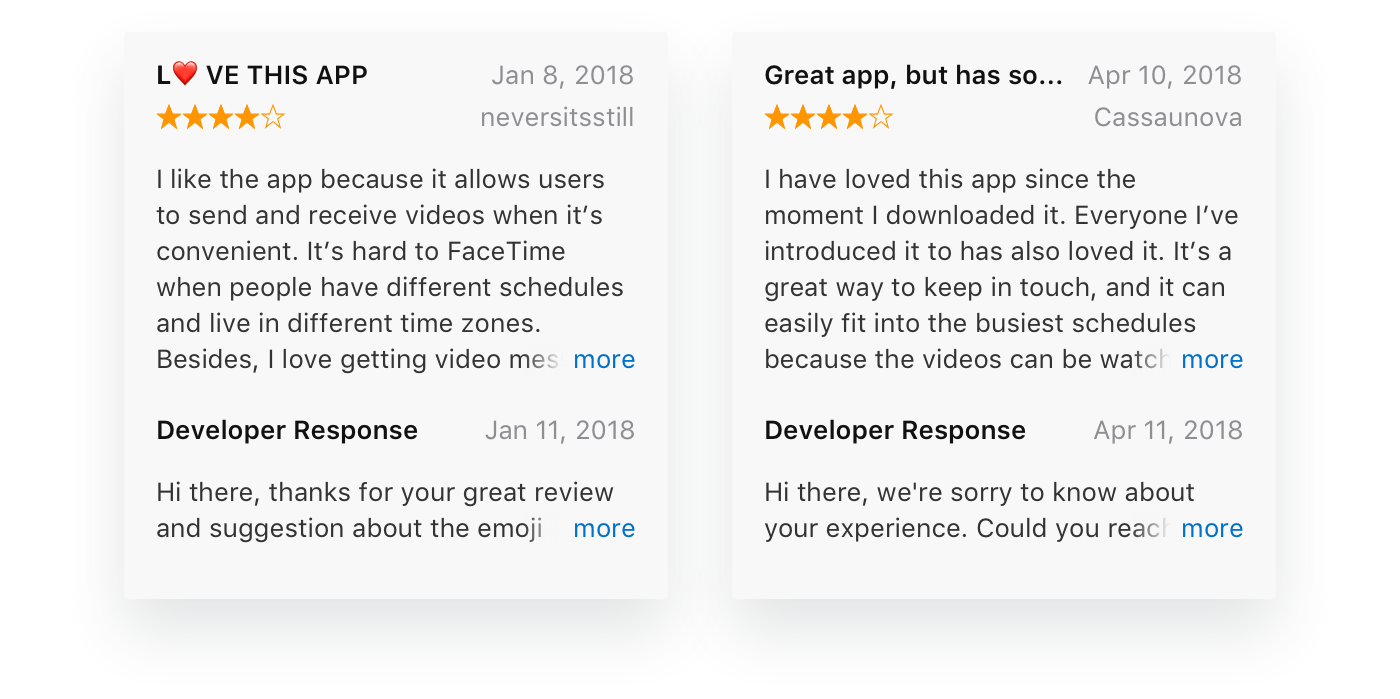
The app’s Featured reviews vary by country. Let’s look at the feedback from the US:

The first review has 38 likes and the developer’s reply. The second (Devin Koritzke) has 22 likes without a reply. The third review is a negative one with 2 likes and no reply. The fourth one, which outlines disadvantages of the app, received 63 likes and also had no replies.
The solution:
- Reply to everyone.
- Update your reply if a user updates their review. AppFollow will send you a notification when a review is updated so that you can give a timely reply to it.
- Create more template replies and personalize them. AppFollow allows you to add unlimited templates and reply to reviews in just two clicks.
The App Store
The first review has only 3 stars and no replies since April 4th:

Tip: We’d advise you to report a concern over negative feedback with spam or offensive content in the App Store. If such a review is considered to be spam or competitive advertising, Apple might delete it. Find step-by-step guidelines on how to report a concern with Apple here.
None of Featured reviews in the US got any reaction from the developer:

Replies to reviews have become a powerful channel for communicating with users. This method allows you to get the gist of a client’s issue, and when it comes to screenshots and personal data you can move the conversation to email.
Prompt replies are important. If a negative review is old, it will be hard to get rid of it. The user may hold a grudge against the developer or may have already deleted the app, so they could be difficult to reach.
Do not hesitate to ask your users whether their problem has been resolved and whether things have improved. If you’ve helped, the user might want to update their review and give you more stars.
The solution:
- Integrate in-app rating requests. This will help you increase the number of reviews drastically, predict customer complaints, and thus prevent negative reviews. See how it works in our article How to get 30K App Store reviews every month.
- Reply to every review.
- Update your reply if a user updates their review.
- Create more template replies and personalize them. Research how your competitors handle their reviews: what their users say, which template replies they give, how fast they respond, etc.
In our example, the competitor is doing a good job: There were no negative reviews, every review got a reply, and all issues seem to have been resolved.
Monitoring ratings and reviews won’t give you immediate results, but it will improve customer retention and loyalty. Start with integrating in-app rating requests and replying to all reviews you get, and you’ll see improvements in a month.
5. Uninstall rates
It’s not enough to simply attract customers — you need to retain and encourage them to use your app. One way to lower the uninstall rates is to find the causes of the uninstalls and fix them. It’s a difficult but solvable task. The simple solution here is to fix the major bugs and reply to negative reviews. The more complex and time-consuming, but most effective, solution is to set up user sessions viewing, e.g. using the analytics platform AppSee.
Let’s take a Google Play app as an example, using data from March 2018:

50,000 out of 56,000 new users uninstalled the app in December 2017.
Let’s see why that might have happened:
- Critical bugs: E.g., users couldn’t sign up.
- Crashes: These aren’t critical bugs, but they can cause Google Play to rank the app lower in search results.
- Seasonality: E.g., travel apps are more popular in the summer, while job search apps tend to be installed in the off season.
In our example the crash rate is 3.65% within a month, which is three times higher than the critical threshold:

The crash rate improved slightly compared to the previous month, but it still had to be lowered to the critical threshold of 1.1%.
No matter how amazing your ASO strategy may be, your development team should be involved in customer attraction and retention. They should make sure that the app doesn’t crash or malfunction, otherwise, no ASO audit will ever work.
Conclusion
The steps described above will help you find any flaws in your current ASO Strategy and develop a new optimization approach in the App Store and in Google Play. Next time we’ll tell you how to transform the results of your ASO audit into an efficient strategy that will lead to an increase in the install rate and in user loyalty.
Seems complicated? With proper tools for analytics and review monitoring you can easily follow the steps described in the article. If you’re not sure where to start, contact our ASO team and we’ll help you improve your app rating and attract new customers.
May AppFollow and ASO be with you!


