ASO Vault / Lesson #8
Measuring ASO Performance: KPIs for App Store Optimization
Intro
With every job comes a necessity to reflect on results and analyze impact. ASO is no exception to this process. The entirety of your cycle of work includes not just the collection of the semantic core and the implementation of new metadata but also the evaluation of the performance for these changes. In this article, we will talk about the key elements in the analysis of your ASO work:
- Where to evaluate results from text changes?
- The main ASO metrics
- What are the App Store and Google Play attribution channels?
- How to analyze installations from attribution channels?
In general, the work on ASO is no different from how one works on other marketing activities. It is a continuous cycle of work, constituting research, hypothesis forming, testing, and result analysis.
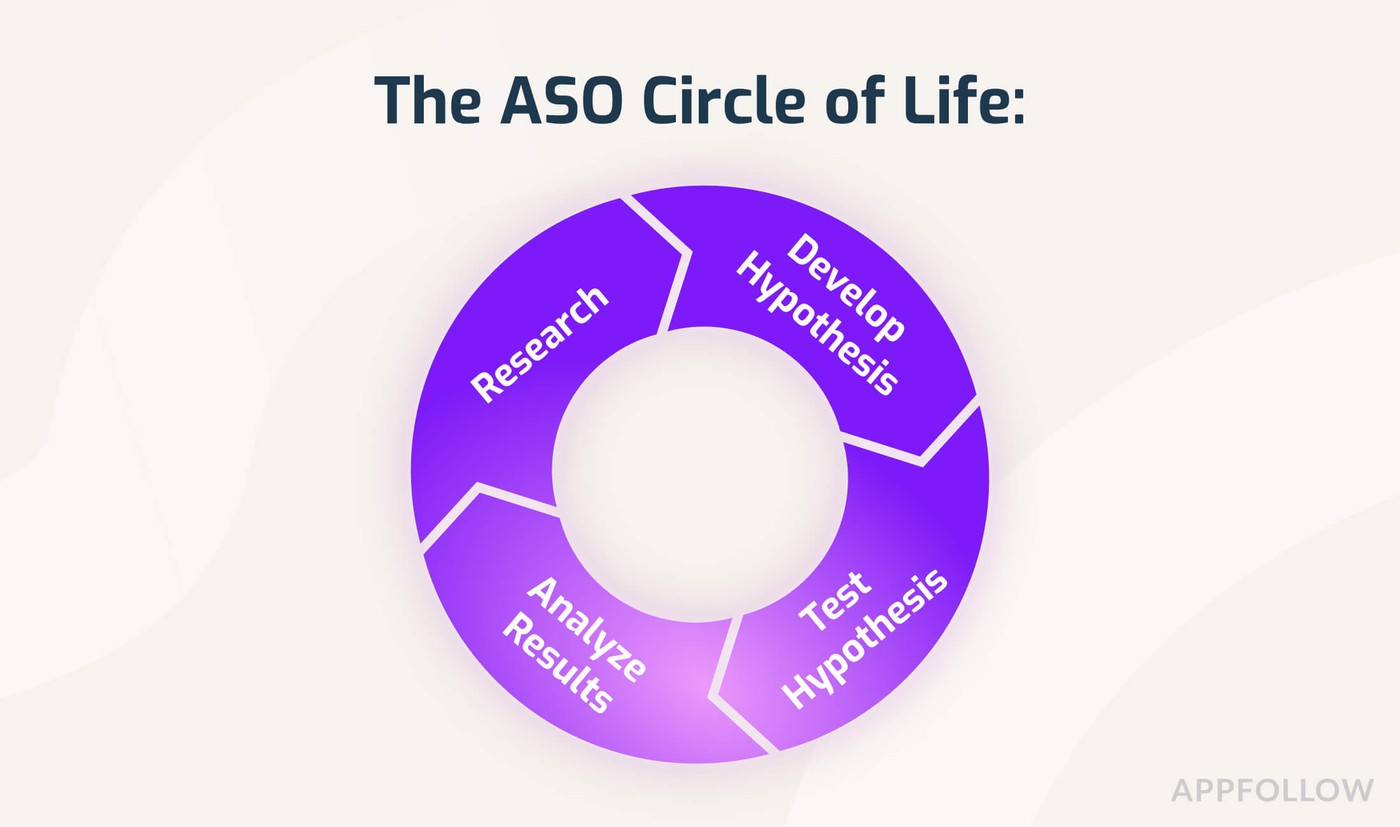
In this circle, there are a few considerations when analyzing results:
- Did we achieve the expected result of the hypothesis (boost to installs, conversions, revenue, etc.)?
- Further steps or pivots (do we need to increase paid traffic, revise metadata, or should we shelve the hypothesis for later?)
To help you answer these questions, we've handily compiled all the information related to analyzing ASO results below.
When should you check the metadata?
As for text metadata, the period of gauging the results varies with indexing time.
The start of indexing occurs along with the release of metadata to the store. It can take some time - up to 5 days - between the time the new metadata is added and when it becomes visible. You can track this with the App Update Timeline tool in AppFollow (using the metric: Last Metadata Update).
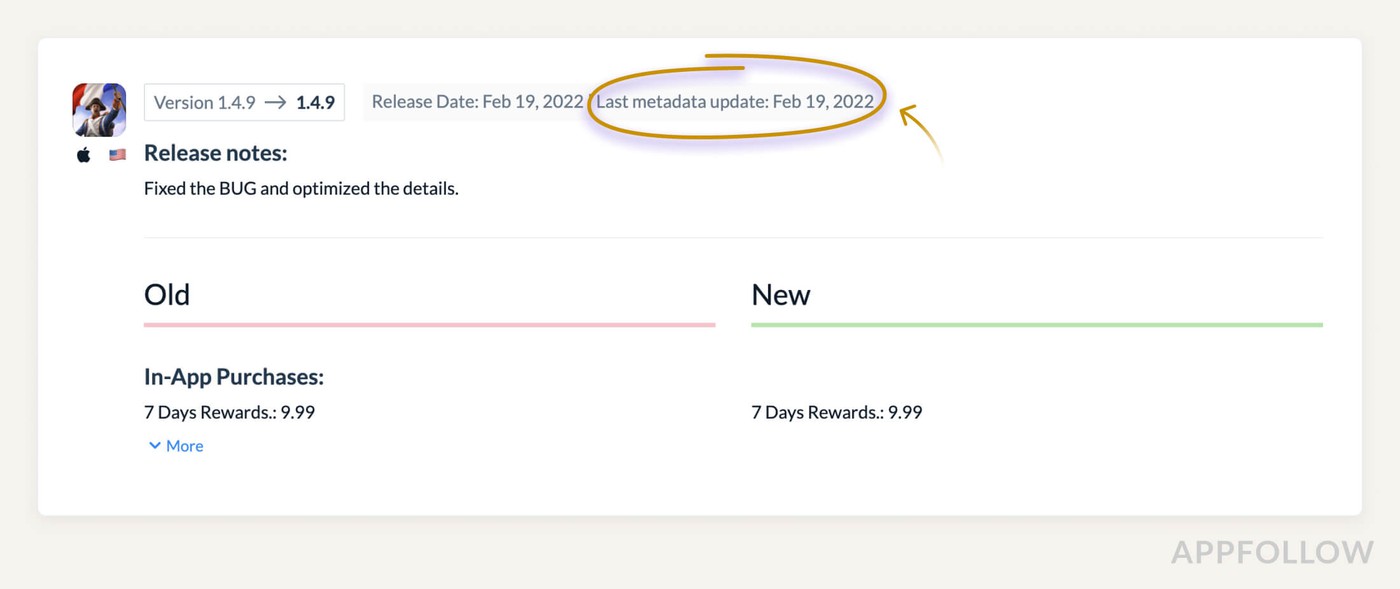
In the App Store, metadata is commonly indexed within 3 to 4 days. The algorithm will recognize search queries in the text and rank the app in a particular position for them. After the 4th day from the metadata's publication, there may see a change in installations.
In Google Play, the time for new data to be indexed may take from 3 to 4 weeks, but this does not mean that you can’t do anything during that time. Initial indexing takes place 2 weeks from release — thus, installation rates can be reasonably analyzed within 10 days of the update.
TOP TIP:
You need to choose a period divided into two equidistant timeframes (7, 14, 21 days) for before and after the update and compare them.
Main metrics (KPIs) in ASO
In general, all metrics are divided into hard ASO KPIs and soft ASO KPIs. Let's look at each of them separately.

Hard ASO KPIs
Total ranked keywords is a metric that shows the number of all keywords for which the app appears in the search. It includes queries of any position, popularity, queries with typos, and competitor branded queries. Generally speaking, it includes all of the app's keywords.
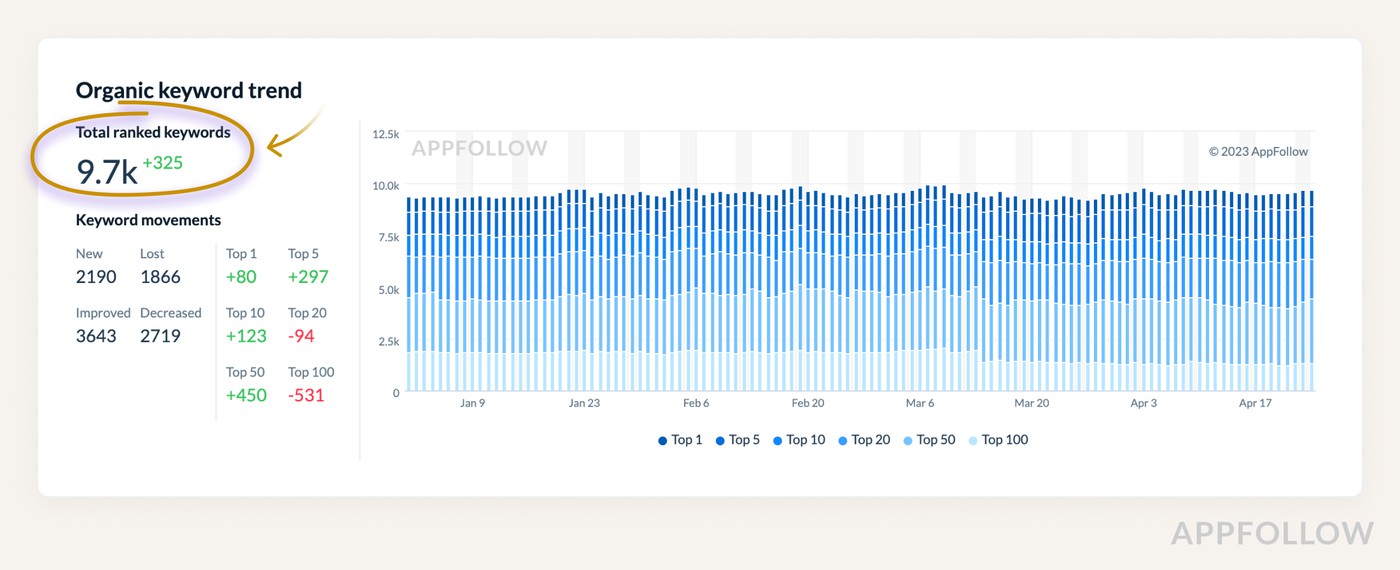
Tracking changes in the number of keywords allows us to know the overall picture of changes in ASO.
But how do we know if the iteration is a success? And, how do we map out the next steps?
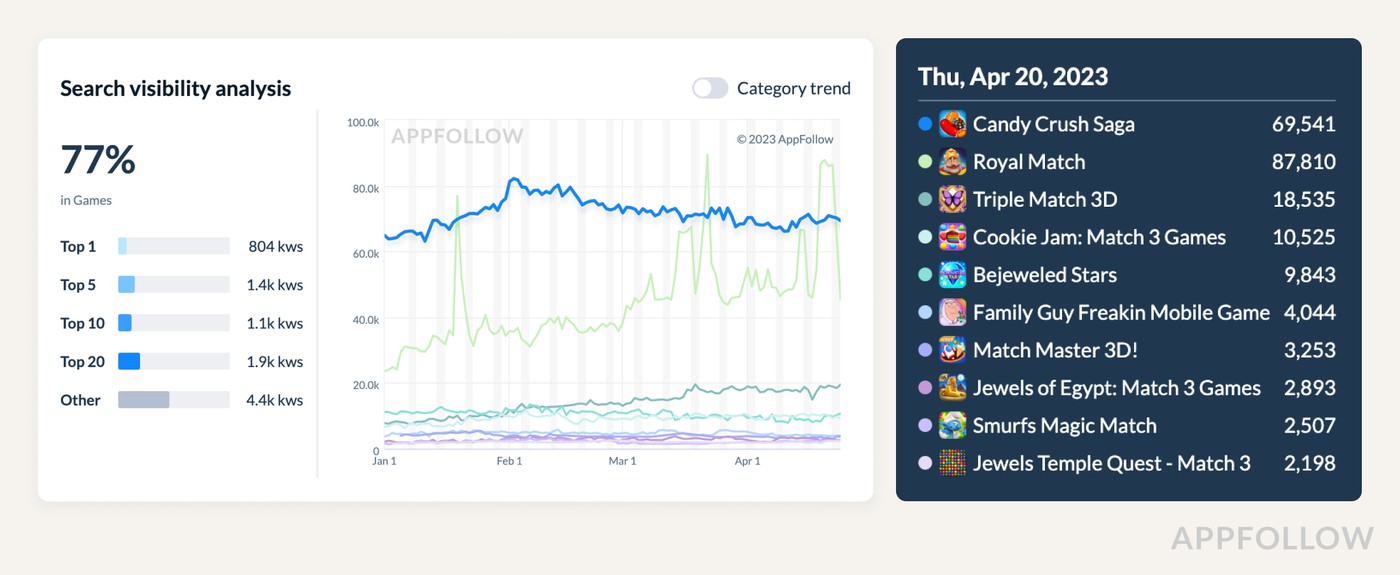
The internal AppFollow metric will be helpful for that, which can be found in the Organic Traffic Dashboard. It’s called Search visibility score.
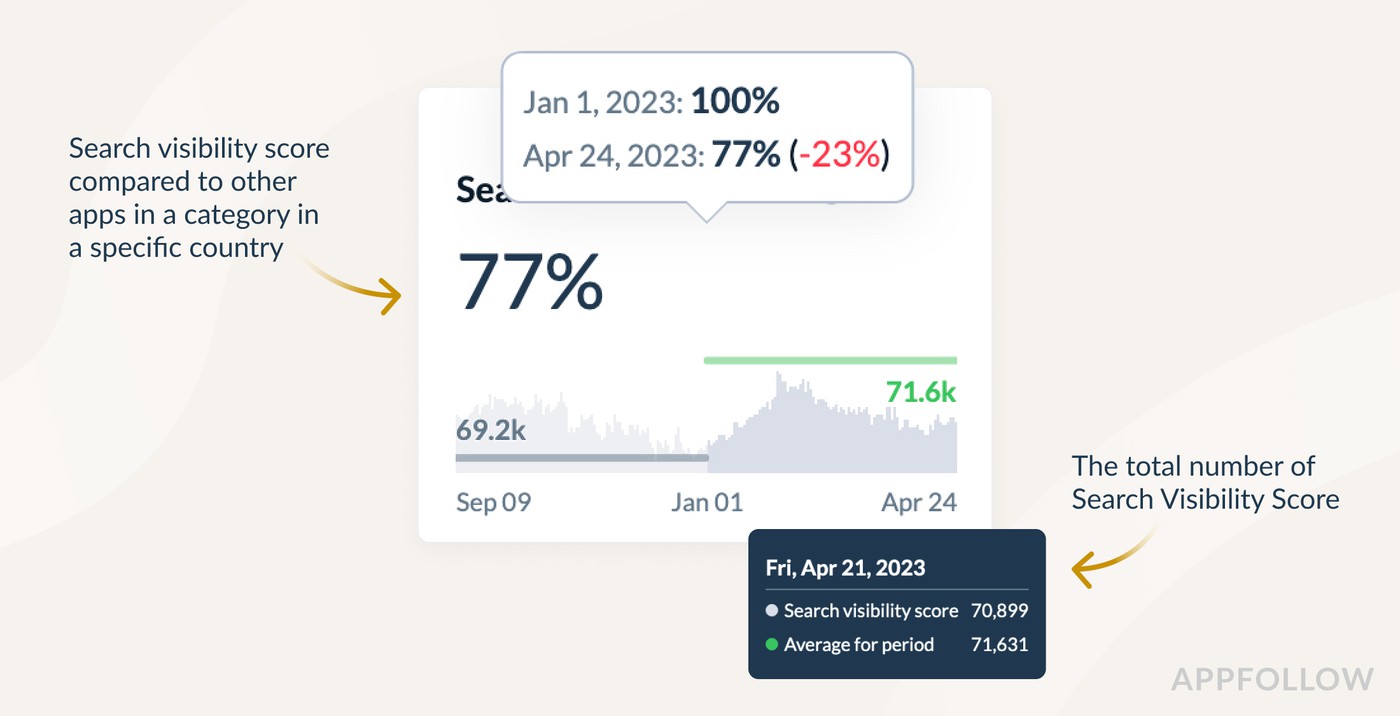
This metric is calculated based on the popularity of keywords occupying positions from top-1 to top-20. Its number is not tied to other metrics and should be treated the same way you would treat the subscriber count — the more, the better for the app.
Changes in the Search visibility index allows the ASO expert to understand whether the primary objective of the text iteration - to rank the highest for popular keywords - has been achieved.
By comparing the Search visibility of your app with that of your competitors' apps, you will gain an understanding of the differences in their visibility on the app stores. You can use this data to set benchmarks for your strategic goals.
Some of the core metrics that can be affected by a change in text metadata involve the internal metrics of the app:
- Views (App Store)
- App page views (Google Play)
- Installations
- Conversions within the store
- In-app purchases or/and subscriptions
Essentially, hard metrics are influenced directly by changing the metadata. Depending on the hypotheses and goals set, the priority of internal metrics can vary, but, in general, these metrics are what we mean as a logical result of optimization.
Soft ASO KPIs
The following metrics may change indirectly and in parallel with the Hard KPIs, but they are definitely not the last in the iteration analysis. Soft KPIs can be divided into these three categories:
- Metrics within the store (category positions, list of similar apps, app scores),
- Metrics within the app (Retention Rate, Crash Rate & ANR, etc.),
- Financial metrics (User Acquisition Value, Life-Time Value, Average Revenue per User).
In the case of Soft KPIs, an increase in these metrics is not a direct consequence of iteration but can serve as a signal of a potential knock-on effect. For example, an increase in search traffic can lead to the growth of an app in a category if it is the main traffic source in the app, and the install rate is higher than other apps in the same category.
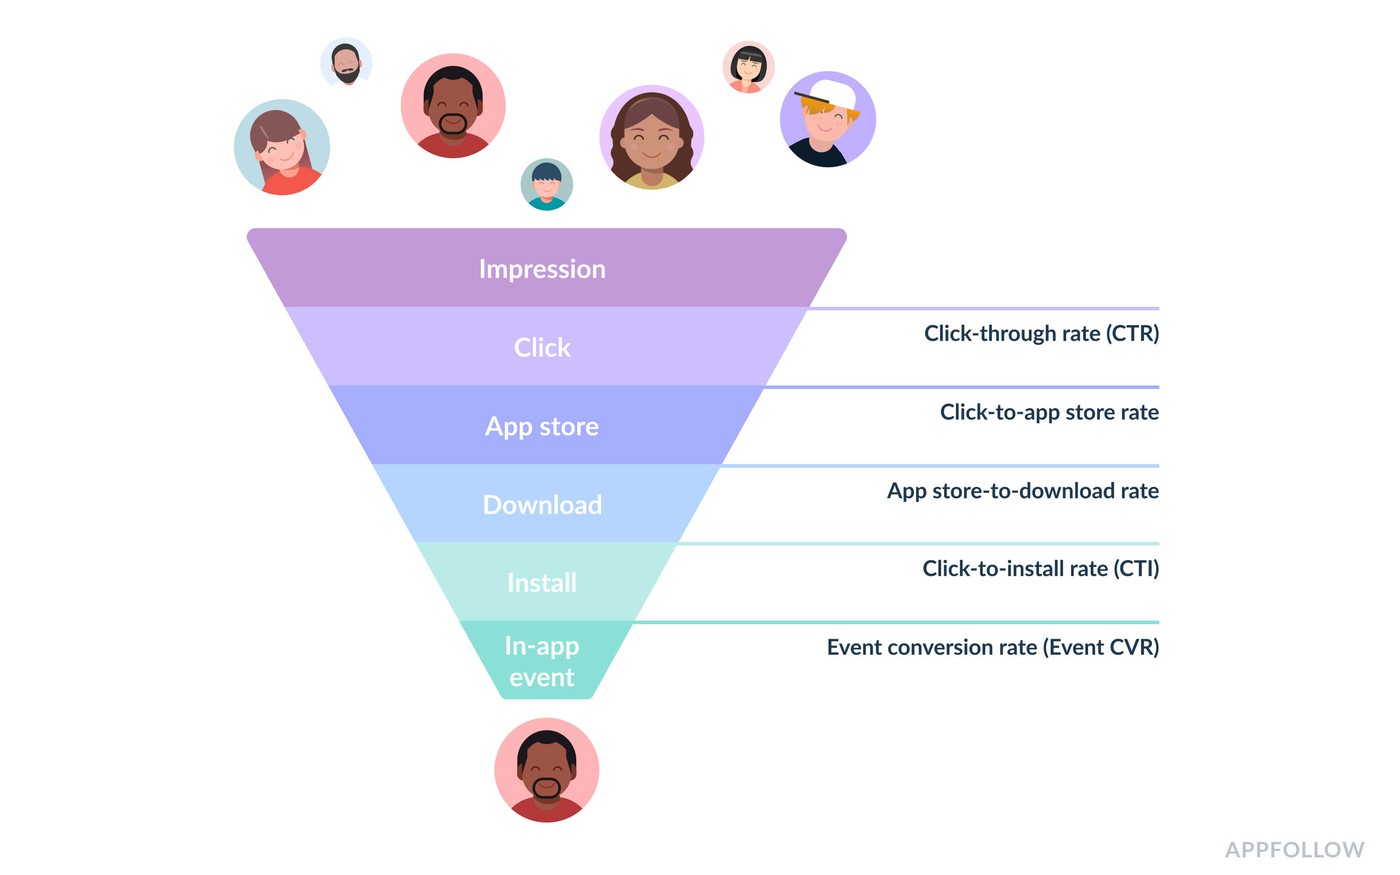
It’s worth mentioning that ASO and UA activities impact each other since UA affects the state of ASO and vice versa. The change in the price of UA is not a clear marker, which would change each iteration with 100% certainty, but it is worth paying attention to dynamics in this metric. By tracking the funnel with this marker in mind, you can conclude the validity of changes in text metadata.
Where to look for the install rate statistics?
App Store
App Store Connect has four attribution channels:
- Search: this channel attributes data from search queries, including Apple Search Ads.
- Browse: it contains data from the top categories, feeds, selections, and the list of similar apps.
- App Referrer: a channel that contains all the data leading to the store from the app advertising networks.
- Web Referrer: all data that leads from the browser conversions.
Text optimization affects traffic from the Search channel directly. Therefore, it is important for us to track the click-through rates, page views, and installs from this particular attribution channel.
Search conversion on the App Store is worth tracking from display to install, since users have the option to install the app from search, and a healthy conversion from page views to install will always be just above 100%.
In complex cases, it's impossible to iterate and influence installs by focusing only on the Search channel, so you need to know the dependencies between the attribution channels in the App Store:
- Traffic from the Search channel can directly influence traffic from the Browse channel: the more installs the app receives, the higher the app's position in the top categories.
- Traffic from App/Web Referrer channels can directly influence the Browse channel: the reason why is the same as above.
- Traffic from Apple Search Ads is attributed to Search and may affect Browse channels.
- Traffic from App/Web Referrer can indirectly affect Search: users may see the app ad but not immediately click on it, remembering the brand. Further, the level of branded installs tends to increase. This concept is called Organic Uplift.
Google Play
The main problem with attribution in Google Play is that if a developer is using all possible channels to attract traffic, they will not have a clear or accurate sight of organic or other traffic sources in the Store Console. Let's break it down.
You can find three attribution channels in Google Play Console:
- Search: this channel attributes data from Search queries, Google Search, and Google UAC (the ad placement in the search results).
- Browse: app featuring, similar applications, category top charts, and Google UAC (advertising placements located on the main page of the store).
- Third-Party Referrals: this channel attributes referrals from ads and UTM-tagged conversions to the app page.
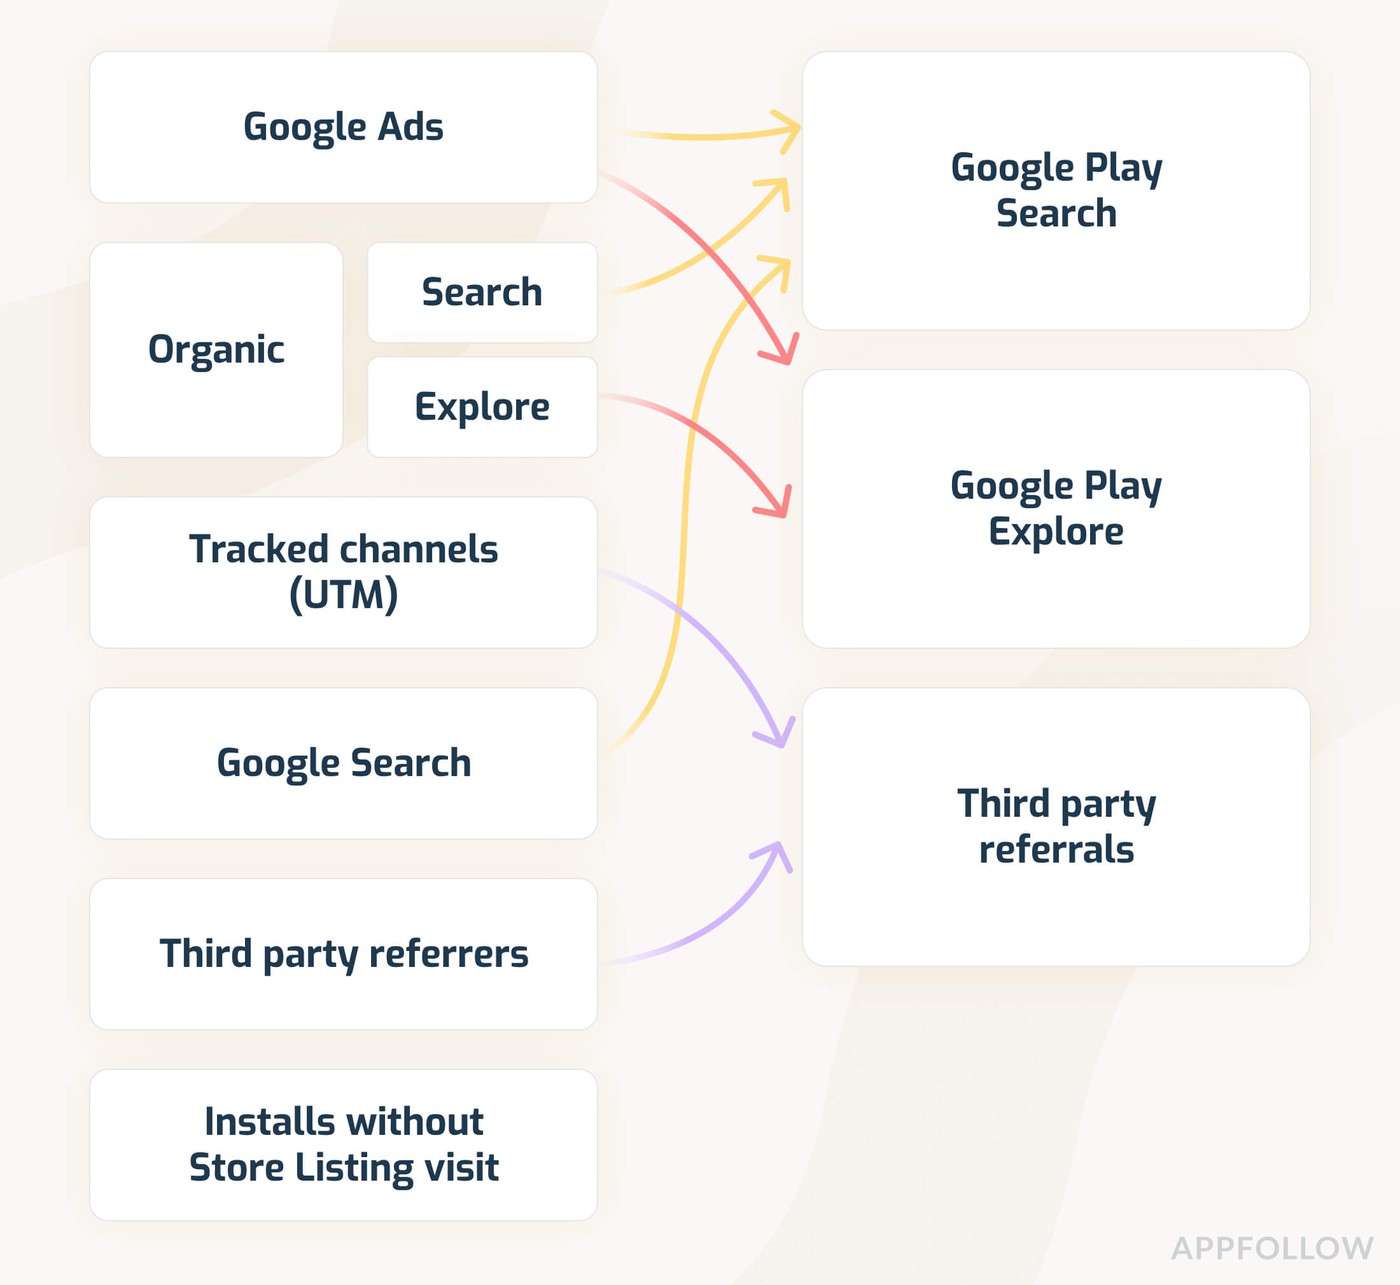
As we can see, none of these channels can be called purely organic. But it is not uncommon for developers to avoid using Google User Acquisition Channels, with Search as the main channel for ASO activity analysis.
Due to the algorithms of this app store, all traffic channels depend on each other:
- An increase in traffic from Search or Third-Party channels leads to an increase in category position - this directly affects the Browse channel.
- The total number of installs is the store's marker for ranking an app by keywords, an increase in the total amount of traffic from the Browse and Third-Party channels can affect the growth of positions, and cause an increase in traffic in the Search channel.
Conclusion
There are not a lot of parameters that are involved in the analysis of ASO, but almost every one of those that do can mean a lot to it. To ensure the best conditions are obtained, and ASO can be effectively analyzed after iterations, the ideal flow for your strategy is as follows:
- Determine the text metadata update time and its consequent release date to the store.
- Take a time interval with equal intervals of 7 days before and after the release.
- Check the key query position dynamics on the selected time interval.
- Study changes in search visibility of the app.
- Calculate changes in impressions (App Store) page views (Google Play) from search and search installs.
- Draw conclusions (whether the iteration is successful, whether the hypotheses are confirmed)
- Outline the next steps for working with text metadata.
In most cases, the method described above will help you correctly determine the result of ASO efforts.
