AppFollow’s Benchmark Report


In previous AppFollow posts, we’ve already talked about how a well-done ASO job can boost mobile app downloads and improve app ranks and positions in search results.
To find out how well the ASO job was done, you have to understand the quality of your app icon, screenshots, video, and average App Store and Google Play app ratings (you can A/B test with SplitMetrics to optimize conversion rates of your app page). The job was well-done if your conversion rate is higher than the average in the particular category. But how do you find out the average category conversion rate?
Today we are launching AppFollow Benchmark — a complete average App Store conversion rate report.
Why is conversion rate important for ASO? What is a good conversion rate?
There are three major conversion types:
- App Units / Impressions —the conversion rate from search impression to app install;
- App Units / Product Page Views — the conversion rate from product page view to app install;
- Product Page Views / Impressions —the conversion rate from search impression to product page view.
By analyzing these metrics you can determine the quality of on-page graphic optimization and understand user behavior: Do they download the app directly from the search or check the app page first?
A high App Units / Impression conversion rate shows that graphic optimization was done well — users download apps directly from the search results and do not open the product page. This means that the visible part of the app name, the subtitle, and the screenshots provide a clear overview of major app features and MVP.
If you see that the Product Page Views / Impressions conversion rate is high and App Units / Product Page Views is at the same time low, it means that something is missing on the product page — you need to understand why users are checking the product page but not downloading the app. It is possible that the problem is the app rating, or negative popular reviews, or maybe even text on the screenshots that is too small.
You can check conversion rates for your app in iTunes Connect analytics, but it’s not always clear if these metrics are good enough or the product page should be improved.
To answer this question, in February 2018 we at AppFollow have analyzed more than 1,000 apps and 350M unique impressions in the App Store worldwide and found average conversion rates in 20 categories.
This data can be useful for analyzing the quality of work done on App Store optimization, as well as for planning subsequent ASO strategies and steps.
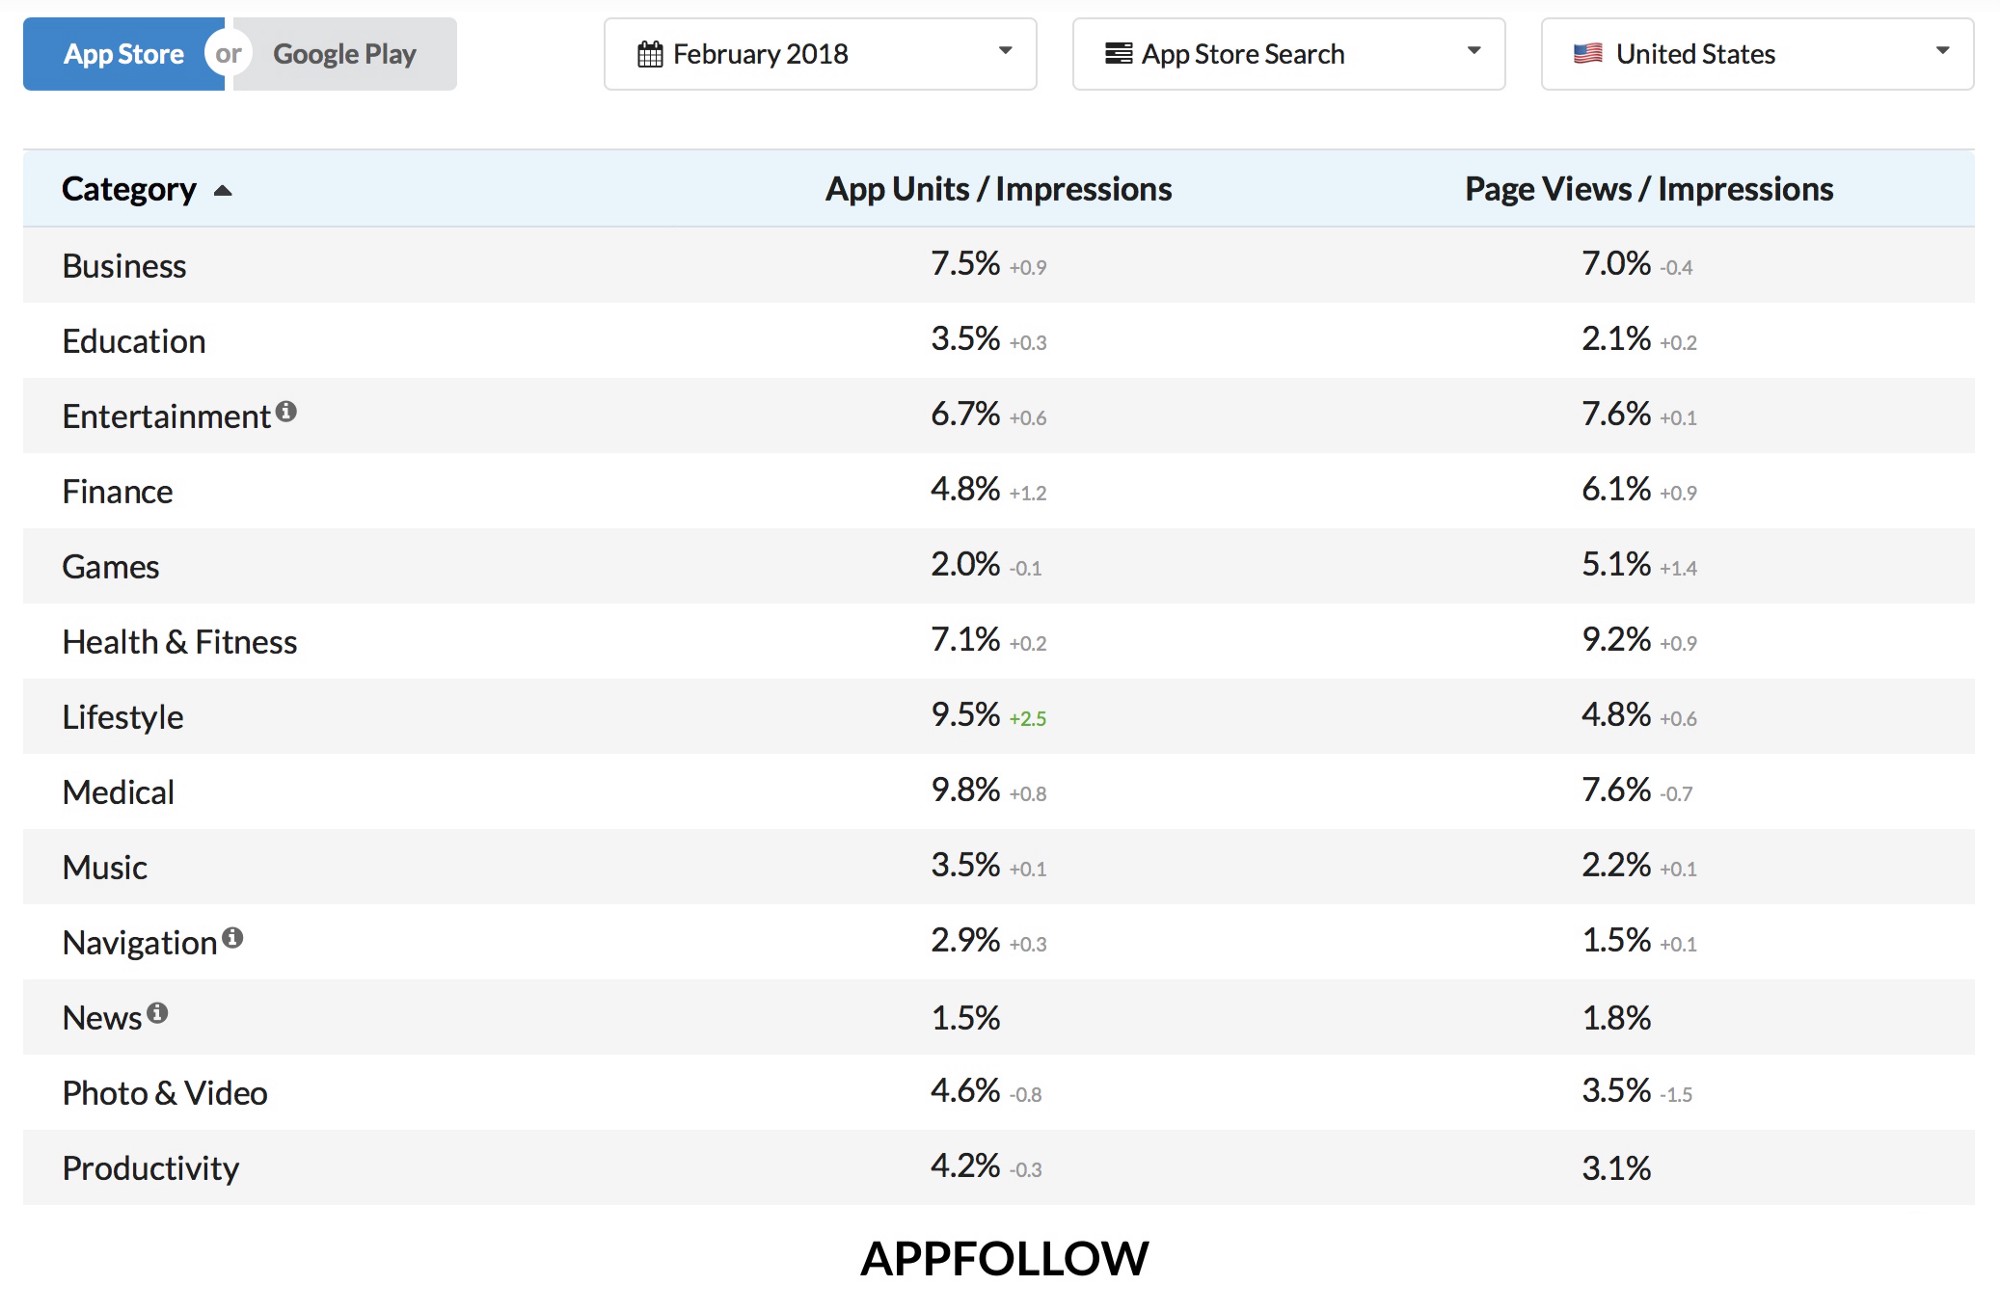
The maximum average App Units / Impressions conversion rate was 9% — in the Medical category, that means that users who are searching for the Medical apps in most cases install them directly from search results without going to the product page.
This can be explained that users search for a specific app created by a specific company. They don’t need to compare several competitors and choose the best one.
The minimum average App Units / Impressions conversion rate in February was 1.5% — in the News category. That means that competition in this category is very high and users want to check all the product pages before downloading.
In some cases, the App Units / Page View conversion is higher than 100%. This means that the majority of users download the app directly from the search results without opening the app page. In this case, the most important conversion rate is the App Units / Impressions.
The full report is available on our website for anyone who is interested. No sign-up or payments required.
Data can be filtered by channels:
- App Store Search — Search traffic;
- App Store Browse — Top Charts and Featuring traffic;
- App Referrer — Traffic from other apps;
- Web Referrer — Mobile web traffic.
It is also possible to filter data by country. Currently, only the United States, the United Kingdom, and Russia are supported. Google Play data will be available soon.
We will update this report every month, so if you want to receive updated data, subscribe to our newsletter.
If you want to share your data, please invite a new user aso2018@appfollow.io to your iTunes Connect account with “Marketer” and “Sales” roles. Click here if you need help. Confidentiality and anonymity guaranteed ?
P. S.: Having questions or comments about this report? Ready to improve your average CR? Connect with us at help@appfollow.io.


