ASO Vault / Lesson #7
How to provide A/B test of graphics in the App Store and Google Play?
Intro
The main two tasks of ASO are to boost the app’s visibility and improve the conversion rate. In our previous articles, we’ve talked about how to boost the app’s visibility to get more impressions and page visits. In this article, you will learn how to boost the conversion to install rate.
A/B Testing process
The testing of app page elements is done in order to reduce the risks of a sharp change in conversion rate after an app update. The principles of testing are in the distribution of tested elements (2 or more) to the target audience of the application. With the help of A/B testing, it's possible to predict the most likely result of metadata updates of the app page.
App testing tools
Google A/B Testing tool is the most common tool for A/B testing of metadata.
Pros: it’s completely free and you can find it in the “Store listings experiments” in Google Play Console. With its help, you can test up to 3 variations of metadata for a localized app version, globally or at the special app page. Below are the elements available for testing:
- App icon
- Screenshots
- Video
- Description picture
- Short description
- Full description
Cons: Performing testing on all traffic channels (both organic and advertising campaigns) and the confidence interval of the test result both have a certain margin of error. After the applied result, you have to monitor the real changes in conversion rate. Another disadvantage is the inability to test graphics other than those meant for Google Play, but it’s not Google’s fault :).
Apple Search Ads. Testing graphics in the App Store is done by using Apple Search Ads. With its Creative Sets, you can configure up to 10 sets of app screenshots and videos from those uploaded to the current app version, and see with which sets of graphical assets convert better.
There are a few notable differences:
- You can only test graphical assets - screenshots and videos
- The testing is done only within the ad itself. The app metadata will remain the same.
- All metadata for testing must be present on the app page already, so if you have a complex app page design, there will be only so much you can truly test.
Third-party testing solutions. These will help you build a separate app landing page that emulates a given app store page that will receive traffic in order to conduct testing.
Some of these solutions will present raw data (the number of page views and the number of conversions per install), and leave you to interpret the result yourself (ASO Giraffe). Some have an analytical platform (Splitmetrics) that is able to conduct testing, present raw data, and calculate the expected result based on input data.
Among the advantages is the testing of any part of the App Store or Google Play app page on any type of user (which is especially convenient if you already know your target audience).
A disadvantage is in the high cost for working with platforms and a separate fee for attracting traffic to the landing page, which sometimes is far from cheap.
Testing changes on the “live” app page. If no other method is available, it's possible to conduct tests not only in the format of simultaneous testing but also by gradually changing graphic elements at equal time intervals. This method is the riskiest because you force your users to accept the current graphic assets without any alternative. Therefore, this method can be tried when you have test results on Google Play and you don't have the resources to test graphics for the App Store in some other way.
Rules to conduction of testing
Almost all of the rules below will apply to the Google A/B testing tool as it's the most common metadata testing tool.

Source: appfollow.io
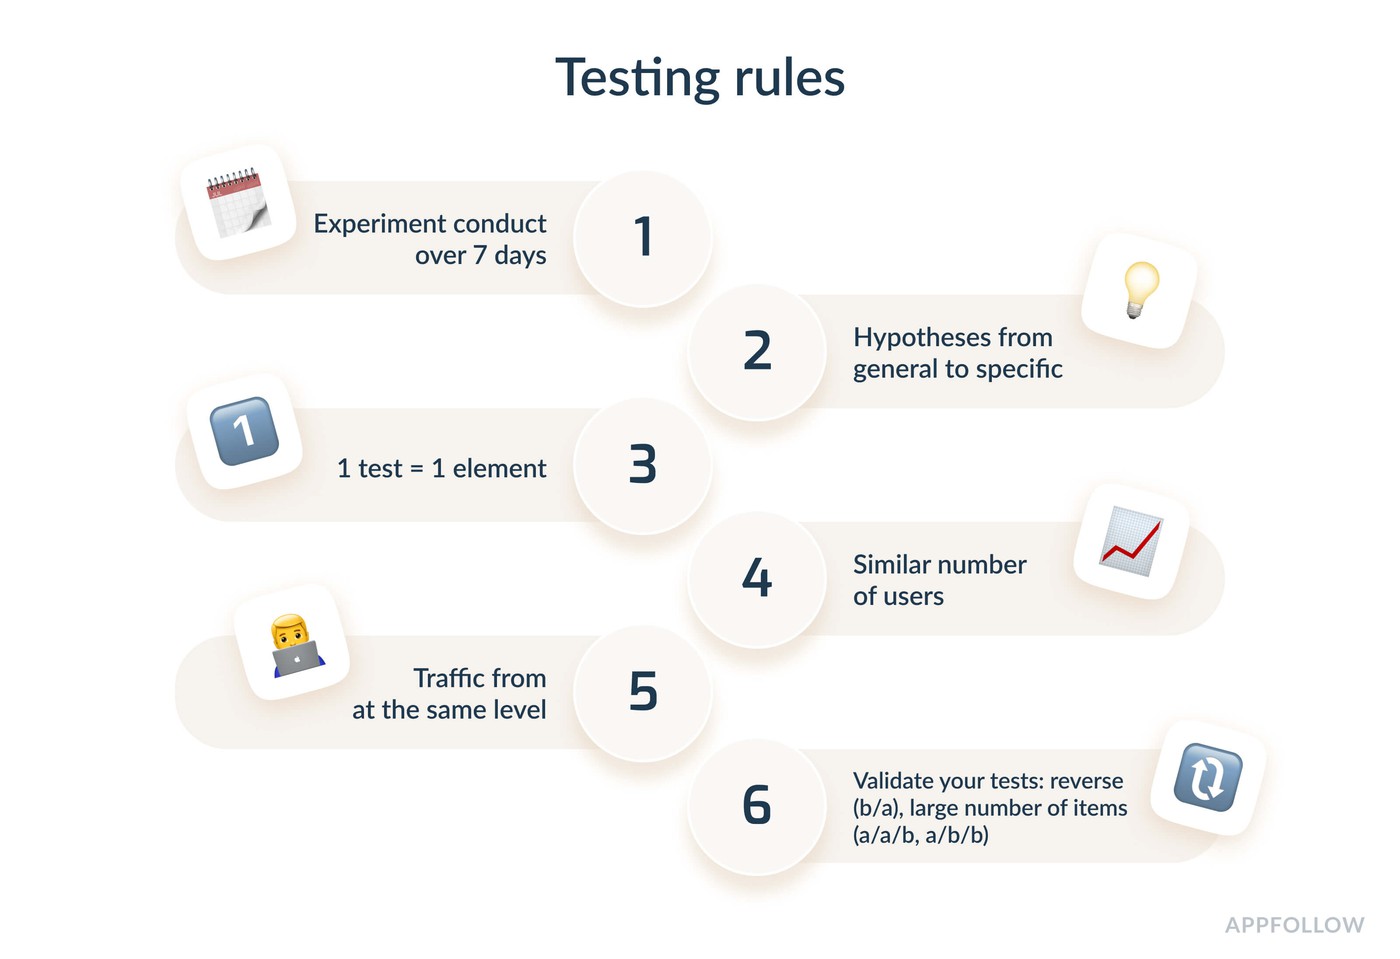
1. Each experiment should be conducted over 7 days. Some users behave differently in the store depending on the day of the week - thus giving root to the definition of Weekly fluctuations. For instance, on Monday, the popularity of sports apps grows, and on Friday, the popularity of taxis does the same thing. To account for these fluctuations, conduct tests for at least 7 days - despite your app category and other factors.
2. Plan hypotheses from general to specific. To avoid repetition, it’s necessary to distribute hypotheses from large-scale (background, location of mockups, colors) to small (slogans, highlighting elements, etc.) during planning.
3. Test one element in one testing scenario. In order to interpret the results more easily, it’s necessary to test one element in a single test scenario. Testing two or more elements (icon + screenshots) can lead to a situation where the icon increases conversion and the screenshots decrease it. You will not get hard data this way.
4. Conduct testing with a similar number of users. It’s done with the same goal - to reduce the margin of error during testing.
5. Keep paid traffic flow at the same level. When testing with the built-in Google Play tool, the presented options are split equally across traffic from all traffic sources. It’s not worthwhile to increase or decrease the number of purchased installations for a more accurate result.
6. Validate your tests. To validate your tests, you can run reverse tests (B/A), or tests with a large number of items (A/B/B, A/A/B). If the result is not false positive, it will be confirmed during testing.
Google A/B testing tool lets you test up to 3 test sets of elements + the current one simultaneously. When setting up a hypothesis, make sure to have more than one option. In a single test case, it’s necessary to run tests in A/B /B format. If you are unsure of the test result, run the validation test in the same format.
This approach can help you to avoid a false-positive test result since the efficiency is calculated with a confidence interval of 90% (for conventional instruments, a confidence interval of 95%).
Interpreting the results
Depending on the testing tool used, you will have various options to interpret the results. Some tools provide you with raw data that you need to interpret yourself using an Excel spreadsheet. Some of them have functionality that will present you with the result of conversion growth.
Test interpretation in Google Play leaves a lot of questions unanswered.
Once each tested variant has the necessary number of installs to interpret the results, you can see an indicator of effectiveness.
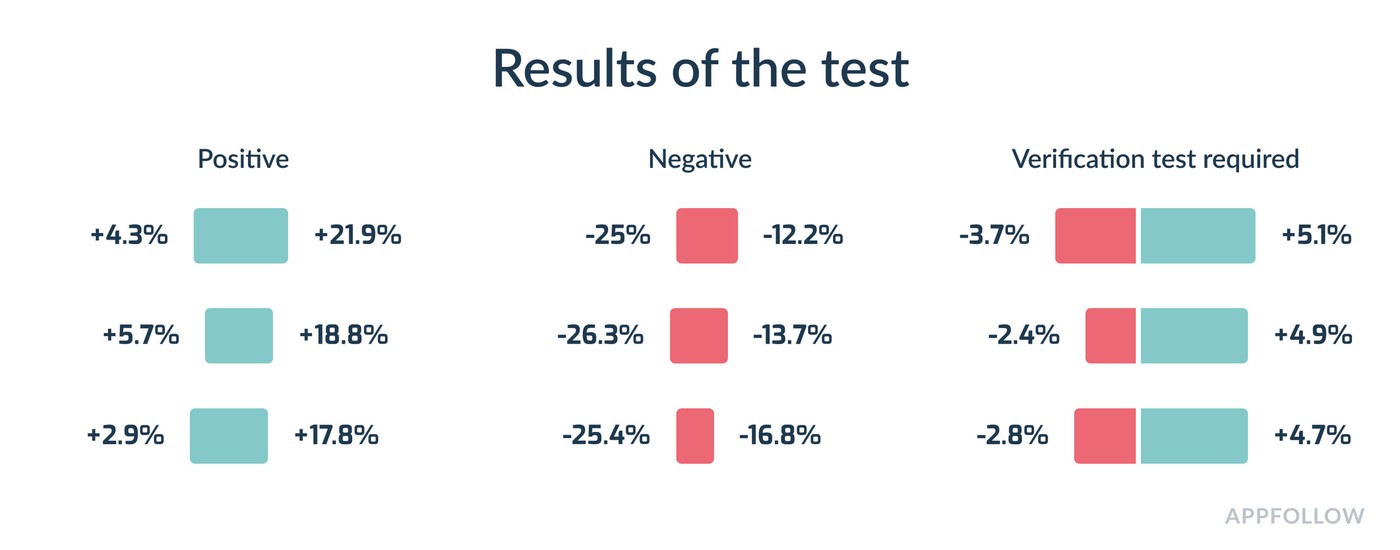
An indicator of effectiveness is the percentage of a possible change in the number of installs when applying the current option with a 90% probability.

The data you get from a given tool is an average indicator and it must be compared with the current position of traffic across all channels. If you are actively running advertising campaigns, you need to pay attention to the entirety of the product funnel - from the conversion of ad creatives to retention indicators.

Conclusion
Testing the elements of an application page is crucial to the success of any application. By conducting testing, you can cover a variety of tasks: audience research, the need for certain app mechanics, current trends, as well as increasing the app conversion itself.
Prioritize the elements you intend to test if you need to adjust your app conversion. Decide which elements need to be improved first and foremost, and outline the goals the testing is trying to achieve.
Formulating clear hypotheses and building a test plan will help you stay focused on the research. To get ideas, use all possible channels, don’t focus only on competitors' references.
Make sure to choose the tool that will suit your needs, convenience, and budget. Don't forget that it’s easier to conduct an experiment and interpret the results in a 7-day time frame, with stable traffic, and with well-defined hypotheses.
Compliance with all the rules above will help you get more realistic results, and reduce the likelihood of a deplorable experience overall.


